Abstract
Background:
Glomerular filtration rate (GFR)-estimating equations are used to determine the prevalence of chronic kidney disease (CKD) in population-based studies. However, it has been suggested that since the commonly used GFR equations were originally developed from samples of patients with CKD, they underestimate GFR in healthy populations. Few studies have made side-by-side comparisons of the effect of various estimating equations on the prevalence estimates of CKD in a general population sample.
Patients and methods:
We examined a population-based sample comprising adults from Wisconsin (age, 43–86 years; 56% women). We compared the prevalence of CKD, defined as a GFR of <60 mL/min per 1.73 m2 estimated from serum creatinine, by applying various commonly used equations including the modification of diet in renal disease (MDRD) equation, Cockcroft–Gault (CG) equation, and the Mayo equation. We compared the performance of these equations against the CKD definition of cystatin C >1.23 mg/L.
Results:
We found that the prevalence of CKD varied widely among different GFR equations. Although the prevalence of CKD was 17.2% with the MDRD equation and 16.5% with the CG equation, it was only 4.8% with the Mayo equation. Only 24% of those identified to have GFR in the range of 50–59 mL/min per 1.73 m2 by the MDRD equation had cystatin C levels >1.23 mg/L; their mean cystatin C level was only 1 mg/L (interquartile range, 0.9–1.2 mg/L). This finding was similar for the CG equation. For the Mayo equation, 62.8% of those patients with GFR in the range of 50–59 mL/min per 1.73 m2 had cystatin C levels >1.23 mg/L; their mean cystatin C level was 1.3 mg/L (interquartile range, 1.2–1.5 mg/L). The MDRD and CG equations showed a false-positive rate of >10%.
Discussion:
We found that the MDRD and CG equations, the current standard to estimate GFR, appeared to overestimate the prevalence of CKD in a general population sample.
Introduction
Glomerular filtration rate (GFR) is an important indicator of kidney function.Citation1 However, in practice, since GFR is usually not directly measured for routine clinical or research purposes, markers, such as serum creatinine, are used to estimate GFR. Estimating equations, such as the modification of diet in renal disease (MDRD) study equationCitation2 or the Cockcroft–Gault (CG) equation,Citation3 are widely used for this purpose. However, the MDRD or the CG equations were developed from chronic kidney disease (CKD) populations and not from general population samples.Citation2,Citation3 Though several studies have successfully applied the MDRD equation, Rule et alCitation4 showed that although the MDRD equation was reasonably accurate in estimating GFR in patients with CKD, it significantly underestimated measured GFR in healthy persons in their cohort. Several other studies in general populations have also reported similar issues with the MDRD equation.Citation5–Citation11 It was postulated that the use of an equation developed for CKD patients with decreased GFR would potentially underestimate GFR in a healthy population.Citation12 An alternative Mayo clinic quadratic GFR-estimating equation was developed, using measured GFR from healthy kidney donors in addition to CKD patients, to provide an equation with higher degree of generalizability.Citation4
The purpose of this report is to describe approaches for using GFR-estimating equations in a general population sample in which we use traditional and alternative cutoffs to define CKD, to describe the strategies adopted in the absence of a direct measure of GFR, and to examine the accuracy of each cutoff. Hence, we analyzed the data from a population-based study of predominantly white subjects aged 43–86 years from Wisconsin to study the incidence of CKD and its related risk factors.
Patients and methods
The methods used to identify and describe the population have appeared in previous reports.Citation13–Citation15 In brief, a private census of the population of Beaver Dam, Wisconsin, was performed from September 1987 to May 1988 to identify all residents in the city or township of Beaver Dam who were 43–84 years of age. Of the 5,924 eligible individuals (98% Caucasians), 4,926 (83.1%) participated in the baseline examination between March 1, 1988, and September 14, 1990. Comparisons between participants and nonparticipants at the time of the baseline examination have appeared elsewhere.Citation13 Written informed consent was obtained from each subject. This study followed the recommendations of Declaration of Helsinki and was approved by the Human Subjects Committee of the University of Wisconsin Medical School, Madison.
Of 4,926 individuals who participated in the baseline examination, there were 4,898 individuals with serum creatinine measurements and complete covariate information from the study population for the cross-sectional analysis.
The study included the following examinations: (1) measuring weight, height, systolic and diastolic blood pressure by a trained observer; (2) administering standardized questionnaire that collected information regarding participants’ demographic characteristics and details regarding cigarette smoking, alcohol intake, medical histories, and medications taken, including diagnosis of diabetes or hypertension by a physician.
Casual blood specimens were obtained for the measurement of plasma glucose and serum creatinine levels. Plasma and serum were stored without preservative at −80°C in cryogenic vials with O-rings for up to 17 years, until the vials were shipped on dry ice to the University of Minnesota laboratory for the analyses. Serum creatinine was measured by an enzymatic method (CREA plus®; Roche Diagnostics, Indianapolis, IN, USA) using the Roche Modular P Chemistry Analyzer (Roche Diagnostics), consistent with the current National Kidney Disease Education Program (NKEDP) recommendations for standardizing serum creatinine measurement.Citation16 The laboratory coefficient of variability (CV) was 1.96% at a level of 0.76 mg/dL and 2.2% at a level of 3.6 mg/dL. Serum cystatin C was determined by nephelometry technique using the Dade Behring BN100 nephelometer (Deerfield, IL, USA). The interassay precision was determined at 2 control levels: 1.72 mg/L (CV 6.4%) and 0.78 mg/L (CV 5.2%).
Age was defined as the participants’ age at the time of baseline examination. Education was categorized as below high school, and high school and above. Body mass index (BMI) was defined as participants’ weight in kilograms divided by the height in meters squared. Hypertension was defined as a systolic blood pressure of 140 mm Hg or higher, a diastolic blood pressure of 90 mm Hg or higher, or the combination of self-reported hypertension diagnosis by a physician and the use of antihypertensive medications. Persons were defined as having diabetes mellitus if they had high blood glucose or a history of diabetes diagnosis by a physician, or if they are treated with insulin, oral hypoglycemic agents, or diet. High blood glucose is defined as the presence of a casual blood glucose value >200 mg/dL (11.1 mmol/L) or elevated glycosylated hemoglobin value >2 standard deviations above the mean for a given age–gender group.Citation17
The reexpressed MDRD equation was used to estimate GFR from serum creatinine.Citation2 Estimated GFR (eGFR) was also calculated using the CG equationCitation3 indexed for body surface area, the cystatin C equationCitation18 incorporating age, sex, and race, the Mayo equation,Citation4 and the combined serum creatinine and cystatin C equation.Citation18 CKD was primarily defined as eGFR < 60 mL/min per 1.73 m2 consistent with stage 3, 4, or 5 CKD. We also used the following secondary definitions of CKD: eGFR < 45 mL/min per 1.73 m2, cystatin C level >1.23 mg/L (corresponding to an eGFR <60 mL/min per 1.73 m2),Citation18,Citation19 and cystatin C >99th percentile (corresponding to cystatin C level >1.67 mg/L) among subjects without diabetes mellitus and hypertension.
Statistical methods
First, we described the baseline characteristics of the population. Second, we examined the distribution of eGFR categories (<40 mL/min per 1.73 m2, 40–49 mL/min per 1.73 m2, 50–59 mL/min per 1.73 m2, 60–69 mL/min per 1.73 m2, 70–79, and ≥80 mL/min per 1.73 m2) calculated by each GFR-estimating equation. We then analyzed the distribution of cystatin C levels and also compared the prevalence of cystatin C level >1.23 mg/L (corresponding to an eGFR <60 mL/min per 1.73 m2)Citation18,Citation19 obtained by eGFR categories according to the various estimating equations. We chose this direct cystatin C cutoff as the standard to compare, instead of using the cystatin C-based GFR-estimating equations from the CKD-Epidemiology StudyCitation18 because these estimating equations were also originally derived from CKD samples, and we suspected, based on the distribution of their eGFR categories in a preliminary analysis, that it could have similar underestimation of GFR as the creatinine-based equations.
Third, we compared the performance of the CKD definition of eGFR < 60 mL/min per 1.73 m2 from the serum creatinine-based GFR-estimating equations (MDRD, CG, and Mayo equations) with that of the CKD definition of cystatin C level >1.23 mg/L. We calculated sensitivity, specificity, positive predictive value, negative predictive value, 1-sensitivity, and 1-specificity as the quantitative measures of validity.Citation20 We also examined whether the following alternative strategies would perform better: (1) by using a lower eGFR cutoff of 45 mL/min per 1.73 m2 or (2) by combining CKD definitions from more than 1 serum creatinine-based estimating equation. We examined an ad hoc definition of CKD as MDRD equation eGFR <45 mL/min per 1.73 m2 or Mayo equation eGFR < 60 mL/min per 1.73 m2.
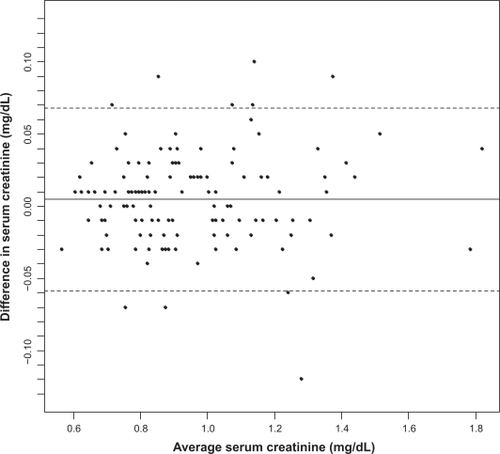
Finally, despite following the laboratory calibration traceable to criterion standard reference methods in measuring serum creatinine,Citation16 we examined in a Bland–Altman plot, whether residual differences in laboratory measurements between our laboratory (Fairview laboratory) and the Cleveland Clinical Laboratory were the basis for the observed underestimation of eGFR from MDRD equation. In this interlaboratory reliability substudy, we performed paired measurements of serum creatinine from the Fairview laboratory and the Cleveland Clinical Laboratory on 134 subjects from the current study sample.
We also performed the following supplementary analyses. We examined selected factors, including age, gender, smoking, alcohol intake, BMI, diabetes mellitus, and hypertension and their association with CKD defined as cystatin C level >1.23 mg/L by using multivariable logistic regression models; we calculated the odds ratio (OR) and 95% confidence interval (CI) of CKD associated with each factor. We also replicated the entire analysis using an alternate cystatin C cutoff, defined as cystatin C >99th percentile among subjects without diabetes mellitus and hypertension, as the standard to compare. All analyses were performed in Statistical Analysis System (version 9.1; SAS, Institute, Cory, NC).
Results
describes the baseline characteristics of the study population. In brief, slightly more than half of the subjects were women, approximately 70% had high school and above education, and about one-fifth of them were current smokers. The mean serum creatinine level was 0.9 mg/dL and mean serum cystatin C was 0.9 mg/L. In the same population, the mean eGFR varied according to the estimating equation used; it was the lowest for MDRD equation with a mean MDRD eGFR of 76.2 mL/min per 1.73 m2 and the highest for Mayo equation with mean Mayo eGFR of 93.5 mL/min per 1.73 m2.
Table 1 Baseline characteristics of the study population
presents the distribution of eGFR categories according to the various estimating equations. The prevalence of CKD defined as eGFR <60 mL/min per 1.73 m2 was 17.2% with the MDRD equation, 16.5% with the CG equation, 4.8% with the Mayo equation, 14.1% with the cystatin C equation that included terms for age and gender, 12.1% with the equation that included cystatin C, serum creatinine, age, and gender, and 9.5% when using a definition of cystatin C >1.23 mg/L.
Table 2 Distribution of eGFR and cystatin C according to various estimating equations
also shows the distribution of cystatin C levels by eGFR categories according to the various estimating equations. For this comparison, we used criteria from earlier reportsCitation19,Citation21 that showed that serum cystatin C level of 1 mg/L corresponds to a GFR of approximately 80 mL/min per 1.73 m2 and cystatin C level of 1.23 mg/L corresponds to a GFR of approximately 60 mL/min per 1.73 m2. We found that there is an apparent underestimation of the GFR when comparing the MDRD and CG equations with the eGFR categories and cystatin C levels side by side. For example, the mean cystatin C level was only 1 mg/L (interquartile range, 0.9–1.2 mg/L) among those identified to be having eGFR in the range of 50–59 mL/min per 1.73 m2 by the MDRD equation. Similarly, the mean serum cystatin C level was only 1.1 mg/L (interquartile range, 0.9–1.2) among those identified to be having eGFR in the range of 50–59 mL/min per 1.73 m2 by the CG equation. However, with the Mayo equation, the mean cystatin C level among those identified to be having eGFR in the range of 50–59 mL/min per 1.73 m2 was 1.3 mg/L (interquartile range, 1.2–1.5 mg/L).
We also compared the prevalence of cystatin C >1.23 mg/L by eGFR categories according to various estimating equations (). Only 24% of those identified to be having eGFR in the range of 50–59 mL/min per 1.73 m2 by the MDRD equation had a cystatin C level >1.23 mg/L; for the CG equation this finding was similar (23.7%). For the Mayo equation, 62.8% of those with eGFR in the range of 50–59 mL/min per 1.73 m2 had cystatin C levels >1.23 mg/L.
In the current study, we were interested in defining CKD based on a serum creatinine-based eGFR cutoff because only serum creatinine levels were available from all study participants at both the baseline and subsequent follow-up examinations. In , we, therefore, compared the performance of a CKD definition of eGFR <60 mL/min per 1.73 m2 from serum creatinine-based GFR-estimating equations with that of a CKD definition of cystatin C level >1.23 mg/L. We also examined whether the following alternative strategies would perform better: (1) by using a lower eGFR cutoff of 45 mL/min per 1.73 m2 or (2) by combining CKD definitions from more than one serum creatinine-based estimating equations. In general, an eGFR cutoff of <60 mL/min per 1.73 m2 based on the MDRD and CG equations had moderate sensitivity and specificity. However, both these equations showed a false-positive rate of >10%. An eGFR cutoff of <60 mL/min per 1.73 m2 based on the Mayo equation appeared to have adequate specificity (98.8%) and low false-positive rate (1.2%) but a low sensitivity (38%). When we used an eGFR cutoff of <45 mL/min per 1.73 m2 to define CKD, the false-positive rate of MDRD equation dramatically improved to 1.2%. Finally, we examined an ad hoc definition of CKD as MDRD equation eGFR of <45 mL/min per 1.73 m2 or Mayo equation eGFR of <60 mL/min per 1.73 m2. The ad hoc definition appeared to function similar to the Mayo equation eGFR cutoff of <60 mL/min per 1.73 m2.
Table 3 Accuracy of various eGFR cutoffs to define kidney disease
In a Bland–Altman plot () on 134 subjects with paired measurements of serum creatinine from the Fairview laboratory and the Cleveland Clinical Laboratory, we found that all but nine subjects had the difference in serum creatinine between these two laboratory measurements within ±2 standard deviations.
Figure 1 Bland–Altman plot comparing serum creatinine (mg/dL) measurements from Fairview and Cleveland Clinical Laboratories on n =134 subjects with paired measurements.
In a supplementary analysis, we examined the association between selected factors and CKD, defined as a cystatin C level >1.23 mg/L. The OR (95% CI) for CKD was 1.14 (1.12–1.16) for age (per year), 1.08 (0.85–1.37) for gender (men vs women), 0.99 (0.78–1.24) for education (below high school vs high school and above), 1.78 (1.28–2.48) for smoking (current vs former/never), 1.00 (0.99–1.01) for alcohol intake (grams/week), 1.07 (1.05–1.09) for BMI (per kg/m2), 1.25 (0.95–1.64) for diabetes mellitus, and 2.00 (1.55–2.57) for hypertension. In the second supplementary analysis, when we repeated the analysis in using cystatin C >99th percentile among subjects without diabetes mellitus and hypertension as the standard to compare, the results were found to be essentially the same.
Discussion
In a population-based cohort of white middle-aged to older adults from Wisconsin, we found that the MDRD and CG equations, the current standard to estimate GFR, appeared to overestimate the prevalence of CKD. When we compared serum cystatin C levels side by side with eGFR categories from these equations, it appeared that this was related to an underlying underestimation of eGFR. In this general population sample, these current standard GFR-estimating equations also had high false-positive rates of more than 10% when compared with a cystatin C approach in identifying kidney disease. Our findings add to the existing literature that has reported similar unexpected findings with the MDRD equation when applied to general population samples.Citation4–Citation11
Published estimates from the third National Health and Nutrition Examination Survey (NHANES) (comparable to our baseline examination period) reported the prevalence of eGFR <60 mL/min per 1.73 m2 to be 4.5%.Citation22 In the recent NHANES 1999–2004, the prevalence of eGFR < 60 mL/min per 1.73 m2 was found to be 8.1%.Citation23 In the current study, we found that the prevalence estimates of CKD varied widely between the different GFR-estimating equations. While the prevalence rate of CKD defined as eGFR <60 mL/min per 1.73 m2 was 17.2% with the MDRD equation and 16.5% with the CG equation, it was only 4.8% with the Mayo equation. Also, when we defined CKD as cystatin C level >1.23 mg/L, the prevalence of CKD was 9.5%. The substantial differences in the prevalence of CKD by different GFR-estimating equations suggest that selection bias in their original study samples may limit their generalizability. In particular, the high prevalence estimates came from equations that were originally derived from CKD populations, whereas the low prevalence estimates came from the Mayo study, which included kidney donors, a group who may be considered to be “super healthy”Citation4 compared with general population samples.
When the MDRD equation was initially published in 1999,Citation24 it was shown that a direct application of the MDRD equation without calibration to the Cleveland Clinical Laboratory, where the MDRD serum creatinine levels were measured, would provide biased estimates of GFR.Citation25 In a calibration substudy involving NHANES III samples, Coresh et alCitation25 noted that the bias in estimating GFR was only approximately 8% at a GFR of 25 mL/min per 1.73 m2 but was more than 25% at a higher GFR of 100 mL/min per 1.73 m2. It is possible that in addition to calibration issues between laboratories, this pattern of lower difference in GFR estimation among subjects with kidney disease compared with larger differences among healthy subjects is partly due to a GFR underestimation bias with the MDRD equation when applied to general population samples.
In this context, Rule et alCitation4 showed that in spite of calibration, the MDRD equation could be applied accurately in patients with CKD, whereas it substantially underestimated GFR in healthy persons. In the Framingham Heart Study, Fox et alCitation6 noted that even after calibration, the use of an MDRD eGFR cutoff of <60 mL/min per 1.73 m2 overestimated CKD in women; a different ad hoc cutoff defined as eGFR at or below the sex-specific fifth percentile was used to define CKD in that study. Several other studies in non-CKD populations have also reported similar issues with the MDRD equation.Citation7–Citation10 It has been hypothesized that as regression analysis, a statistical technique which fits data to the observed mean, was used in developing these GFR-estimating equations, the accuracy of the GFR estimates would be lower in populations with different ranges of GFR than in the MDRD sample population.Citation12 It is, therefore, possible that the use of an equation developed for CKD patients with decreased GFR would in turn underestimate GFR in a healthy population.Citation12
In NHANES III, when Clase et alCitation5 applied the MDRD equation and found an unexpected high prevalence of CKD among nondiabetic US adults, it was believed to be entirely explained by the lack of calibration of serum creatinine values.Citation26 Since the publication of the reexpressed MDRD equationCitation2 and the use of standardized serum creatinine assay measurements in the latest NHANES survey, calibration may be less of an issue in the current NHANES prevalence estimates.
Therefore, the recent findings of a substantially higher national estimate of low eGFR in the NHANES 1999–2004 that could not be fully explained by risk factors, such as an aging US population and an increased prevalence of diabetes, hypertension, and obesity,Citation23 are consistent with our hypothesis that the MDRD equation perhaps may be underestimating eGFR when applied to a general population sample. In contrast to the findings for low eGFR, the higher prevalence rate of albuminuria observed in the NHANES 1999–2004 was almost entirely explained by adjustment for risk factors, such as age, diabetes, hypertension, and obesity.Citation23 This further strengthens our hypothesis, as for a true increase in CKD one would expect comparable increases in both albuminuria and low eGFR. We believe that further studies are needed in the generalizability of MDRD equation to non-CKD populations.
Brenner and SavitzCitation27 demonstrated that in epidemiological studies examining associations between specific risk factors and a relatively rare outcome, specificity of case diagnosis should take precedence over sensitivity for the sake of study validity. They showed that although increasing the specificity and sacrificing sensitivity may compromise precision to some extent, the latter can often be fully compensated for by an increased sample size (or control: case ratio).Citation27 However, an imperfect specificity compromises power, despite increased sample size.Citation27 In this context, a corollary observation based on our findings is that in studies, such as ours examining risk factors for CKD, kidney disease definitions with higher specificity, such as an MDRD eGFR of <45 mL/min per 1.73 m2, may be more desirable than the commonly used cutoff of MDRD eGFR of <60 mL/min per 1.73 m2–which has higher sensitivity but lower specificity.
The main advantages of our study include its population-based nature and the availability of serum creatinine and cystatin C from all subjects for a side-by-side comparison. The main study limitation is the lack of a gold standard, a direct measurement of GFR, to compare as a standard against the various GFR-estimating equations. This may have biased our estimates of sensitivity and specificity comparing CKD definition from various GFR-estimating equations. However, it should be noted that we did not expect to observe underestimation of GFR before the study and did not have the current results as an a priori hypothesis before data collection. In fact, the current study was originally aimed at studying risk factors of CKD, defined as MDRD eGFR <60 mL/min per 1.73 m2. In the current analysis, we followed a pragmatic approach and chose a direct cystatin C cutoff as the standard because the underlying hypothesis of this article is that the application of GFR-estimating equations originally developed in CKD samples underestimates the true GFR value in a general population sample.
Another potential limitation is that in one of the analyses, we defined CKD as cystatin C >99th percentile among study subjects without diabetes or hypertension. However, all our study subjects were older than 45 years. Similar definitions in previous studies used a cutoff of cystatin C >99th percentile among those subjects without diabetes or hypertension and among young adults (ie, 20–39 years). Due to the age difference, our 99th percentile level is higher than similar cutoffs from young adults in previous studies. It is possible that some of the older adults in our study may be misclassified as being free of CKD.
In summary, in population-based sample of white middle-aged adults from Wisconsin, we found that the MDRD and CG equations appeared to overestimate the prevalence of CKD and that this was related to an underestimation of eGFR. These current standard equations also had a high false-positive rate of more than 10% when compared with a direct cystatin C cutoff in identifying kidney disease. Furthermore, these findings may also have potential clinical implications. As eGFR calculations are now appearing in reports from clinical laboratories, values of eGFR that are falsely positive would lead to a series of unnecessary tests. Our findings add to the existing literatureCitation4–Citation11 and support the argument that further research is required before we conclude regarding the generalizability of MDRD equation to non-CKD populations.
Acknowledgements
This study was supported by National Institutes of Health (NIH) grant EYO6594 (RK and BEKK), National Institute on Aging (NIA) grant AG11099 (KJC), and National Institute of Diabetes and Digestive and Kidney Diseases (NIDDK) grant DK73217 (RK, AS).
All authors contributed to the intellectual development of this paper. Anoop Shankar and Ronald Klein had the original idea for the study. Kristine E Lee analyzed the data. Kristine E Lee, Anoop Shankar, Ronald Klein, Barbara EK Klein, Karen J Cruickshanks, Paul Muntner, F Javier Nieto, Peter C Brazy, and Lorraine G Danforth provided statistical expertise and critical corrections to the manuscript and were involved in manuscript revisions. Ronald Klein, Barbara EK Klein, Karen J Cruickshanks, and Anoop Shankar procured funding for the study.
Disclosure
There are no conflicts of interest related to this manuscript.
References
- National Kidney FoundationK/DOQI clinical practice guidelines for chronic kidney disease: evaluation, classification, and stratificationAm J Kidney Dis2002392 Suppl 1S1S26611904577
- LeveyASCoreshJGreeneTUsing standardized serum creatinine values in the modification of diet in renal disease study equation for estimating glomerular filtration rateAnn Intern Med2006145424725416908915
- CockcroftDWGaultMHPrediction of creatinine clearance from serum creatinineNephron197616131411244564
- RuleADLarsonTSBergstralhEJSlezakJMJacobsenSJCosioFGUsing serum creatinine to estimate glomerular filtration rate: accuracy in good health and in chronic kidney diseaseAnn Intern Med20041411292993715611490
- ClaseCMGargAXKiberdBAPrevalence of low glomerular filtration rate in nondiabetic Americans: Third National Health and Nutrition Examination Survey (NHANES III)J Am Soc Nephrol20021351338134911961022
- FoxCSLarsonMGLeipEPCulletonBWilsonPWLevyDPredictors of new-onset kidney disease in a community-based populationJAMA2004291784485014970063
- RigalleauVLasseurCRaffaitinCThe Mayo Clinic quadratic equation improves the prediction of glomerular filtration rate in diabetic subjectsNephrol Dial Transplant200722381381817127699
- RischLSaelyCHNeyerUPrevalence of decreased glomerular filtration rate in patients seeking non-nephrological medical care – an evaluation using IDMS-traceable creatinine based MDRD as well as Mayo Clinic quadratic equation estimatesClin Chim Acta20073781–2717717157286
- TwomeyPJReynoldsTMThe MDRD formula and validationQJM2006991180480517041249
- MaaraviYBursztynMHammerman-RozenbergRStessmanJGlomerular filtration rate estimation and mortality in an elderly populationQJM2007100744144917553810
- PoggioEDWangXGreeneTVanLFHallPMPerformance of the modification of diet in renal disease and Cockcroft-Gault equations in the estimation of GFR in health and in chronic kidney diseaseJ Am Soc Nephrol200516245946615615823
- StevensLALeveyASClinical implications of estimating equations for glomerular filtration rateAnn Intern Med20041411295996115611494
- LintonKLKleinBEKleinRThe validity of self-reported and surrogate-reported cataract and age-related macular degeneration in the Beaver Dam Eye StudyAm J Epidemiol199113412143814461776618
- KleinRKleinBELeeKEChanges in visual acuity in a population. The Beaver Dam Eye StudyOphthalmology19961038116911788764783
- ShankarAKleinRKleinBEThe association among smoking, heavy drinking, and chronic kidney diseaseAm J Epidemiol2006164326327116775042
- MyersGLMillerWGCoreshJRecommendations for improving serum creatinine measurement: a report from the Laboratory Working Group of the National Kidney Disease Education ProgramClin Chem200652151816332993
- KleinBEKleinRLeeKEComponents of the metabolic syndrome and risk of cardiovascular disease and diabetes in Beaver DamDiabetes Care200225101790179412351479
- StevensLACoreshJSchmidCHEstimating GFR using serum cystatin C alone and in combination with serum creatinine: a pooled analysis of 3,418 individuals with CKDAm J Kidney Dis200851339540618295055
- ShlipakMGCystatin C: research priorities targeted to clinical decision makingAm J Kidney Dis200851335836118295049
- SzkloMNietoFJEpidemiology: Beyond the Basics1st edSudbury, MAJones and Bartlett Publishers2007343404
- CoreshJAstorBDecreased kidney function in the elderly: clinical and preclinical, neither benignAnn Intern Med2006145429930116908921
- CoreshJAstorBCGreeneTEknoyanGLeveyASPrevalence of chronic kidney disease and decreased kidney function in the adult US population: Third National Health and Nutrition Examination SurveyAm J Kidney Dis200341111212500213
- CoreshJSelvinEStevensLAPrevalence of chronic kidney disease in the United StatesJAMA2007298172038204717986697
- LeveyASBoschJPLewisJBGreeneTRogersNRothDModification of Diet in Renal Disease Study GroupA more accurate method to estimate glomerular filtration rate from serum creatinine: a new prediction equationAnn Intern Med1999130646147010075613
- CoreshJAstorBCMcQuillanGCalibration and random variation of the serum creatinine assay as critical elements of using equations to estimate glomerular filtration rateAm J Kidney Dis200239592092911979335
- CoreshJEknoyanGLeveyASEstimating the prevalence of low glomerular filtration rate requires attention to the creatinine assay calibrationJ Am Soc Nephrol200213112811281212397055
- BrennerHSavitzDAThe effects of sensitivity and specificity of case selection on validity, sample size, precision, and power in hospital-based case-control studiesAm J Epidemiol199013211811922192549