Abstract
Background
Many noninvasive arterial assessment techniques have been developed, measuring different parameters of arterial stiffness and endothelial function. However, there is little data available comparing different devices within the same subject. Therefore, the purpose of this study was to examine the repeatability and interrelationships between 3 different techniques to measure arterial stiffness and to compare this with forearm-mediated dilation.
Methods
Carotid-radial pulse wave velocity was measured by the Sphygmocor (SPWV) and Complior (CPWV) devices, cardio-ankle vascular index (CAVI) was measured by the VaSera device, vascular structure and function was assessed using ultrasonography and evaluated for reliability and compared in 20 apparently healthy, college-aged men and women.
Results
The intraclass correlation coefficient and standard error of the mean for the Sphygmocor (R = 0.56, SEM = 0.69), Complior (R = 0.62, SEM = 0.69), and VaSera (R = 0.60, SEM = 0.56), indicated moderate repeatability. Bland-Altman plots indicated a mean difference of 0.11 ± 0.84 for SPWV, 0.13 ± 1.15 for CPWV, and −0.43 ± 0.90 for CAVI. No significant interrelationships were found among the ultrasound measures and SPWV, CPWV, and CAVI.
Conclusions
The three noninvasive modalities to study arterial stiffness reliably measures arterial stiffness however, they do not correlate with ultrasound measures of vascular function and structure in young and apparently healthy subjects.
During the last decade there has been a great interest in the detection of early vascular disease in order to prevent further cardiovascular events. Consequently several techniques have been developed to estimate arterial stiffness (CitationCockcroft et al 1997; CitationWilkinson et al 1998), which has been a number of cardiovascular risk factors (CitationTaquet et al 1993; CitationCockcroft et al 1997; CitationWilkinson et al 1998; CitationMatsui et al 2004). Moreover, pulse wave velocity (PWV) has been shown to be a independent predictor for cardiovascular morbidity and mortality in the general population and in patients with hypertension, type 2 diabetes, and end-stage renal disease (CitationNichols and O’Rourke 1990; CitationCockcroft et al 1997; CitationLaurent et al 2001, Citation2003; CitationLondon and Cohn 2002; CitationLondon et al 2003; CitationPannier et al 2005; CitationHansen et al 2006). This leads to the conclusion that that PWV is a useful tool in risk assessment for cardiovascular event and risk stratification (CitationLaurent et al 2006).
PWV is calculated by measuring the pulse transit time and the distance traveled between two selected sites (ie, arterial distance over transit time), which is inversely related to the distensibility of the arterial walls. Currently, at least three devices, Sphygmocor® 2000 (AtCor Medical, Sydney, Australia), Complior SP® (Artech Medical, Pantin, France), and VaSera® VS-1000 (Fukuda Denshi, Tokyo, Japan), are commonly used to assess arterial stiffness (CitationAsmar et al 1995; CitationWilkinson et al 1998; CitationNgim et al 1999; CitationRajzer et al 1999; CitationAsmar et al 2001; CitationRavikumar et al 2002; CitationMahmud and Feely 2003). The Sphygmocor® 2000 and Complior SP® measure PWV, while the VaSera® VS-1000 measures the cardio-ankle vascular index (CAVI). CAVI is a pressure-independent index indicating the natural stiffness of the blood vessel and is based on the stiffness parameter β (CitationYambe et al 2004). Although several large studies demonstrated that these noninvasive techniques may be valid instruments for determining vascular function, to date no study has compared these three devices in the same subject and no information is available regarding the comparison of these different parameters.
Forearm-mediated vasodilation (FMD) is the noninvasive standard to determine endothelial function in subjects at risk for cardiovascular disease. However there are no comparative data available between the PWV techniques and FMD. Beyond the study of vascular function, early structural changes especially carotid intimal-media thickness has been considered as a significant predictor for CV morbidity and mortality (CitationChambless et al 2000; CitationO’Leary and Polak 2002; CitationWattanakit et al 2005). Taking into account the sequential changes of the vasculature in the pathogenesis of hypertension and atherosclerosis, early detection of atherosclerotic disease should be focused on noninvasive detection of functional and morphological changes of the vasculature (CitationDuprez et al 2000; CitationCohn et al 2005). There is only limited information available regarding the correlation between parameters providing information about functional changes and parameters regarding vascular structure.
The purpose of the present study was to determine: 1) the reliability of the three devices (Complior®, Sphygmocor®, VaSera®) in noninvasive assessment of arterial stiffness; 2) the relationship of the arterial stiffness parameters among the three devices; and 3) the relationship among of the arterial stiffness measures between three devices and established methods of assessing vascular structure, carotid intimal-media thickness of the carotid artery (IMT), and endothelial function, percent dilation of the brachial artery through flow mediated dilation (FMD), and endothelium-independent dilation (EID).
Methods
Subjects
Twenty healthy volunteers, 10 men and 10 women, aged 18–35 years (mean age, 25 ± 3.5 years) participated in this study. Participants were recruited from the university campus by advertisement. The study protocol was approved by the local medical ethical committee. All participants were nonsmokers, free of cardiovascular disease, and not using prescription medications as determined by a medical history questionnaire.
Study protocol
To avoid diurnal variations all testing was conducted at a similar time, between 6:00 a.m. and 10:00 a.m. on three separate assessment days. Participants arrived after an overnight fast and were asked to refrain from using caffeine the morning of each assessment day, but otherwise maintain their usual lifestyle between assessment days. Women of reproductive age were scheduled for assessments within three days after the completion of a cycle of menstruation. All testing procedures took place in a temperature controlled (22 °C) quiet room.
During assessment day one, height and weight were obtained using a wall-mounted stadiometer (Seca, Hamburg, Germany) and a digital scale (Tanita BWB-800, Tanita Corp., Tokyo, Japan). Participants were examined in a supine position during all procedures. Following 10 minutes of supine rest, left brachial blood pressure was measured by auscultation. The distance between the supra-sternal notch and the radial artery, and supra-sternal notch and the carotid artery were obtained. This distance obtained was used for all three devices and used throughout the remainder of the study to limit any potential variation. This procedure was followed during each assessment day to minimize variation.
Carotid-radial pulse wave velocity was assessed by the Sphygmocor® 2000, the Complior SP®, and the cardiac-ankle index was obtained by the VaSera® VS-1000 during each of the three separate assessment days. The order of each modality was randomized for each assessment day. The same investigator assessed the PWV using all devices and during all three assessments days to limit potential variation between testers. Carotid IMT, FMD, and EID were assessed following the PWV measures during day one of testing.
Study procedures
Sphygmocor 2000 (Atcor, Sydney, Australia), Software Version 7.01, utilizes a small pencil sized tonometer (pressure transducer) that was placed on the skin over the carotid and radial arteries. The radial and carotid pulses were located by palpation with the optimal position selected as the position that yielded the best quality signal output. The tonometer was placed at an angle that was perpendicular or directly above the artery with the appropriate pressure applied. The Sphygmocor PWV was determined by using the intersecting tangent algorithm to identify the foot of the waveform using gating to the R-wave of the electrocardiogram (ECG) for the 2 sites. The tonometer was placed at the same point of the arteries during all testing.
Complior SP (Atech Medical, Pantin, France), Software Version V1.1+, utilizes circular pulse wave sensors that were placed on the skin over both the carotid and radial arteries. The arteries were palpated to find the location of the points with the most pronounced pulse pressure waves. The pulse sensors were adjusted until the clearest signal was obtained. The Complior PWV was determined by focusing on the foot of the maximal systolic rise as the pulse transit time for continuous pressure-wave signals. The transducers were placed at the same location over the arteries during all testing procedures.
VaSera VS-1000 (Fukuda Denshi, Tokyo, Japan), Software Version 08-01, utilizes blood pressure cuffs with sensors for all four limbs to generate plethysmograms. The cuffs were placed on the upper arms, the right knee, and both ankles, ECG leads were placed on the wrists, and a phonocardiogram (PCG) was placed at the right sternal border in the 2nd intercostal space. All limbs were resting on limb cushions to avoid limb contact on the bed and to minimize potential variation. The VaSera Cardiac-Ankle Index is determined by using the EGC, PCG, and the waveform of the brachial and ankle arteries as a continuous measure based on the stiffness parameter β (CitationYambe et al 2004).
Endothelial function was measured via noninvasive ultrasound imaging. Participants were asked to lie supine for a 10-minute resting period where a three-lead ECG was placed for monitoring of heart rate and rhythm throughout the procedures. Standard ultrasonography equipment (Image Point HX, Philips Medical, Bothwell, WA) with a 7.5-MHz linear array probe was used to obtain B-mode images of the left brachial artery approximately 2–10 cm proximal to the elbow. The transducer was held at a fixed point over the imaged artery at a constant distance from the skin by a stereostactic arm. Following measurement of resting artery diameter, a blood pressure cuff was placed distally to the brachial artery (antecubital space) and inflated to a suprasystolic level (200 mm/Hg) for 5 minutes to induce ischemia. After abrupt release of the cuff pressure, changes in blood flow and vessel diameter (FMD) over a 5-minute period were imaged (CitationCelermajer 1998). The images were captured and triggered off the R wave of the electrocardiogram and then digitalized and stored on a personal computer for later analysis (CVI, Information Integrity, Boston, MA). FMD peak, time to peak, and area under the curve were calculated in a statistical program (GraphPad Prism version 4.0, GraphPad Software, Inc, San Diego, CA). The reproducibility for the FMD technique in our lab has shown a mean difference of 0.53% ± 0.28% for analyses (CitationKelly et al 2004). Vascular smooth muscle function was examined by EID by sublingual nitroglycerin (0.4 mg) administration. The brachial artery diameter was measured for 5 minutes following nitroglycerin administration using the ultrasound system as described above. Carotid IMT was measured by placing the ultrasound transducer distally to the carotid artery; images were obtained and analyzed for IMT (CVI, Information Integrity, Boston, MA) (CitationCelermajer 1998).
Data analysis
All data was tested for normality. Means and standard deviations were calculated for all descriptive variables. Intra-class correlation coefficients (R) and standard errors of measurement (SEM) were calculated for each instrument in order to examine the reliability of each device. Bland-Altman plots from the first and second measurement were utilized to further assess the repeatability of each device (CitationBland and Altman 1986). Separate Pearson’s simple correlation coefficients were calculated to assess the relationship of the different parameters obtained with the Sphygmocor®, Complior®, and VaSera® devices. Separate Pearson Product Moment correlation coefficients were also calculated to assess the relationship among carotid IMT, EID, FMD derived parameters and the vascular measures of the Sphygmocor®, VaSera®, and Complior® devices. Statistical analyses were performed using Statistical Package for the Social Sciences version 12.0 for Windows (SPSS, Inc, Chicago, IL). The level of statistical significance was set at P < 0.05 for all analyses.
Results
The subjects’ characteristics are presented in . The PWV values from the Complior® and Sphygmocor® were reasonable consistent across the three assessments and resulted in moderately acceptable intraclass correlations and low standard errors of estimate. The CAVI values from the VaSera® device resulted in similar results (). The interpretation of the Bland and Altman plots of the first two measurements supported the statistical results of the intraclass correlation analysis and standard errors of estimate scores for the Sphygmocor® (), the Complior® (), and the VaSera® (). The repeatability was acceptable for all three devices with only the CAVI scores resulting in a slight negative bias for the second assessment. The CAVI scores were also slightly more variable with two different scores falling outside of two standard deviations ().
Figure 1 Bland-Altman plot showing the intra-observer differences against the mean Pulse wave velocity value of Sphygomocor (Panel A), Complior (Panel B), and Cardiac-ankle index VaSera (Panel C). Dotted line represents two standard deviations from the mean value.
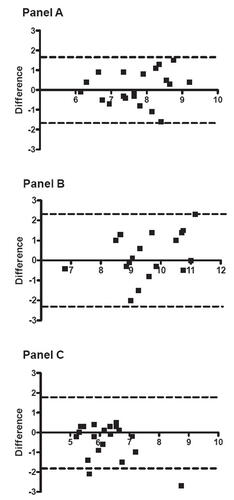
Table 1 Subjects’ characteristics
Table 2 Intraclass reliability coefficients and standard errors of measurement for pulse wave velocity, and cardio-ankle vascular index, across three measurements
The intra-class correlation coefficients for each of the arterial stiffness assessment devices including the Complior SP, the Sphymocor 2000, and the VaSera VS-1000 (), were all significant (R = 0.56–0.62, P < 0.001). The three arterial stiffness assessment devices had similar SEM: 0.56–0.69. These initial findings may suggest that similar results may be found with use of these instruments in intervention studies.
Mean EID, FMD, and carotid IMT values are presented in . The Pearson Product Moment Correlation for the relationships among the vascular scores of the devices indicated no significant correlations between the PWV devices or between the established ultrasound measures of vascular structure and function, and the vascular scores of the three PWV devices ().
Table 3 Mean brachial FMD and carotid IMT values
Table 4 Pearson Product Moment Correlation among ultrasound vascular measures and Sphygmocor pulse wave velocity (PWV), Complior PWV, and cardio-ankle vascular index (CAVI)
Discussion
The purpose of this study was to determine the reliability, and interrelationships of three devices (Sphygmocor® 2000, Complior SP®, and VaSera® VS-1000) commonly used in noninvasive determination of arterial stiffness. In addition, these devices were compared to established ultrasound techniques used to measure vascular function and structure. Although all three devices appeared to be reliable, they did not significantly correlate with each other or with the methods of measuring EID, FMD, and carotid IMT.
Similar to previous reports (CitationWilkinson et al 1998; CitationAvest et al 2005), the Bland-Altman plots of PWV for the Sphygmocor® and Complior SP® devices indicate that as PWV values increase, the variation may also increase, however only one value was greater than two standard deviations indicating that the repeatability is acceptable. The Bland-Altman Plots from the CAVI values of the VaSera® VS-1000 indicated a slight negative bias for the second group of assessments (mean difference -0.43 ± 0.88). More research in a less healthy group may be needed to assess the repeatability of the devices in a population more likely to be screened for cardiovascular diseases.
There were no significant correlations found between the three devices used to asses PWV in this study. It may be expected that the Complior SP® PWV and the Sphygmocor® 2000 PWV would correlate since the distance, and palpation sites used for both devices were identical, as well as utilizing similar methodology in the acquisition of PWV. The lack of a significant association between these devices may be explained by variation in sensor technology and software, as well as differences in the population-based conversion formulas. The use of simultaneously obtained radial and carotid arteries waveforms by the Complior SP® may have contributed to the slightly larger intra-class correlation coefficient by eliminating minor variations occurring as a result from sequential ECG gated measures. The Sphygmocor® 2000 device utilizes a handheld arterial tonometer that records pressure waveforms and measures propagation time using the foot-to-foot method with sequential recordings referenced to the R wave of the ECG. The Complior SP® device records radial and carotid waveforms simultaneously using mechanotransducers, and timing is referenced to the point of maximum systolic upstroke (CitationMillasseau et al 2005). The CAVI utilizes a different methodology by creating plethysmograms produced by applying an ECG, PCG, and blood pressure cuff sensors for the brachial, posterior tibial, and popletial arteries. The placement of the blood pressure cuff sensors may have introduced variance in calculation of the CAVI as the average blood pressure readings are used. It is possible that the placement of the various sensor introduced more variance resulting in the 2 scores outside of 2 standard deviations illustrated in the Bland-Altman plots. Furthermore, the CAVI measurement is based on the distance and time from the heart valve, brachial, popletial, and ankle pulses to calculate the stiffness index β. This could have contributed to the nonsignificant finding of interrelationship between the devices.
CitationMillasseau and colleagues (2005) compared carotid-femoral PWV measures from the Sphygmocor® to the Complior® device and found a substantial difference between resting values, which was attributed to a systematic difference in transit time. The authors further determined that the computation of PWV is mainly dependent on the algorithm used to determine transit time and that the contribution of other sources of variation is relatively minor. Therefore, the lack of interrelation between these devices may also be due to the use of different timing algorithms. Other potential influences that may have affected the relationship between the different devices include sympathetic activation with changes in heart rate and blood pressure (CitationBoutouyrie et al 1994; CitationOliver and Webb 2003). Although the same blood pressure reading was used for both the Sphygmocor® and the Complior®, it is possible that the blood pressure changed during the assessment session. The blood pressure used for the CAVI measurement was determined by the device, and defined as the average blood pressure obtained from the left and right brachial arteries, this may also have contributed to the lack of significant findings of interrelationship between the devices. Since pulse pressure amplification may differ between individuals, using the peripheral blood pressure obtained at brachial artery may have introduced a source of bias of assessment as well (CitationDavies and Struthers 2003). Change in heart rate between assessments may also have introduced variation between the devices, it was not possible to control for changes in heart rate or blood pressure in this study.
It will be of clinical importance to develop different PWV assessment tools that use similar timing algorithms in order to make PWV a more universal tool for assessment of vascular function. Furthermore, the values for these indices differ greatly, which will make it very difficult to establish reference values, and risk stratification by age and gender for PWV and/or other measures of vascular function. The lack of significant relationship between the 3 devices suggests that they cannot be used interchangeably and studies using different systems may not be comparable across the literature. These results indicates that caution should be used when estimating cardiovascular risk during clinical trials while drawing inferences from the results obtained using these 3 different devices.
There were no significant correlations found between PWV and the ultrasound measures of arterial structure (carotid IMT) and function (FMD) in this study. The correlation coefficients for several of these comparisons were small and had nonsignificant P-values. This finding is in agreement with CitationLiang and colleagues (1998) who reported no significant associations between brachial FMD and PWV. The author did report a significant association between IMT and PWV in an older healthy study population. In contrast, CitationWilson and colleagues (2004) found a significant association between PWV and brachial FMD in healthy young participants, but failed to find a significant association between PWV and brachial FMD in older participants with diagnosed type 2 diabetes as well as between IMT and PWV in either population, which is in agreement with the results of the present study. Contrary to these findings, CitationKobayashi and colleagues (2004) reported a significant association between PWV and brachial FMD as well as between IMT and PWV in participants with risk factors for cardiovascular disease (including type 2 diabetes) and diagnosed atherosclerosis. Interestingly, both Wilson and colleagues (1998) and Kobayahsi and colleagues (2004) suggested that combining these measures of arterial function and structure might increase predictive accuracy of cardiovascular risk.
It is apparent that there is a large amount of variation between measurements, with studies reporting conflicting results, suggesting that relationships may vary significantly between individuals, between studies, and between devices utilized to measure PWV. It is therefore possible that the lack of relationship between PWV, brachial FMD, and IMT found in the present study is due to the use of a relatively young and healthy study population. Moreover, the different devices used for obtaining PWV may further explain the lack of association found between PWV, carotid IMT, and brachial FMD. It is possible that a more diverse (and less healthy) sample may be needed to identify significant correlations between the vascular scores of the devices and established ultrasound measures of vascular structure and function. Moreover, PWV, FMD, and IMT evaluate different aspects of arterial health and atherosclerotic progress, and target different sites of the artery, which may help explain the lack of association between them. PWV measures arterial stiffening, which is most likely the result of functional changes within the vascular tree. FMD measures vasodilation and IMT measures medial hypertrophy, which are different segments of the arterial wall (CitationBoutouyire et al 1999; CitationKobayashi et al 2004).
The lack of interrelation between these devices may have pivotal implications in clinical intervention studies and final interpretation of data. Physicians and researchers should not use the devices investigated in this study interchangeably and caution should be used when making any inferences between studies utilizing these different devices in a relatively young and healthy population. In conclusion, the three noninvasive modalities investigated in this study may reliably measure PWV and indirectly arterial stiffness, but they fail to be consistent and in good agreement with each other and with ultrasound measures of endothelial function, and arterial morphology in this young and healthy population sample. A larger sample size with a greater range in cardiovascular risk will be needed in the future to verify these findings utilizing the assessment tools employed in this study.
Acknowledgements
Supported by: GCRC: M01-RR00400, General Clinical Research Center Program, NCRR/NIH
References
- AsmarRBenetosATopouchianJAssessment of arterial distensibility by automatic pulse wave velocity measurement. Validation and Clinical application studiesHypertension199526485907649586
- AsmarRTopouchianJPannierBPulse wave velocity as endpoint in large-scale intervention trial (The Complior Study)J Hypertens2001198131811330885
- AvestETHolewijnSStalenhoefAFHVariation in non-invasive measurements of vascular function in healthy volunteers during daytimeClin Science200510842531
- BlandJMAltmanDGStatistical methods for assessing agreement between two methods of clinical measurementLancet1986i307102868172
- BoutouyriePBussyCLacolleyPAssociation between local pulse pressure, mean blood pressure, and large-artery remodelingCirc1999100138793
- BoutouyriePLacolleyPGirerdXSympathtetic activation decreases medisum-sized arterial compliance in humansAm J Physiol1994267H1368H13767943382
- CelemajerDSTesting endothelial function using ultrasoundJ Cardiovasc Physiol199832S29S32
- ChamblessLEFolosomARCleggLXCarotid wall thickness is predictive of incident clinical stroke: the Atherosclerosis Risk in Communities (ARIC) studyAm J Epidemiol20001514788710707916
- CockcroftJRWilkinsonIBWebbDJAge, arterial stiffness and the endotheliumAge Ageing199726S453609506434
- CohnJNDuprezDAGranditsGAArterial elasticity as part of a comprehensive assessment of cardiovascular risk and drug treatmentHypertension2005462172015867132
- DaviesJIStruthersADPulse wave analysis and pulse wave velocity: a critical review of their strengths and weaknessesJ Hypertens2003214637212640232
- DuprezDADe BuyzereMLDe BackerTLRelationship between arterial elasticity indices and carotid artery intima-media thicknessAm J Hypertens20001312263211078184
- HansenTWStaessenJATorp-PedersenCPrognostic value of aortic pulse wave velocity as index of arterial stiffness in the general populationCirculation20061136647016461839
- KellyASKaiserDRDengelDRComparison of B-mode and echo tracking methods of assessing flow-mediated dilationUltrasound Med Bio20043014474915588955
- KobayashiKAkishitaMYuWInterrelationship between noninvasive measurements of atherosclerosis: flow-mediated dilation of brachial artery, carotid intima-media thickness and pulse wave velocityAtherosclerosis2004173131815177119
- LaurentSBoutouyriePAsmarRAortic stiffness is an independent predictor of all-cause and cardiovascular mortality in hypertensive patientsHypertension20013712364111358934
- LaurentSKatsahianSFassotAortic stiffness is an independent predictor of fatal stroke in essential hypertensionStroke2003341203612677025
- LaurentSCockcroftJVan BortelLExpert consensus document on arterial stiffness: methodological issues and clinical applicationsEur Heart J200627258860517000623
- LiangYLTeedeHKotsopoulosDNon-invasive measurements of arterial structure and function: repeatability, interrelationships and trial sample sizeClin Science19989566979
- LondonGMCohnJNPrognostic application of arterial stiffness: task forcesAm J Hypertens200215754812160201
- LondonGMGuerinAPMarachaisSJArterial media calcification in end-stage renal disease: impact on all-cause and cardiovascular mortalityNephrol Dial Transpant200318173140
- MahmudAFeelyJEffects of passive smoking on blood pressure and aortic pressure waveform in healthy young adults- influence of genderBr J Clin Pharmacol200357374314678338
- MatsuiYKarioKIshikawaJReproducibility of arterial stiffness indices (pulse wave velocity and augmentation index) simultaneously assessed by automated pulse wave analysis and their associated risk factors in essential hypertension patientsHypertens Res200427851715824467
- MillasseauSCStewartADPatelSJEvaluation of carotid-femoral pulse wave velocity, influence of timing algorithm and heart rateHypertension200545222615642772
- NgimCAAbdul-RahmanARIbrahimAPulse wave velocity as an index of arterial stiffness: a comparison between newly diagnosed (untreated) hypertensive and normotensive middle-aged Malay men and its relationship with fasting insulinActa Cardiol1999542778210596307
- NicholsWWO’RourkeMFMcDonald’s flow in arteries1990LondonEdward Arnold
- O’LearyDHPolakJFIntima-media thickness: A tool for atherosclerosis imaging and event predictionAm J Cardiol20029018L21L
- PannierBGuerinAPMarchaisSJStiffness of capacitive and conduit arteries: prognostic significance for and-stage renal disease patientsHypertension200545592615753232
- OliverJJWebbDJNoninvasive assessment of arterial stiffness and risk of atherosclerotic eventsATVB20032355466
- RajzerMWKlocekMKawecka-JaszczKAortic pulse wave velocity in young normotensives with a family history of hypertensionJ Hypertens1999171821410703874
- RavikumarRDeepaRShanthiraniCSComparison of carotid intima-media thickness, arterial stiffness, and brachial artery flow mediated dilation in diabetic and nondiabetic subjects (The Chennai Urban Population Study)Am J Cardiol200290702712356381
- TaquetABonithon-KoppCSimonARelations of cardiovascular risk factors to aortic pulse wave velocity in asymptomatic middle-aged womenEur J Epidemiol19939298308405315
- WattanakitKFolsomARChamblessLERisk factors for c ardiovascular event recurrence in the Atherosclerosis Risk in Communities (ARIC) studyAm Heart J20051496061215990741
- WilkinsonIBFuchsSAJansenIMReproducibility of pulse wave velocity and augmentation index measured by pulse wave analysisJ Hypertens1998162079849886900
- WilsonAMO’NealDNelsonCLComparison of arterial assessments in low and high vascular disease risk groupsAm J Hypertens2004172859115062880
- YambeTYoshizawaMSaijoYBrachio-ankle pulse wave velocity and cardio-ankle vascular indexBiomed Pharmacother200458suppl 1S95815754845