Abstract
The increasing prevalence of type 2 diabetes provides impetus for both development of new drugs to improve glycemic control and for reconsideration of treatment strategies with existing agents. Combination therapy with complementary drug classes that act on different aspects of glycemic control has been a particularly effective strategy. This work reviews the published literature reporting efficacy and safety/tolerability of nateglinide, a rapid-onset insulinotropic agent with a predominant effect to reduce postprandial glucose, when combined with metformin, a first-line agent that suppresses hepatic glucose production and thereby reduces fasting plasma glucose. The nateglinide/metformin combination has consistently been found to be both efficacious and well tolerated, whether given as initial combination therapy in drug-naïve patients or when added to metformin monotherapy. Maximum efficacy (Δ glycosylated hemoglobin [HbA1c]= −1.4% to −1.9%, sustained for up to 2 years of treatment) was seen in studies of drug-naïve patients in whom pharmacotherapy was initiated with the combination of nateglinide and metformin, and modest reductions in HbA1c (Δ = −0.5% to −1.2%, sustained for up to 24 weeks) were found when nateglinide was added to ongoing metformin monotherapy.
Conclusion: the combination of nateglinide and metformin provides a sustained degree of glycemic control not achievable with either agent given as monotherapy.
Introduction
The total prevalence of diabetes in the United States (both diagnosed and undiagnosed) is estimated to be 7%, representing 20.7 million people (CitationCenters for Disease Control and Prevention 2005). Population models based on data from the National Health and Nutrition Examination Survey (NHANES) project a diabetes burden of 14.5% of the total population (37.7 million people) by 2031 (CitationMainous et al 2007). Globally, the prevalence of diagnosed diabetes was estimated to be 2.8% in 2000 (171 million people) and is projected to rise to 4.4% by 2030 (366 million people) (CitationWild et al 2004). Moreover, it should be recognized that for every 2 people with known diabetes there is another with undiagnosed diabetes. This epidemic of diabetes is driven by Westernization in developing countries, by the increasing prevalence of obesity, and by the aging of the global population (CitationWild et al 2004). Models based on NHANES and census data project that, at age 18, the lifetime risk of developing diabetes exceeds 50% in obese individuals (body mass index [BMI] ≥30 but <35 kg/m2) (CitationNarayan et al 2007).
The health-care burden that would be imposed by treating the medical consequences of diabetes in such large numbers of patients is enormous and has given impetus for the development of new drugs to treat type 2 diabetes (T2DM, accounting for 90%–95% of all diabetes) more effectively and to a reconsideration of treatment strategies with existing agents. Diabetes is difficult to control with a single oral agent. Many patients fail to achieve adequate glycemic control (glycosylated hemoglobin [HbA1c] <7.0%) with monotherapy (particularly those with high baseline values) and even of those initially achieving good control, less than half will maintain this target level for 2 years (CitationCook et al 2007). Such observations have stimulated the development of combination therapies that match drugs with complementary mechanisms of action in the hope of obtaining better and longer-lasting glycemic control.
Rationale for combining metformin and nateglinide
Type 2 diabetes is a chronic, progressive disorder that results from inadequate β-cell compensation for, or adaptation to, insulin resistance (CitationKahn 2003). Thus, both insulin resistance and β-cell dysfunction precede the development of overt diabetes (CitationWeyer et al 1999). Furthermore, with increasing severity of glycemic dysregulation, the progressive decline in β-cell function is accompanied by an increasingly important contribution of excessive hepatic glucose production (HGP) (CitationDeFronzo et al 1989). Not surprisingly, therefore, no single oral antidiabetic drug (OAD) has been found to provide adequate, prolonged glycemic control as diabetes progresses, and there is a strong scientific rationale for combining OADs with complementary modes of action, ie, that target different pathogenetic factors.
Metformin, a biguanide, acts by decreasing HGP and increasing glucose clearance (CitationNatali et al 2006); it is the recommended first-line pharmacologic treatment for T2DM worldwide (CitationNathan et al 2006). Metformin primarily reduces fasting plasma glucose (FPG); it has no direct effect on β-cell function, and it is ineffective in the absence of insulin (CitationBailey et al 1996). In patients with moderate- to poorly-controlled T2DM, metformin monotherapy was found to decrease FPG by 60 mg/dL to 70 mg/dL and HbA1c by 1.5% to 2% (CitationDeFronzo 1999), but only about 25% of patients achieved the American Diabetes Association (ADA)-recommended goal of HbA1c <7.0% (CitationDeFronzo et al 1995). Metformin has a very low potential to induce hypoglycemia and, as with all OADs, the magnitude of reduction in HbA1c is proportional to the baseline value.
Nateglinide is one of a newer class of OADs, the “glinides,” which are rapid-onset, insulinotropic agents unrelated to the sulfonylureas. These agents are taken before meals (ac) and rapidly increase insulin secretion, essentially restoring (or replacing) the early insulin response, which is lost in patients with T2DM. These agents predominantly decrease postprandial glucose (PPG), which is an independent predictor of negative cardiovascular outcomes (CitationQiao et al 2002), thought to be mediated by oxidative stress (CitationCeriello 2000). Nateglinide is unique among glinides in that its pharmacodynamics closely match its pharmacokinetics, so it has both a rapid onset and short duration of action (CitationMcLeod 2004). Other glinides, such as repaglinide, have pharmacokinetics similar to those of nateglinide, but because of slow receptor dissociation, their insulinotropic actions are prolonged well beyond clearance of the drugs (CitationPratley et al 2001). This results in essentially identical reductions in PPG with the 2 agents, somewhat larger decreases in FPG and HbA1c with repaglinide than with nateglinide, but with substantially increased frequency of hypoglycemia with repaglinide than with nateglinide (CitationRosenstock et al 2004). In patients nearing glycemic targets, hypoglycemia becomes an increasingly important concern.
When given as monotherapy to patients with moderate- to poorly-controlled T2DM, nateglinide (120 mg ac) mono-therapy reduced HbA1c by 1.0% and FPG by 18 mg/dL, with no hypoglycemia (CitationRosenstock et al 2004). Because of their complementary modes of action, and their very low potential to elicit hypoglycemia, the combination of metformin and nateglinide would be predicted to be both safe and effective for the treatment of T2DM.
The purpose of this paper is to review all available information about the efficacy and safety of nateglinide in combination with metformin, whether used as initial combination therapy or with nateglinide added to ongoing metformin treatment.
Methods
To identify all published literature on the efficacy and safety/tolerability of nateglinide when combined with metformin in patients with T2DM, a search was performed of Medline, EMBASE, Biosis Previews, Current Contents, International Pharmaceutical Abstracts, and Cochrane Reviews, for publications appearing from 1998 to 2008. The search was limited to English language journals and required that both nateglinide (or synonyms) and metformin (or synonyms) appear as keywords in titles or in abstracts.
Eight review articles and 25 original publications were identified. Of the 25 original publications, 5 were abstracts (4 of which described studies that were subsequently reported in full papers, and 1 of which provided insufficient information to understand the study design or efficacy results), 4 dealt with health economics, 3 were nonclinical, 1 described a clinical study of <12 weeks’ duration, and 1 reported on safety but included no efficacy data. Thus, only 11 publications reported original findings relating to the efficacy and tolerability of ≥12-week treatment with the nateglinide/metformin combination. The 8 review articles were obtained, and examination of their reference lists revealed no additional original publications describing the efficacy and safety of nateglinide in combination with metformin.
Clinical trials of metformin/nateglinide combination therapy for T2DM
summarizes the study design and efficacy results from the 11 original publications. The publications include data from more than 12,500 patients who received nateglinide in combination with metformin for ≥16 weeks, and the mean baseline HbA1c levels ranged from ∼7.6% to 8.4%.
Table 1 Study designs and efficacy outcomes
Five of the 11 publications provide results from double-blind, randomized, controlled clinical trials (RCTs), 2 describe analyzes of subpopulations included in blinded RCTs, 1 was a 6-month extension of a blinded RCT, and 3 were open-label studies, 1 of which was an observational study of >11,000 patients treated under general practice conditions.
Randomized, double-blind trials
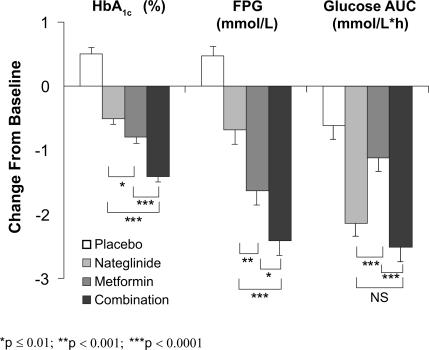
Five double-blind, RCTs have assessed the efficacy and safety of the combination of metformin and nateglinide for the treatment of T2DM. CitationHorton et al (2000) performed a 24-week, parallel-group study in patients randomized to receive nateglinide (120 mg ac, n = 179), metformin (500 mg tid, n = 178), nateglinide plus metformin (n = 172), or placebo (n = 172). Liquid meal tests were performed at baseline and at week 24 or endpoint, and HbA1c and FPG were measured periodically during the study. Participants were required to have been diagnosed with T2DM at least 3 months before study entry and to have been treated with diet/exercise alone during a 4-week washout period that preceded a 4-week placebo run-in phase. At baseline (week 0), the mean age, BMI, duration of diabetes, HbA1c, and FPG of participants were ∼58 years, 29.6 kg/m2, 4.6 years, 8.4%, and 10.9 mmol/L, respectively, and the 4 treatment groups were well balanced with respect to these baseline characteristics. As illustrated in , after 24-week treatment, HbA1c and FPG decreased significantly in each active treatment group and increased modestly in patients receiving placebo, relative to baseline. Postprandial glucose, as assessed by the glucose area under the curve (AUC) during the meal test, decreased in all treatment groups. Thus, relative to placebo, PPG decreased significantly only in the nateglinide monotherapy and in the combination therapy groups. At study endpoint, the placebo-adjusted changes in HbA1c were −0.9%, −1.2%, and −1.9% in the nateglinide, metformin, and combination groups, respectively, clearly showing an additive effect of nateglinide and metformin. Metformin monotherapy had a larger effect on FPG (Δ = −1.6 mmol/L) than did nateglinide monotherapy (Δ = −0.7 mmol/L) but, again, the effects of nateglinide and metformin were additive (Δ = −2.4 mmol/L). Moreover, essentially all of the reduction in PPG during combination therapy (Δ = −2.5 mmol/L•h) can be attributed to the effects of nateglinide (Δ = −2.1 mmol/L•h). The most common adverse events (AEs) were suggestive of hypoglycemia and diarrhea. Symptoms suggestive of hypoglycemia occurred most often in the combination group (26.2%) and there was no difference between the nateglinide and metformin monotherapy groups (12.8% vs 10.1%). The number of patients with confirmed hypoglycemia (symptoms plus plasma glucose measurement ≤3.3 mmol/L) was very low – 3 patients (<2%) in the nateglinide group, 1 (<1%) in the metformin group, and 5 (<3%) in the combination therapy group. Diarrhea was more common in the groups receiving metformin alone (19.7%) or in those receiving metformin combined with nateglinide (14.5%); these frequencies were 3- to 4-times higher than in the nateglinide monotherapy or placebo groups. Body weight did not change significantly relative to baseline in any treatment group. In summary, this study clearly demonstrated the complementary modes of action of nateglinide and metformin, the additive efficacy of the 2 agents, and a tolerability profile of the combination that did not differ from either of the monotherapy components.
Figure 1 Adjusted mean change from baseline in glycosylated hemoglobin (HbA1c), fasting plasma glucose (FPG), and glucose area under the curve (AUC) after Sustacal challenge. All parameters were significantly reduced from baseline (p ≤ 0.0001) in the active treatment groups. All values were significantly reduced compared to placebo (p ≤ 0.0001) except for glucose AUC with metformin monotherapy (not significant, NS). *p ≤ 0.01; **p ≤ 0.001; ***p ≤ 0.0001. Open bars = placebo; light gray bars = nateg-linide monotherapy; dark gray bars = metformin monotherapy; black bars = nateglinide plus metformin (CitationHorton et al 2000). Copyright © 2000 American Diabetes Association. From Diabetes Care®, Vol 23, 2000; 1660–1665. Reprinted with permission from The American Diabetes Association.
In a subsequent subgroup analysis, CitationHorton et al (2004) assessed the efficacy and tolerability of metformin, nateglinide, and their combination in the subset of patients (n = 401) from their earlier trial (CitationHorton et al 2000) who had not been previously exposed to any medication for diabetes. At baseline, the mean disease duration (∼4.0 years), HbA1c (8.2%), and FPG (10.2 mmol/L) in this treatment-naïve subgroup of patients were slightly less than those in the entire cohort described above. In this drug-naïve group, the patients who received combination therapy for 24 weeks experienced a major reduction in mean HbA1c (−1.6% from a mean baseline value of 8.2%; p < 0.0001) that was significantly greater than that seen with monotherapy (−0.8% for both treatments), or with placebo treatment (+0.3%). Thus, the placebo-adjusted change in HbA1c in drug-naïve patients receiving initial combination therapy with nateglinide and metformin was −1.9%, and of the patients receiving initial combination therapy, 70% achieved an endpoint HbA1c of <7% compared with 34%, 41%, and 17% in the groups receiving nateglinide monotherapy, metformin monotherapy, and placebo, respectively. All active treatments also resulted in significant reductions in FPG (Δ = −1.1, −1.2, −2.3, and +0.2 mmol/L) and in PPG excursions (Δ = −1.9, −1.0, −2.3, and −0.5 mmol/L) for nateglinide, metformin, combination, and placebo groups, respectively. The AE profile in this drug-naïve subgroup of patients was very similar to that seen in the whole cohort (described above). CitationMarre et al (2002) evaluated the effect of nateglinide as an add-on to high-dose metformin in patients with T2DM. This 24-week, double-blind, parallel-group RCT included 467 patients with T2DM treated with metformin monotherapy for ≥3 months who had been stabilized on metformin ≥1500 mg daily for at least 4 weeks prior to study entry. After a 4-week run-in during which all patients received metformin at a dose of 1000 mg bid, patients were randomized to receive nateglinide (60 mg ac, n = 155), nateglinide (120 mg ac, n = 160), or placebo (n = 152) added to the ongoing metformin (1000 mg bid) monotherapy.
At baseline, the mean age, BMI, duration of diabetes, HbA1c, and FPG in the whole cohort were ∼57 years, 29.4 kg/m2, 8.1%, and 9.9 mmol/L, respectively. The treatment groups were well balanced with respect to these baseline characteristics.
Addition of nateglinide at either dose to metformin resulted in a significant reduction of HbA1c compared with metformin plus placebo. The placebo-corrected reductions in HbA1c were −0.4% and −0.6% in the nateglinide 60-mg and nateglinide 120-mg groups, respectively. Larger, but still dose-related reductions were seen in patients with higher baseline HbA1c levels; in the subgroup of patients with a baseline value between 8% and 9.5%, the Δ HbA1c was −0.5% for the 60-mg dose and −0.8% for the 100-mg dose. In the subgroup of patients with baseline level > 9.5%, the Δ HbA1c was −0.8% and −1.4% for nateglinide 60 mg and 100 mg, respectively, while with placebo added to metformin HbA1c changed by less than 0.1% in all sub-groups of patients. Both doses of nateglinide also resulted in modest but significant reductions in FPG compared to placebo when added to metformin. Addition of 60-mg nateglinide to metformin had no effect on body weight, while treatment with 120-mg nateglinide plus metformin resulted in a 0.9-kg weight gain compared with treatment with metformin plus placebo.
The overall percentage of patients experiencing AEs was similar in all treatment groups (54.6%, 60%, and 58.8% in the metformin/placebo group, the metformin/nateglinide 60-mg group, and the metformin/nateglinide 120-mg group, respectively). The most commonly reported AEs were symptoms suggestive of hypoglycemia (3.9%, 8.4%, and 15.6%, respectively). When stratified by HbA1c level, most symptoms suggestive of hypoglycemia occurred with nateglinide 120 mg/metformin administered to patients with low baseline HbA1c(≤8%). Although a blood glucose level was recorded in 80% of the events, very few patients (n = 6, 1.1%) had confirmed hypoglycemia, defined as a symptomatic event with a plasma glucose equivalent ≤3.3 mmol/L, and none of these hypoglycemic episodes required intervention by a third party. As expected, since patients had been stabilized on metformin monotherapy for ≥3 months prior to study, the incidence of gastrointestinal AEs was low and similar in all treatment groups.
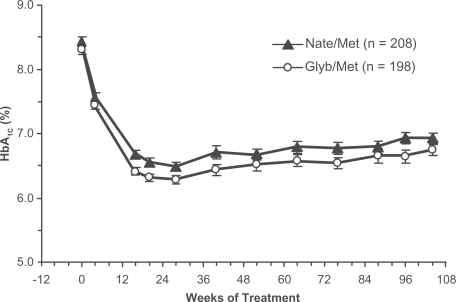
A 2-year study of initial combination therapy (PRESERVE-β) compared the effects of nateglinide plus metformin (nate/met) to those of glyburide plus metformin (glyb/met) in drug-naïve patients with relatively recently diagnosed T2DM (CitationGerich et al 2005). In this double-blind, parallel-group, RCT, 428 patients received open-label metformin (500 mg qd titrated to 1000 mg bid if tolerated) combined with either nateglinide (120 mg ac, n = 219) or glyburide (1.25 mg qd titrated to a maximum of 5 mg bid, n = 209). Blinding was achieved by use of matching placebo for nateglinide and glyburide. At baseline, the mean age, BMI, disease duration, HbA1c, and FPG were ∼53 years, 33.4 kg/m2, 1.8 years, 8.4%, and 10.0 mmol/L, respectively. The treatment groups were well balanced with respect to these baseline characteristics.
As illustrated in , both drug combinations produced substantial and sustained reductions in HbA1c. At study endpoint, the mean Δ HbA1c was −1.2% in the nate/met group and −1.5% in the glyb/met group (p < 0.0001 vs baseline for both groups, p = 0.1730 between groups). After 2 years of treatment, 39% of the nate/met group and 43% of the glyb/met group had achieved and maintained HbA1c < 7%.
Figure 2 Time course of HbA1c in drug-naïve patients with type 2 diabetes randomized to the nateglinide/metformin combination (closed triangles) or the glyburide/metformin combination (open circles). Mean ± SE, intention-to-treat population (CitationGerich et al 2005). Copyright © 2005 American Diabetes Association. From Diabetes Care®, Vol 28, 2005; 2093–2099. Reprinted with permission from The American Diabetes Association.
Consistent with their known mechanisms of actions and established effects on FPG and PPG, glyb/met was more effective in reducing FPG, and nate/met was more effective in reducing PPG. Thus, FPG was reduced by 1.6 mmol/L and 2.4 mmol/L after 104 weeks of treatment with nate/met and glyb/met, respectively (p < 0.0001 vs baseline for both groups, p < 0.008 between groups), whereas PPG excursions, as assessed by the incremental AUC0-120min during an oral glucose tolerance test (OGTT), was reduced by 94 mmol/L·min and 57 mmol/L·min after 104 weeks of treatment with nate/met and glyb/met, respectively (p < 0.0001 vs baseline for nate/met, p = 0.0112 vs baseline for glyb/met, p = 0.0592 between groups).
Most of the AEs seen during the 2-year treatment period were those that would be expected to occur in an aging, overweight population (eg, arthralgia [10.5% of both treatment groups], or hypertension [8.7% nate/met, 14.8% glyb/met]). The only common (>10%) AE that occurred predominantly (more than 2-fold difference in prevalence) in either treatment group was hypoglycemia, which was reported by 8.2% of the patients receiving nate/met and 17.7% of the patients receiving glyb/met (p = 0.003). The only serious AE suspected to be related to treatment was severe hypoglycemia that occurred in 2 patients receiving glyb/met. During 2-year treatment, there was a statistically significant change in body weight between the groups. There was a modest increase in body weight in patients receiving glyb/met (Δ = +0.8 kg) and a small decrease in weight in patients receiving nate/met (Δ = −0.4 kg, p = 0.0115 vs glyb/met).
Another publication recently reported results from the subgroup of participants in PRESERVE-β who were aged ≥65 years of age (CitationSchwarz et al 2008). This elderly subpopulation comprised 66 patients (33 patients in each treatment group), with a mean age, BMI, diabetes duration, HbA1c, and FPG of ∼70 years, 32 kg/m2, 2.1 years, 7.8%, and 158 mg/dL, respectively. The elderly patients receiving glyb/met were somewhat more obese and had a somewhat longer duration of known diabetes than did the elderly patients receiving nate/met (BMI = 33.5 kg/m2 vs 30.4 kg/m2, disease duration = 2.5 vs 1.7 years). After 2 years of treatment, the change from baseline in HbA1c was −1.2% in both treatment groups (p < 0.001 vs baseline for both treatments, p = 0.310 between treatments). Fourteen of 20 (70%) elderly patients completing 2 years of nate/met combination therapy maintained HbA1c < 7%, as did 13 of 20 (65%) elderly patients completing 2 years of glyb/met combination therapy. The change from baseline in FPG at study endpoint was −26 mg/dL and −36 mg/dL in patients receiving nate/met and glyb/met, respectively (p < 0.001 vs baseline for both treatments, p = 0.234 between treatments). The mean change in the PPG excursion, as assessed by the incremental AUC0-120min during OGTT, approached statistical significance in the nate/met group (Δ = −100 mmol/L·min, p = 0.071 vs baseline) but was considerably less in patients receiving glyb/met (Δ = −53 mmol/L·min, p = 0.385 vs baseline).
The overall AE profiles in the 2 treatment groups were very similar except for the incidence of hypoglycemia, which was significantly greater with glyb/met than with nate/met (p = 0.023). One incident of mild hypoglycemia occurred in one elderly patient receiving nate/met, while 1 hypoglycemic episode occurred in each of 8 elderly patients receiving glyb/met; 4 were considered mild, 3 were considered moderate, and 1 was severe and led to discontinuation from the study.
Another blinded RCT compared the efficacy and safety of nateglinide and gliclazide when added to metformin in patients with inadequate glycemic control (HbA1c between 6.8% and 9.0%) on metformin monotherapy (CitationRistic et al 2006). This 24-week, double-blind, double-dummy parallel-group study randomized 262 patients with T2DM, diagnosed at least 6 months previously, receiving metformin monotherapy for at least 3 months, at their individually maximum tolerated dose (≥1000 mg daily) for at least 2 months. Patients were also randomized to receive starting doses of nateglinide (60 mg ac, n = 133) or gliclazide (80 mg qd, n = 129), which were up-titrated monthly for the first 3 months if FPG <7 mmol/L, to maximum doses of 180 mg ac for nateglinide or 240 mg qd for gliclazide. At baseline, the mean age, BMI, duration of diabetes, HbA1c, and FPG were ∼62 years, 30 kg/m2, 6.9 years, 7.6%, and 8.8 mmol/L, respectively, and the treatment groups were well balanced with respect to these baseline characteristics. At week 24 or study endpoint, the least squares mean change from baseline in HbA1c was −0.41% in patients receiving nateglinide and −0.57% in those receiving gliclazide (p < 0.001 vs baseline for both groups, p = 0.099 between groups). At study endpoint, 35% of patients receiving nateglinide added to metformin and 47% of those receiving gliclazide added to metformin achieved HbA1c <7%. The decrease in FPG in patients receiving gliclazide (Δ = −0.8 mmol/L, p < 0.001 vs baseline) was somewhat greater than that in patients receiving nateglinide (Δ = −0.6 mmol/L, p < 0.001 vs baseline), but this difference was not statistically significant (p = 0.375). In contrast, PPG, as assessed by the maximum PPG excursion, was significantly decreased only in the nateglinide group (Δ = −0.7 mmol/L [p = 0.001] and −0.1 mmol/L [p = 0.663] for nateglinide and gliclazide, respectively, p = 0.037 between groups).
The incidence of suspected drug-related AEs was low and similar in the 2 groups (6.9% and 7.1% for nateglinide and gliclazide, respectively). The percentages of patients with at least one AE suggestive of hypoglycemia (∼25%) or with at least one confirmed hypoglycemic event (∼22%) were very similar in the 2 treatment groups. However, the percentage of patients with ≥3 confirmed hypoglycemic events was somewhat higher with gliclazide (12.7%) than with nateglinide (9.2%). It should be noted that the plasma glucose cutoff for confirmed hypoglycemia (>4.0 mmol/L) was higher in this study than in previously described studies.
Results from a 6-month extension of the study described above (CitationRistic et al 2006) were reported recently (CitationRistic et al 2007). A total of 120 patients in the nateglinide group and 109 patients in the gliclazide group completed the study, and most of these patients continued with the double-blind extension (112 patients [93.3%] in the nateglinide group and 101 patients [89.1%] in the gliclazide group). Glycemic control appeared to deteriorate somewhat during the 6-month extension, but qualitatively, the 1-year results mirrored the 6-month results. There was no significant difference between treatment regimens in the Δ HbA1c from baseline to week 52 (−0.14% for nateglinide and −0.27 for gliclazide, p = 0.396 between groups); 40% of patients receiving nateglinide plus metformin and 47.5% of those receiving gliclazide plus metformin achieved endpoint HbA1c <7%. The Δ FPG was somewhat greater in the gliclazide group (Δ = −0.7 mmol/L, p = 0.003 vs baseline) than in the nateglinide group (Δ = −0.2 mmol/L, p = 0.357 vs baseline), but the between-treatment difference was not statistically significant (p = 0.096). The change from baseline in the maximum PPG excursion was somewhat greater with nateglinide (Δ = −0.7 mmol/L, p = 0.087 vs baseline) than with gliclazide (Δ = −0.3 mmol/L, p = 0.500 vs baseline), but, again, the between-treatment difference was not significant (p = 0.470).
The AE profiles were similar in the 2 treatment groups during the extension, and a similarly low percentage of patients receiving natgelinide (6.3%) or gliclazide (6.9%) experienced ≥3 confirmed episodes of hypoglycemia. There was a statistically significant increase in body weight during the 52 weeks of study in patients receiving gliclazide plus metformin (Δ = 0.9 kg, p = 0.009 vs baseline); the change in body weight in the nateglinide plus metformin group was 0.4 kg and not statistically significant (p = 0.201 vs baseline).
Results from a 1-year, double-blind, parallel-group RCT comparing initial combination therapy with nateglinide plus metformin (nate/met) vs glibenclamide plus metformin (glyb/met) were published recently (CitationDerosa et al 2007). This study enrolled 248 treatment-naïve patients with T2DM diagnosed at least 6 months previously, who were overweight (BMI 25 kg/m2 to 28 kg/m2) and hypertensive (≥130/85 mmHg). During the first month, patients received either nateglinide (60 mg ac, n = 122) or glibenclamide (2.5 mg tid, n = 126). Metformin (500 mg tid) was added during the second month of treatment in both groups of patients, and during the subsequent 4 months both metformin and the insulinotropic agent were up-titrated to maximum daily doses of nateglinide (360 mg, 120 mg ac) or glibenclamide (15 mg, 5 mg tid) plus metformin (3000 mg, 1000 mg tid) if tolerated. The mean daily doses of nateglinide, glibenclamide, and metformin during the final 6 months of study were 300 ± 60 mg, 12.5 ± 2.5 mg, and 2500 ± 500 mg, respectively, with 119 patients receiving nate/met and 114 patients receiving glyb/met. Assessments of HbA1c, FPG, 2-hour PPG (after lunch), fasting lipids, blood pressure, and several prothrombotic factors were made periodically during the 12 months of treatment.
At baseline, the mean age, BMI, duration of diabetes, HbA1c, and FPG were ∼56 years, 26.5 kg/m2, 4.5 years, 8.2%, and 176 mg/dL, respectively, and the treatment groups were well-balanced with respect to these baseline characteristics. As summarized in , -year treatment of overweight, hypertensive, drug-naïve patients with T2DM with nate/met as initial combination therapy significantly decreased HbA1c, FPG, and PPG as well as lipoprotein (a) (Lp[a]), plasminogen activator inhibitor-1 (PAI-1), and homocysteine levels relative to baseline. In patients receiving the glyb/met combination, a significant decrease from baseline in HbA1c, FPG, and PPG was also seen after 12-month treatment; however, the improvement in HbA1c was significantly less with glyb/met than with nate/met, and glyb/met had no significant effect on any prothrombotic factor. Neither treatment significantly affected any fasting lipid parameter, blood pressure, or BMI. No safety or tolerability assessments were reported, nor were the percentages of patients achieving endpoint HbA1c < 7%. However, because the mean endpoint HbA1c with nate/met was 6.4% – while this was 7.3% in patients receiving glyb/met – it may be inferred that a substantially higher percentage of patients receiving nate/met than glyb/met achieved this glycemic target.
Table 2 Effects of initial combination therapy with nateglinide (Nate) or glibenclamide (Glyb) plus metformin (Met) on glycemic control and prothrombotic factors during 1-year treatment of overweight and hypertensive patients with type 2 diabetes (CitationDerosa et al 2007)
Open-label trials
In addition to the blinded, RCTs of combination therapy with metformin and nateglinide, 3 open-label studies of this combination have also been reported. CitationSchatz et al (2003) conducted a general practice observation study that followed 11,476 patients with T2DM who were treated with nateglinide and metformin for 3 to 4 months (mean observation period = 96 days). The recommended dose of nateglinide was 120 mg before each principal meal. No recommended daily dose of metformin was provided, but the most common metformin regimen used in Germany, where this study was conducted, is 850 mg bid. The mean age, BMI, and HbA1c of patients in the study were 61.1 years, 29.4 kg/m2, and 8.4%, respectively. Nearly all participants (98%) were already taking metformin when nateglinide was added. After the addition of nateglinide to metformin, mean HbA1c was reduced to 7.2% (p < 0.0001 vs baseline) and, as expected, there was a direct relationship between the baseline value and the magnitude of reduction in HbA1c over the course of treatment. At baseline, only 11.1% of the patients had HbA1c ≤7%, but by the end of the treatment period 47.7% of patients had achieved this goal. PPG was also measured following a standardized breakfast or during an OGGT. During the treatment period, mean 2-hour PPG decreased from 210 mg/dL to 152 mg/dL (p < 0.0001).
Addition of nateglinide to metformin was also associated with significant improvement in both diastolic and systolic blood pressure and resulted in a small (1.5 kg) but significant reduction in body weight. Overall, AEs were reported in 277 patients (2.9%) and severe AEs in 56 patients (0.5%). Hypoglycemic episodes were seen in 30 patients (0.3%).
In an open-label, randomized, parallel-group, multicenter study, CitationRaskin et al (2003) compared the efficacy and safety of nateglinide and repaglinide when added to metformin. Enrolled patients (N = 192) had diagnosed T2DM for at least 3 months and had HbA1c values >7% and ≤12% during previous monotherapy with sufonylurea, metformin, or low-dose glyburide/metformin. During a 4-week run-in period, all patients previously taking sulfonylurea or glyburide/metformin were switched to metformin. All patients on metformin were titrated to a maximum dose of 1000 mg bid and then randomized to receive either nateglinide (120 mg ac) or repaglinide (1 mg ac titrated to a maximum of 4 mg ac). After the 2-week titration period, the combination therapies were continued for an additional 14 weeks.
At baseline, the mean age, BMI, disease duration, HbA1c, and FPG were 55.4 years, 33.2 kg/m2, 6.9 years, 8.3%, and 190 mg/dL, respectively. The groups were well balanced with respect to age, BMI, and FPG, but the mean disease duration was somewhat longer in patients randomized to nateglinide/metformin (7.1 years) than in those randomized to repaglinide/metformin (6.7 years) and HbA1c was somewhat higher in the repaglinide/metformin group (8.4%) than in the nateglinide/metformin group (8.2%).
The mean change from baseline in HbA1c was −1.3% with repaglinide and −0.7% with nateglinide added to metformin (p < 0.001 between groups). At study endpoint, 59% of patients receiving repaglinide and 47% of those receiving nateglinide achieved HbA1c ≤ 7%. The mean decrease in FPG was also significantly greater with repaglinide/metformin than with nateglinide/metformin (−39 mg/dL vs −21 mg/dL, p = 0.002). However, the mean reductions in PPG did not differ between groups.
Hypoglycemic episodes were reported by 7% of patients receiving repaglinide/metformin and by 2% of those receiving nateglinide/metformin. However, no severe hypoglycemia occurred in either group. Otherwise, there were no noteworthy differences in the AE profiles in the 2 treatment groups. The mean change in body weight was +0.6 kg with repaglinide/metformin and −0.5 kg with nateglinide/metformin (statistical significance not reported).
It should be noted that the generalizability of the conclusions drawn by CitationRaskin et al (2003) has been questioned because of limitations of the study design (CitationBaron 2003). These include the fact that metformin was titrated to the final dose (2 g/day) over only 4 weeks, which may not be an adequate time for glycemic control to stabilize and to establish a reliable baseline. Another limitation is that more than 33% of patients receiving nateglinide/metformin had previously been treated with a sulfonylurea. Sulfonylureas are known to blunt the efficacy of nateglinide; at the time of this study, the nateglinide label stated that patients should not be switched from a sulfonylurea to nateglinide. Thus, a substantial proportion of patients in the nateglinide/metformin group was treated outside of the product labeling.
Another open-label, 12-week study included a group of patients who received nateglinide (120 mg ac, n = 214) added to a stable dose of metformin (CitationWeaver et al 2004). At baseline, mean age, BMI, duration of known diabetes, HbA1c, and FPG were ∼60 years (range = 37–84 years), 32.6 kg/m2, 5 years, 8.1%, and 10.0 mmol/L, respectively. The changes from baseline to week 12 of treatment with nateglinide added to ongoing metformin monotherapy in HbA1c, FPG, and 2-hour PPG averaged −0.7% mmol/L, −0.8 mmol/L, and −2.4 mmol/L, respectively (p < 0.0001 vs baseline for each efficacy parameter). Only 2% of patients who received nateglinide added to metformin had HbA1c <7% at baseline, while 34% achieved this goal after 12 weeks’ treatment.
In patients receiving nateglinide added to metformin, 14% experienced symptoms consistent with hypoglycemia, but no confirmatory glucose measurements were reported. None of the suspected hypoglycemic episodes required assistance from an outside party. Serious AEs were reported by 3 patients (1.4%), but only 1 of these was suspected to be related to study medication. The authors concluded that nateglinide added to metformin was safe and effective in patients up to 84 years of age.
Summary and conclusions
T2DM is difficult to control with a single oral agent and the rate of monotherapy failure is high, so combination therapy with complementary classes of drugs that act on different aspects of glycemic control would be expected to be an effective strategy. The present work reviewed all published information about the efficacy and safety/tolerability of nateglinide when combined with metformin in patients with T2DM, whether given as initial combination therapy or as an add-on to ongoing metformin monotherapy. Because metformin acts by suppressing excessive HGP and improving glucose clearance, its predominant effect is to decrease FPG. Nateglinide, which is taken before main meals, serves to restore the early phase of insulin release that is lost relatively soon after the onset of diabetes, and thus limits PPG excursions that have been implicated in the cardiovascular risk associated with T2DM.
Both metformin and nateglinide are known to have a low propensity to elicit hypoglycemia. The known side effects of metformin (ie, gastrointestinal symptoms such as diarrhea and abdominal discomfort) generally occur only early in the course of treatment and can be minimized by dose titration. Nateglinide has an excellent safety and tolerability profile and does not require dose titration. Accordingly, it is not surprising that the published literature supports a conclusion that these drugs, when combined, are safe, well tolerated, and produce a degree of long-term glycemic control that is not achievable with either agent alone. The largest decreases in HbA1c(Δ = −1.4% to −1.9%, sustained for up to 2 years) are seen in drug-naïve patients given metformin (≥1500 mg/day) and nateglinide (120 mg ac) as initial combination therapy. Lesser, but still clinically-significant decreases (Δ = −0.5% to −1.2%) are seen when nateglinide is added to ongoing stable metformin monotherapy. With either of these approaches, the decrease in HbA1c is proportional to the baseline level. The percentage of patients receiving the nateglinide/metformin combination and achieving HbA1c ≤7% has ranged from 35% to 70%. In studies of initial combination therapy, nateglinide/metformin has been found to be as effective, or more effective, than sulfonylureas (glyburide or glicazide) combined with metformin. However, in one open-label study of add-on to (recently initiated) metformin therapy, repaglinide was found to be more effective than nateglinide. In all reports, the nateglinide/metformin combination was found to be safe and well tolerated, and to have a very low hypoglycemic potential. In all studies where nateglinide/metformin was compared to metformin combined with any insulinotropic agent, hypoglycemia was less frequent and changes in body weight were smaller with the nateglinide/metformin combination.
Disclosures
Dr Israel is an employee of Novartis Pharmaceuticals Corporation (East Hanover, New Jersey) and holds company stock. Dr Baron is an employee of Sanofi-Aventis (Bridge-water, New Jersey) but was an employee of Novartis Pharmaceuticals Corporation at the time the manuscript was written and submitted for publication. Dr Istvan is an employee of Novartis AG (Basel, Switzerland) and holds company stock. Novartis AG markets nateglinide under the trade name Starlix®.
References
- BaileyCJTurnerRC1996MetforminN Engl J Med33457498569826
- BaronMA2003Comparison of repaglinide and nateglinide in combination with metformin: response to Raskin et alDiabetes Care263361214633839
- Centers for Disease Control and PreventionNational diabetes fact sheet: United States2005 [online]. Accessed September 11, 2007.URL: http://apps.nccd.cdc.gov/ddtstrs/template/ndfs_2005.pdf
- CerielloA2000The post-prandial state and cardiovascular disease: relevance to diabetes mellitusDiabetes Metab Res Rev161253210751752
- CookMNGirmanCJSteinPP2007Initial monotherapy with either metformin or sulphonylureas often fails to achieve or maintain current glycaemic goals in patients with type 2 diabetes in UK primary careDiabet Med24350817335466
- DeFronzoRA1999Pharmacologic therapy for type 2 diabetes mellitusAnn Intern Med13128130310454950
- DeFronzoRAFerranniniESimonsonDC1989Fasting hyperglycemia in non-insulin-dependent diabetes mellitus: contributions of excessive hepatic glucose production and impaired tissue glucose uptakeMetabolism38387952657323
- DeFronzoRAGoodmanAMMulticenter Metformin Study Group1995Efficacy of metformin in patients with non-insulin-dependent diabetes mellitusN Engl J Med33354197623902
- DerosaGD’AngeloAFogariE2007Effects of nateglinide and glibenclamide on prothrombotic factors in naive type 2 diabetic patients treated with metformin: a 1-year, double-blind, randomized clinical trialIntern Med4618374618025765
- FrenchJA2001The role of new antiepileptic drugsAm J Manag Care7S209S21411474769
- GerichJRaskinPJean-LouisL2005PRESERVE-β: two-year efficacy and safety of initial combination therapy with nateglinide or glyburide plus metforminDiabetes Care282093916123472
- HortonESClinkingbeardCGatlinM2000Nateglinide alone and in combination with metformin improves glycemic control by reducing mealtime glucose levels in type 2 diabetesDiabetes Care231660511092289
- HortonESFoleyJEShenSG2004Efficacy and tolerability of initial combination therapy with nateglinide and metformin in treatment-naive patients with type 2 diabetesCurr Med Res Opin20883915200747
- KahnSE2003The relative contributions of insulin resistance and beta-cell dysfunction to the pathophysiology of Type 2 diabetesDiabetologia4631912637977
- MainousAGIIIBakerRKoopmanRJ2007Impact of the population at risk of diabetes on projections of diabetes burden in the United States: an epidemic on the wayDiabetologia509344017119914
- MarreMVan GaalLUsadelK-H2002Nateglinide improves glycaemic control when added to metformin monotherapy: results of a randomized trial with type 2 diabetes patientsDiabetes Obes Metab41778612047396
- McLeodJF2004Clinical pharmacokinetics of nateglinide: a rapidly-absorbed, short-acting insulinotropic agentClin Pharmacokinet439712014748619
- NarayanKMBoyleJPThompsonTJ2007Effect of BMI on lifetime risk for diabetes in the US Diabetes Care3015626
- NataliAFerranniniE2006Effects of metformin and thiazolidinediones on suppression of hepatic glucose production and stimulation of glucose uptake in type 2 diabetes: a systematic reviewDiabetologia494344116477438
- NathanDMBuseJBDavidsonMB2006Management of hyperglycaemia in type 2 diabetes: a consensus algorithm for the initiation and adjustment of therapy. A consensus statement from the American Diabetes Association and the European Association for the Study of DiabetesDiabetologia4917112116802130
- PratleyREFoleyJEDunningBE2001Rapid acting insulinotropic agents: restoration of early insulin secretion as a physiologic approach to improve glucose controlCurr Pharm Des713759711472274
- QiaoQPyoralaKPyoralaM2002Two-hour glucose is a better risk predictor for incident coronary heart disease and cardiovascular mortality than fasting glucoseEur Heart J2312677512175663
- RaskinPKlaffLMcGillJ2003Efficacy and safety of combination therapy: repaglinide plus metformin versus nateglinide plus metforminDiabetes Care262063812832314
- RisticSCollober-MaugeaisCCressierF2007Nateglinide or gliclazide in combination with metformin for treatment of patients with type 2 diabetes mellitus inadequately controlled on maximum doses of metformin alone: 1-year trial resultsDiabetes Obes Metab95061117587393
- RisticSCollober-MaugeaisCPecherE2006Comparison of nateglinide and gliclazide in combination with metformin, for treatment of patients with type 2 diabetes mellitus inadequately controlled on maximum doses of metformin aloneDiabet Med237576216842480
- RosenstockJHassmanDRMadderRD2004Repaglinide versus nateglinide monotherapy: a randomized, multicenter studyDiabetes Care2712657015161773
- SchatzHSchoppelKLehwalderD2003Efficacy, tolerability and safety of nateglinide in combination with metformin. Results from a study under general practice conditionsExp Clin Endocrinol Diabetes111262612951631
- SchwarzSLGerichJEMarcellariA2008Nateglinide, alone or in combination with metformin, is effective and well tolerated in treatment-naive elderly patients with type 2 diabetesDiabetes Obes Metab106526017941876
- WeaverJURobertsonDAtkinSL2004Nateglinide alone or with metformin safely improves glycaemia to target in patients up to an age of 84Diabetes Obes Metab63445215287927
- WeyerCBogardusCMottDM1999The natural history of insulin secretory dysfunction and insulin resistance in the pathogenesis of type 2 diabetes mellitusJ Clin Invest1047879410491414
- WildSRoglicGGreenA2004Global prevalence of diabetes: estimates for the year 2000 and projections for 2030Diabetes Care2710475315111519