Abstract
Asian Indians have a high predisposition to metabolic syndrome (MS) and coronary artery disease (CAD). The present study aimed to estimate MS prevalence in 531 Asian Indian families comprising of 2318 individuals. Anthropometrics and lipid profile were assessed. MS prevalence was estimated using standard Adult Treatment Panel III (ATP-III) and World Health Organisation (WHO) criteria and modified definitions which included lowered cut-offs for waist circumference (WC) (≥90 cm for men and ≥80 cm for women], body mass index (BMI) (≥23 kg/m2) and impaired fasting glucose (IFG) levels. ATP-III criteria identified a significantly higher proportion of people with MS (N = 933; 40.3%) compared with WHO (N = 708; 30.6%; p < 0.0001) while modified ATP-III showed maximum gain in percent prevalence among the revised criteria (17.3%; p = 0.0056). The IDF criteria identified similar proportion of subjects with MS (N = 809; 34.9%) as the revised WHO criteria (N = 792; 34.2%). The number of MS subjects was highest in the 50–59 years age group. MS was diagnosed a decade earlier in unaffected subjects compared with those with CAD/diabetes using the modified MS criteria. WC correlated significantly with BMI and waist–hip ratio (WHR) (p = 0.000). Among MS components, high density lipoprotein cholesterol and BMI contributed significantly in males (71.4% and 85.9%) and females (86.8% and 88.8%), respectively. The higher percentage contribution of WC among males and WHR among females indicates the influence of gynecoid/android pelvis on WHR measures. In conclusion, the revision of definition criteria for MS with lowered cut-offs for WC and BMI is critical for the accurate assessment of MS among Asian Indians.
Introduction
Metabolic syndrome (MS) refers to a cluster of features namely central obesity, insulin resistance, dyslipidemia, and hypertension (CitationReaven 1988). Numerous studies have been conducted worldwide on the prevalence of MS across different ethnic groups (CitationMisra et al 2002; CitationAl-Lawati et al 2003; CitationYong-Woo 2003; CitationKuninori et al 2005), the correlation between the components of the syndrome (CitationYoung et al 2004; CitationAng et al 2005) and increased incidence of cardiovascular diseases (CVD) (CitationAnand et al 2003; CitationCoopan 2005). Asian Indians have long been considered to be a “high-risk population” for both MS and CVD, which has instigated a number of studies on Indians living in India (CitationRamachandran et al 1998; CitationMisra et al 2005) and abroad (CitationHughes et al 1997; CitationTan et al 2004; CitationShah et al 2005).
The National Cholesterol Education Program–Adult Treatment Panel III (CitationNCEP–ATP-III 2001) and World Health Organization (CitationWHO 1999) have laid down guidelines to define MS and both definitions have been widely applied to different populations under study. While Insulin resistance has been the pivotal feature in the WHO criteria, waist circumference (WC) rather than body mass index (BMI) has been the differentiating aspect of MS definition in the ATP-III panel. The International Diabetes Federation (IDF) proposed a slight modification in the ATP-III definition in 2005 (CitationAlbert et al 2005) where presence of abdominal obesity was considered mandatory for MS diagnosis. The American Heart Association/National Heart, Lung and Blood Institute (AHA/NHLBI) supports the widely used ATP-III criteria except for a lowering of threshold for impaired fasting glucose (IFG) from 110 to 100 mg/dL (CitationGrundy 2005) as recommended by IDF. In spite of the various criteria devised for MS diagnosis, most studies agree that the prevalence of MS in Asian Indians is underrepresented when ATP-III or WHO criteria are employed, considering the high propensity of this ethnic group to develop MS and its various co-morbidities (CitationMisra et al 2005). It is well known that Asian Indians have a smaller build and excess body fat with predominant abdominal adiposity as compared with Caucasians. To this effect, the WHO has recognized the need for a population-specific modification of anthropometric measures. The recommended lower BMI cut-off for defining ‘overweight’ in Asian Indians is 23 kg/m2 (CitationWHO 2004), modified WC measures is ≥94 cm and ≥80 cm (CitationMisra et al 2005) and a waist–hip ratio (WHR) of 0.89 and 0.81 for men and women, respectively (CitationSnehalatha 2003). These modified cut-offs have been applied when studying Asian Indians by several investigators (CitationMisra et al 2005; Tan et al 2005; CitationTillin et al 2005; CitationHeng et al 2006).
In this context, the aim of this study was to assess the prevalence of MS as defined by the standard ATP-III and WHO criteria and the modified criteria, and to look for differences between the various components constituting MS in subjects with and without the syndrome in a high-risk cohort of families with premature onset of coronary artery disease (CAD).
Materials and methods
Subjects
The current study has been conducted on a cohort enrolled into the Indian Atherosclerosis Research Study (IARS), by the Thrombosis Research Institute-India (TRI-India). IARS is an on-going family based genetic epidemiological study, with an aim to investigate the genetic factors associated with CAD along with their interaction with traditional and novel risk factors in a cohort of Asian Indian population in their home country. The IARS families were enrolled from two cities, Bangalore in South India and Mumbai in Western India from March 2004 – July 2005. Subjects were ascertained through a proband (males ≤60 years; females ≤65 years at onset of CAD) admitted to Narayana Hrudayalaya, a multispecialty hospital and other cardiac care hospitals in Bangalore and to the Asian Heart Institute in Mumbai for undergoing treatment for CAD and its complications. Only probands with a positive family history of CAD were enrolled into the study. A detailed pedigree of the families of each proband was drawn and affected and unaffected family members over 18 years age were subsequently enrolled into the study. None of the participants had concomitant or past major illness. In total, five hundred and thirty one families comprising of 2316 individuals, 1355 males and 961 females were enrolled, with a mean of 4.37 individuals per family.
A detailed case record form containing information on demographics, anthropometry and medical history of diabetes, hypertension and CVD was recorded for all the participants. General physical examination along with vital parameters was performed. Relevant information was obtained by personal interviews and through medical records available with the subjects and/or from the hospital records. Prevalence of diabetes (DM), hypertension (HTN), and CVD was ascertained based on self-report of physician’s diagnosis and/or use of prescription medications along with medical records of therapeutics. Additional information on diabetic status was obtained from IFG levels. All participants gave their written informed consent to participate in the study that was approved by the local Ethics Committee.
Clinical profile and anthropometrics
Height, weight, waist and hip circumference and blood pressure (BP) was measured for each participant. BMI was calculated as a ratio of weight in Kg to the height in meter2.
Laboratory assays
Venous blood was collected in evacuated tubes after an overnight fast of 12 to 14 hours (Vacuette®, Greiner Bio-One GmbH, Vienna, Austria). Serum, EDTA, and citrate plasma samples were separated by centrifugation within 2 hours of sampling and aliquots were preserved at −80 °C until analysis. Samples from Mumbai were stored at −20 °C until dispatch to TRI labs in Bangalore for analysis. Fasting venous blood sugar was assayed using a Glucometer (Bayer Diagnostics, Newbury, UK). Serum triglyceride (TG) was estimated using reagents, standards and controls from Randox Laboratories Ltd., Antrim, UK. Estimation of high density lipoprotein cholesterol (HDL-C) levels was carried out by the phosphotungstate method using precipitating agents and buffer from Bayer Diagnostics, control from Randox Labs and standards from Dade-Behring Limited, UK. All lipid assays were carried out on Cobas-Fara II Clinical Chemistry Auto analyzer (F. Hoffman La Roche Ltd., Basel, Switzerland).
Candidate metabolic syndrome definitions
Prevalence of metabolic syndrome in the cohort was assessed on the basis of the following criteria:
A) The 2001 NCEP–ATP-III guidelines, wherein presence of any three of the following traits in the same individual would meet the criteria for MS:
Abdominal obesity as defined by WC >102 cm (40 in) in men and >88 cm (35 in) in women;
Serum TG ≥150 mg/dL (1.7 mml/L);
HDL-C ≤40 mg/dl in men (1.03 mmol/L) and ≤50 mg/dl (1.29mmol/L) in women;
Blood pressure of ≥130/85 mmHg
Fasting blood glucose level of ≥110 mg/dL (6.1 mmol/L).
B) The WHO criteria emphasized insulin resistance, identified by type 2 diabetes mellitus or an impaired fasting glucose of ≥110 mg/dl, in addition to the following features:
WHR of >0.9 in men, >0.85 in women or a BMI >30 Kg/m2.
Hypertriglyceridemia with TG>150mg/dl;
HDL-C <35 mg/dl for men and <39 mg/dl for women;
High BP >140/90 mm Hg or documented evidence of anti-hypertensive therapy.
Presence of Microalbuminuria was not assessed in our cohort.
C) IDF (International Diabetic Federation 2005): Abdominal obesity as defined by WC ≥94 cm for men and ≥80 cm is a mandatory feature of this definition and is specific to Asians. In addition, any of the two features as defined in ATP-III constitute MS by this criteria. IFG cut-off level was ≥100 mg/dL.
D) Modified ATP-III-1 [MS1]: WC cutoffs ≥90 cm for men and ≥80 cm for women. Criteria from 2 to 5 were unchanged as per the NCEP ATP-III description above.
E) Modified ATP-III-2 [MS2]: BMI cutoff at >23 Kg/m2 in addition to the criteria used in MS1.
F) Modified WHO [MS3]: The definitions were same as for the WHO criteria except for WHR of ≥0.89 in males and ≥0.81 in females and a BMI >23 kg/m.2
Statistical analysis
Results are expressed as mean ± standard deviation for the continuous variables. Chi Square test with Yates correction was employed to analyze the differences in the prevalence of MS as identified using candidate definitions. Pearson’s partial correlation was carried out to investigate the inter-relationship amongst the various MS components after adjustment for gender and age. Values were log-transformed to normalize distribution. Student T-test was employed to evaluate the difference in means levels of various markers between those with and without MS. For statistical comparison of the continuous variables, ANCOVA was used with adjustment for age, gender, BMI and smoking. Generalized estimating equation (GEE) was applied to study the significant trait differences between MS and non-MS subjects using STATA version 9.0 software. Since observations within families are not independent but correlated, GEE adjusts for the effect of familial relationship and subsequently looks for significant relationship between traits in the MS and non-MS groups. Families were assumed to have binomial distribution for discrete vairables and Gaussian distribution for continuous variables under the assumption of unstructured correlation within families for any of the analysed traits. A nominal two-sided p-value <0.05 was considered significant. All statistical tests were computed on SPSS v10 software.
Results
Standard candidate definitions (ATP-III, WHO, IDF) and various adaptations therein (MS1, MS2, MS3) were applied to 2316 individuals enrolled into the IARS. Prevalence of MS based on various definitions is presented in . The number of people diagnosed with MS by the ATP-III criteria (N = 933) was significantly higher than by the WHO criteria (N = 708; p < 0.0001). Among the modified ATP-III criteria, MS2 that included revised cut offs for WC and BMI identified maximum MS subjects (N = 1333). The IDF criteria identified similar proportion of people with MS (N = 809; 34.9%) as the modified WHO criteria (MS3) (N = 792; 34.2%). Maximum gain in MS diagnosis was observed in the modified ATP-III group (MS2) (17.3%) when compared with standard ATP-III guidelines. Analyses of percentage prevalence gain of MS by the modified ATP-III criteria (MS1, MS2) and WHO criteria (MS3) revealed significant gain (N = 400) by MS2 over MS3 (p = 0.0056) criteria.
Table 1 Prevalence of metabolic syndrome (MS) according to different definition criteria
Age and sex adjusted correlations of each MS component criteria among diabetic subjects in MS1 and MS3 groups are provided in . Insulin resistance is a mandatory criterion for the designation of MS accorded by MS3. Hence, in order to analyze comparable groups, only diabetics in the MS1 category were considered for analysis. TG, HDL-C, systolic blood pressure (SBP) and diastolic blood pressure (DBP) showed significant correlation between the two groups whereas WC did not correlate with either WHR or BMI. HTN implies already diagnosed hypertensive individuals who are on medication.
Table 2 Correlation of MS traits in diabetic subjects between MS1 and MS3 groups
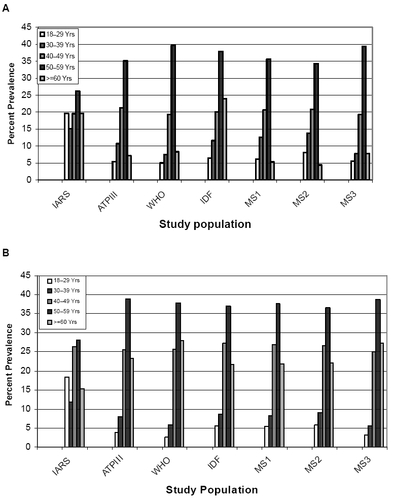
Amongst males, MS prevalence increased proportionately after 30 years of age in all the definitions to reach a maximum in the 50–59 age group (). MS prevalence reduced after 60 yrs of age that approximated to the levels prevalent in the 18–29 age group. MSI and MS2 identified higher number of younger people with MS (30–39 yrs) compared with the WHO and MS3 definitions. Amongst females, MS prevalence started to increase later than in the males (40 yrs onwards) and continued to remain high beyond 60 yrs of age, in contrast to our observation in males. Maximum prevalence was in the 50–59 age group (). Overall, the WHO and MS3 definitions diagnosed more males while the IDF criteria diagnosed more number of females with metabolic syndrome.
Figure 1 A Prevalence of MS in males across different age groups according to various MS definition criteria. B MS prevalence in females. Also included is data on IARS cohort.
MS, NIDDM, and CVD
Seven hundred and seventy six individuals (33.5%) in the IARS cohort had cardiovascular disease (CVD) by the time of their recruitment, while noninsulin-dependent diabetes mellitus (NIDDM) was present in 1048 (45.3%) subjects. 68.4% of subjects in the MS2 group were diabetic and had CVD compared with 30.3% of nondiabetics who had CVD. Only 17.2% of CVD affected people in our cohort were not diagnosed to have MS by the MS2 criteria. The mean ages of all CVD affected subjects either with or without MS2 and/or NIDDM was very similar and were as follows: 57 ± 8 years (CVD + MS2 + NIDDM), 54.7 ± 9 years (CVD + MS2 - NIDDM) and 55 ± 11 years (CVD - MS2 - NIDDM) (MS2 implies people diagnosed with MS as per MS2 definition). In comparison, MS3 also diagnosed a high proportion of people who had both CVD and MS and their mean age was 57.2 ± 8 years. The MS2, MS3 and IDF criteria were able to diagnose MS in people without CVD in their fourth decade of life (MS2 45.8 ± 12.7 years; MS3 47.6 ± 12.5 years; 45.57 ± 14.72).
Comparison of component risk factor for MS such as age, SBP, and DBP (p = 0.000), HTN, diabetes mellitus (DM), CVD (p < 0.001), glucose fasting blood sugar (GFBS), WC, and BMI (p = 0.000) were significantly higher in the MS group and continued to remain significant after age and sex adjustment when compared with the non-MS group (). Results obtained from GEE showed similarity up to the third decimal place as compared to routine tests such as Chi-square for discrete variables and T-test, ANOVA, and binary logistic regression for continuous variables between MS and non-MS subjects implying that family relationship is not a confounding factor in this study.
Table 3 Frequency and mean differences in cardiovascular risk factors between metabolic syndrome (MS)Table Footnote* and non-MS group
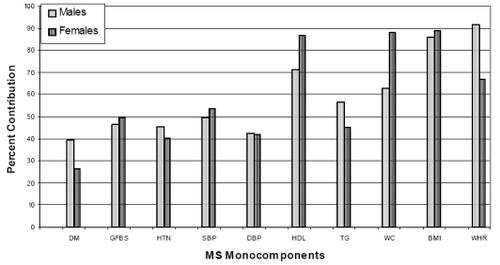
Monocomponent analysis of MS traits across gender showed that HDL-C and BMI were significant contributors in males (N = 562, 71.4%; N = 676, 85.9%) and females (N = 474, 86.81%; N = 485, 88.8%) respectively. WC was more significant among females in MS2 (N = 480; 87.91%) group while WHR (N = 468, 91.8%) showed significant contribution in males as per the MS3 definition, thus indicating the influence of the gynecoid/android pelvis on WHR measures ().
Figure 2 The percent contribution of individual components used in the definition of MS among males and females.
Discussion
Distinct clinical features and metabolic predispositions are frequently noted in people with abdominal adiposity, insulin resistance, dyslipidemia, and HTN. To simplify the recognition of such a clustering, the WHO laid down definitive criteria (CitationWHO 1999), followed by the MS definition of NCEP–ATP-III (CitationATP-III 2001) and IDF (CitationAlbert et al 2005). The Center for Disease Control and Prevention and US Department of Health and Human Services have attributed a specific code to “dysmetabolic syndrome” (ICD #277.7) (CitationCDC 2002) in the 9th revision in clinical classification, thus bestowing it with an implicative dignity.
Asian Indians are a high-risk population with respect to diabetes mellitus and CVD and the numbers are consistently on the rise (CitationEnas et al 1992; CitationEnas and Senthilkumar 2001). It has long been doubted that the above standard definitions of MS under represents its prevalence in the Asian Indian community, thereby delaying the commencement of definite preventive and therapeutic efforts in many individuals. The results of various studies have appreciated ethnic variation in clinical measures and disease outcomes in different populations (CitationAnand et al 2003; CitationTan et al 2004). Part of the problem lies in the cutoffs for obesity as defined by the WHO and ATP-III, which are not valid for Asian Indians. This population is of smaller build, has high insulin resistance and a dysmetabolic adipocyte milieu at considerably lower BMI and abdominal adiposity as identified by a large WC (CitationCooppan 2005). In the wake of ongoing debate and a lack of consensus, the WHO recognized the need for population specific cutoff definitions in order to make the diagnosis of MS more precise and modified the BMI cutoff in Asians (CitationWHO 2004). Also, the IDF (CitationAlbert et al 2005) published consensus cutoff for WC that are more ethnic-specific, based on the Chinese, Malay, and Asian Indian populations. In the present study, three candidate definitions were devised for MS by substituting the above modified cutoffs for BMI and WC, as also the WHR in the ATP-III and WHO definitions while IDF criteria was independently assessed in this study. The various definitions were applied to a cohort with high-risk for CAD where all participants had a family history of premature onset of CAD. MS prevalence was higher in our cohort in comparison to other studies. At baseline, ATP-III labeled a significantly higher proportion of people with MS when compared with the WHO criteria. A consistent gain in MS diagnosis was achieved by applying the modified definitions over the standard ones. Maximum gain was obtained in the MS2 group as defined by applying modified WC and BMI over and above the MS1 definition, which used only a modification in WC in its criteria. A comparable finding was reported using modified ATP-III criteria for anthropometry, which included skin fold thickness measurements in their candidate definition (CitationMisra et al 2005). The IDF proposes that central obesity is an essential component of MS, while the American Heart Association/National Heart, Lung and Blood Institute (AHA/NHLBI) opines that it is an optional component similar to the other MS factors. Also, the IDF supports a modified cut off in impaired fasting glucose (IFG) levels of ≥100 mg/dL as compared with ≥110 mg/DL set by other criteria. CitationLee and colleagues (2007) support the AHA/NHLBI proposal in their study on risk of ischemic heart disease (IHD) risk among healthy Asians.
Distribution of MS across various age groups showed a gradual increase in prevalence with advancing age in both males and females in our cohort with maximum prevalence in the 50–59 age group. Distribution of MS prevalence was similar across age groups in MS1, MS2, and IDF categories. CitationTan and colleagues (2004) reported a similar trend in prevalence. It is of interest to note that our study population was recruited through probands with premature CAD and the most vulnerable age group for manifestation of CAD was around the same time as the peak prevalence of MS in this study, which was around 51.75 ± 8.62 years. In this context, early detection of MS would be of immense importance to deploy prophylactic measures against component risk factors of MS. The modified ATP-III criteria [MS1 and MS2] were able to identify greater number of young people with MS [30–39 yrs] than the WHO criteria. Hence the above modifications do indicate their ability to identify the ‘high-risk subjects’ much earlier.
The NCEP definition is more flexible as it can diagnose MS even in the absence of glucose intolerance, which in itself is a predisposition to dysmetabolic dyslipidemia, an obesity phenotype and a pro-inflammatory status. The WHO criteria, on the other hand, mandate the presence of diabetes with the inclusion of microalbuminuria, which is not only a marker for renal disease, but also for CVD. By the time most patients receive a diagnosis of diabetes, they are more than likely to have developed micro- or macro-vascular disease (CitationEnas et al 1992). It can thus be expected that a greater proportion of the patients will have CVD, if MS is determined based on the WHO guidelines. This is reflected by a significant risk of development / progression of carotid atherosclerosis as noted in the prospective Bruneck study (CitationBonora et al 2003). Thus, there is a bias in prevalence in relation to this end point. In the IARS cohort, 68.4% of the CVD affected were diabetic. Employing the MS2 and MS3 criteria, those with MS but without CVD were identified by the mid-forties, while CVD appeared to be incident a decade later in our cohort. Also, MS2 was successful in identifying 82.8% of CVD cases. A similar observation was made in the 4S and the AFCAPS-TEXCAPS studies that estimated the prospective long-term relative risks of major cardiac events associated with MS after exclusion of DM (CitationGirman et al 2004).
In order to analyze the association of various phenotypes with MS, identification and selection of the best-suited definition was imperative for this study. To this end, it was hypothesized that any of the component factors that did not correlate between the candidate definitions was actually responsible for the gain that was observed in the MS diagnosis. Applying Pearson correlation to component factors of MS1 and MS3, all factors apart from the markers of adiposity, namely WC, WHR, and BMI, showed significant correlation () thus implying that only those factors that were modified were responsible for the enhanced ‘pick-up’ rate. MS2 was therefore selected for further analysis in lieu of the maximum gain achieved in diagnosing MS.
Subjects with MS were on an average ten years older than those without the syndrome. Significantly larger number of people with MS were hypertensive and diabetic with higher anthropometric parameters and incidence of CVD when compared with those without MS. BMI showed correlation with WC but not with WHR, which indicates that WC and BMI may be better predictors of MS when compared with WHR in Asian Indians. CitationKurpad and colleagues (2003) found similar correlation between WC and BMI and suggest that WC is a better marker of abdominal obesity than WHR.
The present study and previous related investigations suggest many opportunities to prevent and retard the progression of CVD in this high-risk group, such as weight loss, dietary and lifestyle modifications (CitationEnas and Senthilkumar 2001). This, in turn, would help to some extent in delaying the downstream progression into insulin resistance, hypertension and dyslipidemia. Also, control of conventional CVD risks is more effective when they are detected and arrested at an early developmental stage.
On the basis of this study and considering the prevalent socio-economic scenario in developing countries like India where limited resources are available to health providers and seekers alike, we would recommend the anthropometric evaluation of Asian Indians as a primary screening technique to identify metabolic syndrome. Only people with abnormal anthropometry could be subsequently subjected to various laboratory assays for confirmation of diagnosis of metabolic syndrome. To this effect we found that by applying lowered cutoff for BMI and WC criteria alone, about 30% of the cases in the MS2 category missed MS diagnosis underlining the importance of abnormal anthropometry in the identification of potential ‘high-risk’ MS subjects among Asian Indians.
In conclusion, prevalence of MS varies amongst ethnic groups. Asian Indians are high at risk for CVD, diabetes, and their predispositions. The criteria for defining MS in adult Asian Indians needs to be reassessed. Inclusion of modified cut-offs of WC, BMI in the ATP-III definition, and WHR in the WHO definition yielded higher rates of MS identification in our study. WC and BMI define MS better, while WC is a preferable marker of abdominal adiposity. However, these findings need further validation.
Acknowledgements
We would like to express our profound gratitude to all the participants for their cooperation and contribution towards this study. This work is a part of the ongoing Indian Atherosclerosis Research study supported by our parent institute: Thrombosis Research Institute, London. We acknowledge the infrastructure support provided by Narayana Hrudayalaya Hospital, Bangalore. We thank Ms. Dhanalakshmi B and Ms. Asimani for enrolling patients in Bangalore and Ms. Sheetal S, Mr. Shailesh K and Ms. Sunita L at Asian Heart Institute, Mumbai. We also thank Mr. Sibi K, Ms. Rekha KR for their assistance in the application of the ATP-III and WHO definitions to our study population and along with Mr. Prasad S for managing the IARS database. Acknowledgements are due to Ms. Renuka K.S and Ms. Prathima S.A. for their help with the ELISAS. An expression of gratitude is also due to Dr. Mariamma Philip, Research scholar in the Department of Biostatistics at the National Institute for Mental Health and Neuro-Sciences (NIMHANS), Bangalore for reviewing the statistical methods used in this study.
References
- AlbertKGZimmetPShawJIDF Epidemiology Task Force Consensus Group. The metabolic syndrome – a new worldwide definitionLancet200536610596216182882
- Al-LawatiJAAl-HinaiHQMohammadAJPrevalence of metabolic syndrome among Omani AdultsDiab Care200326178185
- AnandSSYiQHertzelGRelationship of metabolic syndrome and fibrinolytic dysfunction to cardiovascular diseaseCirculation2003108420512860914
- AngLWMaSCutterJThe metabolic syndrome in Chinese, Malays and Asian Indians. Factor analysis of data from the 1998 Singapore National Health SurveyDiabetes Res Clin Pract200567536215620434
- BonoraEKiechlSWilleitJCarotid atherosclerosis and coronary heart disease in the metabolic syndrome. Prospective data from the Bruneck studyDiabetes Care2003261251712663606
- [CDC] Center for Disease ControlInternational Classification of Diseases, Ninth Revision, Clinical Modification (ICD-9-CM) code (277.7) for the metabolic syndrome (also known as dysmetabolic syndrome X)2002
- CooppanRMetabolic syndrome and its evolving link to diabetesPost Grad Med2005118714
- EnasEASenthilkumarACoronary artery disease in Asian Indians: An update and reviewThe internet Journal of Cardiology20011
- EnasEAYusufSMehtaJPrevalence of coronary artery disease in Asian IndiansAm J Cardiol19927094591529952
- GirmanCJRhodesTMercuriMfor the AFCAPS/TEXCAPS Research GroupThe metabolic syndrome and risk of major coronary events in the 4S and the AFCAPS/TEXCAPS StudyAm J Cardiol2004931364114715336
- GrundySMCleemanJIDanielsSRDiagnosis and management of the Metabolic Syndrome: An American Heart Association/National Heart, Lung, and Blood Institute Scientific StatementCirculation200511227355216157765
- HengDMaSLeeJJModification of the NCEP-ATP-III definitions of the metabolic syndrome for use in Asians identifies individuals at risk of ischemic heart diseaseAthersclerosis200618636773
- HughesKAwTCKuperanPCentral obesity, insulin resistance, syndrome X, Lp(a), and cardiovascular risk in Indians, Malays, and Chinese in SingaporeJ Epidemiol Community Health199751394999328546
- Jee-youngOYeon-AhSYoungSHPrevalence and factor analysis of metabolic syndrome in an Urban Korean PopulationDiabetes Care20042720273215277435
- KuninoriSAkikoNKeikoKPrevalence of Metabolic syndrome using the modified ATP-III definitions for workers in Japan, Korea and MongoliaJ Occup Health2005471263515824477
- KurpadSSTandonHSrinivasanKWaist circumference correlates better with Body Mass Index than Waist to Hip ratio in Asian IndiansNatl Med J India2003168992
- LeeJStefanMaHengDShould central obesity be an optional or essential component of the metabolic syndrome? Ischemic heart disease risk in the Singapore Cardiovascular cohort studyDiabetes Care200730343717259505
- MisraAVikramNKInsulin Resistance Syndrome (Metabolic Syndrome) and Asian IndiansCurr Sci200283148396 Special Section: Diabetes
- MisraAWasirJSPandeyRMAn Evaluation of candidate definitions of the Metabolic syndrome in adult Asian IndiansDiabetes Care20052839840315677799
- [NCEP–ATP-III] National Cholesterol Education Program Expert Panel on Detection, Evaluation and Treatment of High Blood Cholesterol in Adults – Adult Treatment Panel IIIExpert Panel on Detection, Evaluation and Treatment of High Blood Cholesterol in Adults: Executive Summary of the Third Report of the National Cholesterol Eduction Program (NCEP) Expert Panel on Detection, Evaluation and Treatment of High Blood Cholesterol in Adults (Adult Treatment Panel III) 2001JAMA200128524869711368702
- ReavenGMRole of insulin resistance in human diseaseDiabetes19883715956073056758
- RamachandranASatyavaniKSnehalathaCClustering of Cardiovascular risk factors in urban Asian IndiansDiabetes Care199821967719614615
- ShahTJonnalagaddaSSKicklighterJRPrevalence of metabolic syndrome risk factors among young adult Asian IndiansJ Immigr Healh2005711726
- SnehalathaCVishwanathanVRamachandranACutoff values for Normal Anthropometric variables in Asian Indian AdultsDiabetes Care20032613808412716792
- TanCChewSKStefanMCan we apply the NCEP-ATP definition of the metabolic syndrome to Asians?Diabetes Care20042711828615111542
- TillinTForouhiNJohnstonDGMetabolic syndrome and coronary heart disease in South Asians, African-Carribeans, and White Europeans: a UK population based cross sectional study.i20054864956
- [WHO] World Health OrganizationDefinition, Diagnosis and Classification of Diabetes Mellitus and Its Complications. Part 1: Diagnosis and Classification of Diabetes Mellitus1999GenevaWHO
- [WHO] World Health Organization Expert ConsultationAppropriate BMI for Asian populations and its implications for policy and intervention strategiesLancet2004940315763
- Yong-wooPShanluanZLathaPThe Metabolic Syndrome. Prevalence and associated risk factor findings in the US population from the Third National Health and Nutrition Examination Survey, 1988–1994Arch Intern Med20031634273612588201