
Abstract
Duchenne muscular dystrophy (DMD) is a fatal inherited genetic disorder that results in progressive muscle weakness and ultimately loss of ambulation, respiratory failure and heart failure. Cardiac MRI (MRI) plays an increasingly important role in the diagnosis and clinical care of boys with DMD and associated cardiomyopathies. Conventional cardiac MRI biomarkers permit measurements of global cardiac function and presence of fibrosis, but changes in these measures are late manifestations. Emerging MRI biomarkers of myocardial function and structure include the estimation of rotational mechanics and regional strain using MRI tagging; T1-mapping; and T2-mapping, a marker of inflammation, edema and fat. These emerging biomarkers provide earlier insights into cardiac involvement in DMD, improving patient care and aiding the evaluation of emerging therapies.
Keywords: :
Duchenne muscular dystrophy
Duchenne muscular dystrophy (DMD) is an inherited genetic disorder that results in progressive skeletal, respiratory and cardiac muscle weakness that ultimately leads to loss of ambulation as well as respiratory and heart failure. A review of newborn screening studies [Citation1] indicates DMD affects 1:3802 to 1:6002 male births. This corresponds to 333–526 new cases of DMD in the USA each year, making it the most common fatal genetic disorder [Citation2]. Approximately two-thirds of DMD-associated mutations are inherited from unaffected carrier mothers. Since the remaining third of DMD mutations arise from de novo mutations of the germ line [Citation3], DMD mutations will likely always be with us.
DMD is caused by a variety of mutations in DMD located on the X chromosome, which lead to a lack of functional dystrophin expression in males [Citation3]. Dystrophin is a critical protein linking actin to the sarcolemma in skeletal, respiratory and cardiac muscle [Citation4]. Deficiency of functional dystrophin results in contraction induced injury of the sarcolemma, detected as leakage of muscle proteins, including creatine kinase, and subsequent development of skeletal and cardiac muscle damage [Citation5] and susceptibility to necrosis and fibrofatty replacement [Citation6,Citation7].
While all DMD is caused by mutations in DMD, the disease progression can be variable [Citation4]. While the disease may be diagnosed at an early age, the disease progression, including musculoskeletal, respiratory and cardiac involvement is patient specific, and each patient benefits from routine clinical exams. Biomarkers indicative of early cardiac involvement and of disease progression may aid the timing and type of clinical treatment and be used to evaluate the efficacy of current and emerging therapies. MRI (MRI) has become one of the clinician’s most powerful diagnostic tools. Owing to its high soft tissue contrast (unlike ultrasound) and avoidance of ionizing radiation (e.g., x-ray and computed tomography [CT]), MRI has been widely accepted for routine clinical follow-up in children. The expense of MRI exams continues to decrease and patient acceptance, even for younger children, improves as exams become simpler and shorter.
This review aims to provide a broad overview of the natural progression, diagnosis and cardiac complications in boys with DMD. This provides the background for a focused review of conventional and emerging cardiac MRI biomarkers used to evaluate heart health, including myocardial tissue remodeling and cardiac function, in boys with DMD. These cardiac MRI biomarkers are used for evaluating cardiac involvement in boys with DMD, monitoring the response to conventional therapies and as end-points in on-going clinical trials. The review concludes with discussing on-going challenges, unmet needs and future perspectives.
Natural progression
Boys with DMD exhibit progressive muscle weakness that can lead to missing developmental milestones and divergence from peer activity levels before the age of five [Citation5]. In the absence of known family history, boys with DMD are typically diagnosed at this time. Progressive weakening of skeletal muscle begins to further limit ambulation and boys with DMD are typically wheelchair dependent before their teens [Citation8]. Paradoxical calf ‘hypertrophy’ can give the appearance of robust muscle mass, but imaging and histology studies confirm that the apparent increase in mass is associated with large depositions of fibrofatty tissue [Citation9]. As the disease progresses muscle weakening continues, orthopedic problems emerge, respiratory impairment encroaches and cardiomyopathy can foment. The last is the current leading cause of death. DMD can also be associated with mild to moderate cognitive impairment [Citation10]. Therapeutic strategies continue to emerge and improve for boys with DMD, but if left untreated the mean age at death is typically between 16–19 years of age and nearly always in the 20s with modern therapy [Citation11]. The need for lifelong clinical care and the disease’s high morbidity were associated with total healthcare related costs that exceeded $750 million in the US in 2010 [Citation12].
Diagnosis
In boys with older, affected siblings diagnosis may occur very early via elevated serum creatine kinase levels [Citation13] (a marker of active muscle injury) or suggested by increased transaminases [Citation14] (a potential marker of occult muscle damage) during a routine blood panel. In boys without a family history, early ambulatory difficulties typically prompt clinical evaluation. The most definitive diagnoses comes from genetic testing [Citation5]. Muscle biopsy is another option for which immunocytochemistry and immunoblotting for dystrophin can be used, but a positive muscle biopsy still warrants genetic testing to guide treatment. Hence, genetic analysis has largely replaced muscle biopsy as the first diagnostic test performed after an elevated creatine kinase [Citation1].
Genetics
The genetic mutations associated with DMD are variable owing to the fact that the very large dystrophin gene is comprised of 79 exons encoded within 2.4 million nucleotides [Citation1,Citation4]. In general, most DMD mutations lead to complete loss of dystrophin expression and a typical DMD disease progression. However, numerous mutations in DMD can result in lower expression of partially functional dystrophin, resulting in a wide range of phenotypes in affected patients with dystrophinopathy [Citation4]. For the most part, the severity of the phenotype caused by a given mutation depends not as much on the extent of a deletion (unless indeed it is a huge deletion) as it does on whether or not it disrupts the DNA reading frame. Mutations that maintain the reading frame are associated with a slower disease course progression and a milder phenotype historically carrying the nomenclature Becker muscular dystrophy [Citation15]. Within the DMD gene there are two recognized deletion hotspots found most commonly within exons 45 to 55 or within exons from 2 to 19 [Citation15]. Deletions and duplications in the DMD gene that disrupt the reading frame result in unstable mRNA more susceptible to nonsense mediated decay or an unstable protein, and thus nearly undetectable levels of the potentially truncated protein, leading to a Duchenne phenotype.
DMD & noncardiac complications
The noncardiac complications associated with DMD are broad and include overt impacts on skeletal muscle; decline in bone health and eventual respiratory impairment or failure.
Skeletal muscle
Dystrophin is a key component of a functional linkage between intracellular actin and extracellular matrix laminin via the protein dystroglycan, thereby linking the actin-based machinery of muscle contraction with the extracellular matrix. Hence, dystrophin serves a structural role in maintaining the integrity of the sarcolemma during muscle contraction [Citation16] and effectively shields the fragile sarcolemmal membrane by directly transmitting forces from the extracellular matrix to the cytoskeleton through this connected protein complex. Without this functional complex, repetitive mechanical stress leads to sarcolemmal damage, myofiber vulnerability, eventual loss of myofibers and fibrofatty infiltration [Citation17].
DMD is a form of chronic muscle injury wherein chronic inflammation results in excessive accumulation of extracellular matrix components, which inhibit myogenic repair and lead to muscle being replaced by fibrotic scar [Citation18]. Fibrotic tissue is stiff compared with normal muscle and thereby restricts the efficiency of muscular contraction [Citation19]. Fibrotic scarring is eventually infiltrated with adipocytes (fatty degeneration), but the mechanisms are still not well understood [Citation18]. The infiltration of fibrofatty tissue in skeletal muscle is easily diagnosed using MRI [Citation20–22]. Several studies have used MRI biomarkers similar to those being used to evaluate heart health [Citation23–25].
Muscle weakness leads to reliance on Gower’s maneuver to rise from the floor and eventual loss of ambulation [Citation8]. Boys are typically wheelchair bound by age 12 [Citation8]. Decreased muscle extensibility and contractures, due to fibrotic changes [Citation26,Citation27] further limit mobility and postural accommodation. Ultimately, as muscles become substantially weaker and contractures increase, affected individuals become increasingly unable to perform acts of self-care, such as feeding or breathing without assistance [Citation8].
Bone
Boys with DMD have lower than normal bone density (osteoporosis), which lends itself to fractures (especially in the long bones of extremities) and accelerates loss of ambulatory capacity. [Citation28]. Reduction in spine bone mineral density is also common [Citation28]. Long-term steroid therapy, which otherwise slows the progression of the disease, is an additional and serious risk factor for osteoporosis. The reduction of bone mass especially in the trunk and lower limbs could be a consequence of reduced mechanical stress (i.e., limited weight-bearing and muscular activity) on bone, but derangement of calcium metabolism is also implicated [Citation28]. Untreated patients have a 90% chance of developing significant progressive scoliosis, beginning in the second decade of their lives [Citation29]. Boys with DMD can also develop vertebral compression fractures due to osteoporosis [Citation29].
Respiratory
Boys with DMD have inevitable respiratory complications as their condition deteriorates overtime due to progressive loss of muscles that are important for respiration, including those in the diaphragm. Complications include ineffective cough; nocturnal hypoventilation; sleep disordered breathing; and ultimately daytime respiratory failure by 20 years of age, if not adequately treated [Citation30]. Pneumonia is a very common cause of death in patients with DMD [Citation31]. In fact, a 2002 review identified pneumonia, compounded by cardiac involvement, as the most common cause of death [Citation8].
DMD & the heart
Just as in skeletal muscle, dystrophin is a critical cytoskeletal protein in the heart. In the absence of dystrophin, cardiomyocytes become vulnerable to membrane weakness and susceptible to increased mechanical stress. This leads to contraction-induced damage, cell death and replacement with fibrotic and fibrofatty tissue [Citation32–34]. Cardiomyocyte death also occurs as a consequence of cell membrane disruption that results in calcium overload, activation of calcium induced proteases and subsequent protein degradation [Citation17,Citation33].
The cellular and tissue-level consequences of DMD foment the dilated form of cardiomyopathy. Myocardial fibrosis in boys with DMD becomes apparent in epicardial segments, particularly in the posterobasal left ventricular (LV) free wall [Citation35,Citation36] and dilation first appears in the LV cavity [Citation19]. Whereas, in idiopathic dilated cardiomyopathy, fibrosis typically appears first in the endocardial segments [Citation37]. Stretching and thinning of the fibrotic regions of the heart exacerbates ventricular dilatation, and focal scarring also increases the risk of sudden cardiac death. Importantly, MRI can clearly depict disease in the myocardium long before the onset of clinical symptoms [Citation26,Citation27]. Progressive cardiomyopathy in boys with DMD is a major source of morbidity and mortality, especially since advances in the treatment of skeletal muscle weakness and pulmonary function have helped to mitigate their impact [Citation26,Citation27].
Cardiac MRI is an excellent clinical and research tool for evaluating heart health in boys with DMD. Several established and emerging quantitative cardiac MRI biomarkers are especially useful for characterizing progressive changes in cardiac mass, volume and global function. MRI also excels at characterizing regional changes in cardiac function, tissue-level changes in the degree of fibrosis or fibrofatty involvement, and several measures of microstructural remodeling.
Conventional MRI biomarkers of cardiac microstructure & function
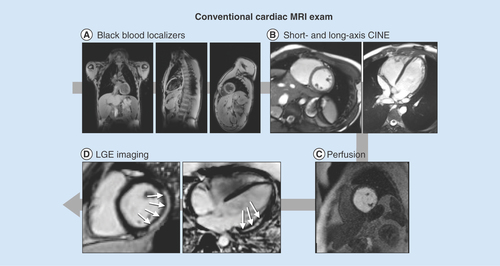
provides an overview of a conventional cardiac MRI exam for reference below.
(A) High-resolution, static, black-blood imaging to evaluate thoracic and cardiovascular anatomy. (B) Dynamic (CINE) white-blood imaging (balanced steady-state free precession) of the left ventricular short- and long-axis to assess regional and global cardiac function. (C) Contrast enhanced perfusion imaging to confirm contrast injection. (D) Post-contrast static late gadolinium enhancement for evaluating myocardial fibrosis (white arrows).
CINE: Dynamic image; LGE: Late gadolinium enhancement.
Anatomical & functional imaging
Cardiac MRI is the clinical gold standard for high quality anatomical, structural and functional imaging of the heart. A typical cardiac MRI protocol incorporates several widely available techniques to assess cardiac structure and function. Several publications on clinical best practices for imaging both adult and pediatric heart disease provide guidance [Citation38,Citation39]. Cardiac MRI exams typically incorporate high-resolution, static, black-blood imaging to evaluate thoracic and cardiovascular anatomy; dynamic (CINE) white-blood imaging (balanced steady-state free precession, bSSFP) to assess regional and global cardiac function; contrast enhanced perfusion imaging; and post-contrast static late gadolinium enhancement (LGE) for evaluating the presence or absence of myocardial fibrosis (). One notable drawback to current cardiac MRI exams is the need for repeated breath holding for periods of 5 to 20 seconds. This can prove quite difficult, especially for boys with decreased respiratory function and/or muscular contractures, or in younger less compliant patients.
Black blood anatomical imaging
A typical cardiac MRI exam begins with high resolution, static, black-blood anatomical imaging acquired along axial, sagittal and coronal imaging planes (A). These images enable detailed evaluation of both thoracic and cardiovascular anatomy and facilitate localizing subsequent double-oblique CINE bSSFP and other images for assessment of cardiac structure and function.
CINE bSSFP imaging
Cardiac MRI protocols include CINE bSSFP images, which provide time-resolved, high spatial and temporal resolution images of the beating heart for anatomical evaluation and functional analysis (B). For analysis of the right ventricle (RV) and LV, a stack of short-axis images is acquired from above the mitral valve plane at the level of the base, extending to the apex. Additionally, two long-axis views are usually prescribed: a four-chamber view passing through the apex and the center of the mitral and tricuspid valves, and a LV outflow tract (LVOT) image passing through the center of the mitral valve and the aortic valve (B). For analysis of the RV, a vertical long-axis view aligned with the tricuspid inflow and RV outflow tracts are necessary in addition to the short-axis images [Citation38,Citation39].
CINE images allow both qualitative and quantitative analysis of cardiac function. Qualitative analysis typically includes assessment of hemodynamic interaction between the chambers of the heart from the short and long-axis views; evaluation of valvular structure and function and assessment of global and regional LV and RV wall motion abnormalities and thickening.
Regional wall motion abnormalities
To characterize regional wall motion abnormalities (RWMA), each 17-segment American Heart Association (AHA) region is categorized by an expert cardiologist or radiologist as hyperkinetic, normokinetic, hypokinetic, akinetic or dyskinetic. In a study of 35 boys with DMD, Brunklaus et al. reported that 71% exhibited hypokinesia, which was either localized in the basal infero-lateral region (28%) or extensive and included the basal lateral and infero-lateral wall, inferior wall and septum (43%) [Citation40].
LV remodeling & wall thickening
LV wall thickening can be observed from the CINE images by utilizing either qualitative observation or the quantitative LV remodeling index (LVRI). LVRI is defined as the ratio between LV mass and volume, and is often used to distinguish hypertrophic and dilated cardiomyopathy. Dilated cardiomyopathy is the most common type in patients with DMD. Mazur et al. reported that while LVRI was significantly lower in a cohort of 127 DMD patients compared with normal controls, the median LVRI (0.75 vs. 0.65 g/mm3 p = 0.0150) for both groups fell within normal published limits for LVRI. Consequently this may not be an effective method to identify detrimental LV remodeling in this cohort [Citation41]. Conversely, Puchalski et al. noted the presence of decreased wall thickness in patients with myocardial fibrosis [Citation42].
Quantitative LV global function
Quantitative analysis of CINE images also yields several useful biomarkers of cardiac function. The time resolved short-axis stack of images is loaded into analysis software, and end systolic and end diastolic time frames are identified. An expert reader then segments epicardial and endocardial contours at these time points, and from these segmentations the software computes the LV end diastolic volume (LVEDV), the LV end systolic volume (LVESV), LV ejection fraction (LVEF), LV stroke volume (LVSV), LV cardiac output (LVCO) and LV mass (LVM). Body surface area indexed values of all parameters except for EF (ejection fraction) are also typically computed [Citation43]. Right ventricular indices can be similarly derived. Normative values obtained with CINE bSSFP for pediatric patients are available for these biomarkers [Citation44], and a review of those values compared with those reported for boys with DMD is shown in .
Table 1. Age and measures of left ventricular mass and function in normal healthy boys and boys with Duchenne muscular dystrophy.
LVEF measured from CINE images is probably the most widely relied upon biomarker of particular interest in a variety of cardiovascular diseases, and is an indicator of cardiac dysfunction in boys with DMD as well. A cutoff of EF<50% is often used clinically to define abnormal global cardiac function [Citation45]. Boys with DMD and significant cardiac involvement eventually present with reduced LVEF [Citation46] and an LVEF below 45% is a good predictor of fatal and nonfatal cardiac outcomes [Citation47] (Supplementary Figure 1). Haguenbach et al. report that in 51 boys with DMD, LVEF decreased by ∼2% per year over the entire cohort, but the decline was highly variable, with some patients experiencing a large reduction and others remaining stable or even exhibiting an increased LVEF. Consequently, the decline was not statistically significant [Citation48].
Tissue characterization
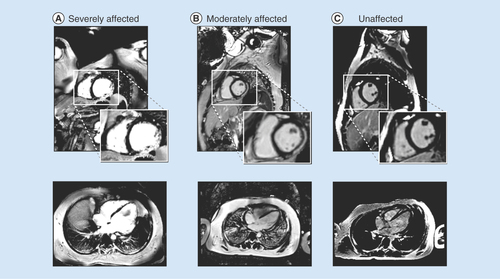
LGE is a contrast-enhanced imaging technique designed to characterize changes in myocardial extracellular matrix remodeling during disease [Citation49]. In regions of focal or dense fibrosis the contrast agent extravasates which enhances its appearance on MR images. Consequently, in an LGE image, normal myocardium appears dark, but regions with scar or fibrosis are ‘enhanced’, appearing white or grey ().
(A) A boy with Duchenne muscular dystrophy and strong cardiac involvement; (B) a moderately affected boy with moderate cardiac involvement and (C) a healthy volunteer with no signs of fibrosis.
LGE is usually performed with a gadolinium chelate contrast agent at a dose of (0.1–0.2 mmol/kg), with a delay of 10 min (permitting extravasation) between contrast injection and imaging. Scar conspicuity is enhanced on T1-weighted imaging with the application of an ‘inversion pulse’ which helps null the myocardium and a scout image is used to determine the inversion time that best nulls normal myocardium. LGE images are typically acquired at the same slice locations as the CINE images. The percent of the AHA cardiac segments involved (1–17) and the transmural extent of each segment (<50% or >50% scar) is used to classify the severity of involvement [Citation38,Citation39,Citation50].
There have been multiple reports of the presence of positive LGE in boys with DMD, typically in the later stages of the disease process. Silva et al. identified the presence of fibrosis in seven of ten patients with DMD aged 7–18 and demonstrated a negative correlation between reduced EF and presence of LGE [Citation51]. In a larger cohort of 98 DMD patients with ≥4 serial cardiac MRI examinations, Tandon et al. demonstrated that for patients wherein LGE findings were negative (fibrosis not present), EF declined 0.58 ± 0.1% per year; whereas patients with positive LGE findings (fibrosis present), experienced a decline of 2.2 ± 0.31% in EF. They also report that the number of LV segments positive for LGE increased with age, and longer steroid treatment duration was associated with a slower increase in the number of LGE positive segments [Citation46]. Puchalski et al. noted that in a cohort of 74 patients with DMD, 32% had LGE involving the posterobasal region of the LV in a subepicardial distribution. In patients with more involvement, fibrosis spread to the inferior and left lateral free wall [Citation42]. However, Hor et al. found that in a cohort of 51 boys with DMD, no patients <10 years of age were LGE-positive, and of patients >10, only 11 of 22 had positive LGE findings despite reduced EF (<55%) in all 22 patients [Citation52]. Overall, LGE has clinical value for identifying the presence of advanced cardiac involvement in DMD, but does not appear to be a useful indicator of early disease progression.
Alternative MRI methods
Several other standard biomarkers for cardiovascular function have roles that are less clear in DMD, but are mentioned for completeness. 2D-phase contrast MRI allows measuring blood velocity (cm/s) and derived measures such as flow rate (ml/s) and total flows (ml/beat). These measures can assist, for example, in the diagnosis of valvular dysfunction and aortic stenosis [Citation53]. Previous reports have demonstrated that boys with DMD may suffer from mitral valve prolapse [Citation54,Citation55], but the use of PC-MRI has been limited in this cohort.
Myocardial perfusion imaging (C) with MRI [Citation56] allows the differentiation of ischemic from non-ischemic myocardium, but has not been widely reported in boys with DMD. However, cardiac perfusion deficits in boys with DMD measured using PET imaging have been reported [Citation57,Citation58] and further investigation with MRI may be warranted. Anecdotally, a MRI-based first pass perfusion exam is sometimes used to confirm the injection of contrast and to define the time of injection prior to LGE imaging.
These conventional biomarkers of cardiac structure and function yield valuable insight into the later stages of cardiac involvement in boys with DMD. Nevertheless, it is clear that novel techniques are required to more sensitively and definitively identify the earliest impacts of this disease, especially given the variable onset of cardiac involvement.
Emerging MRI biomarkers of cardiac microstructure
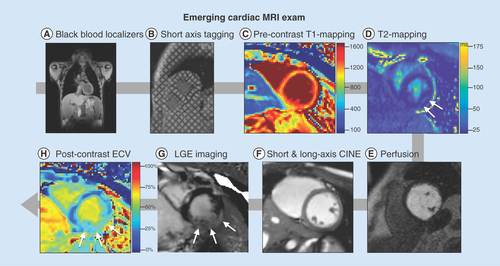
Emerging MRI biomarkers of cardiac microstructure rely on the tissue-specific contrast mechanisms of MRI, and are governed by T1- and T2- relaxation time constants, which describe the rates of longitudinal magnetization recovery and transverse magnetization decay, respectively. Normal and pathologic (e.g., fibrotic or fatty) tissue types exhibit different relaxation times and these differences can be used to diagnose disease, gauge the severity of involvement, and monitor the response to therapy. Recent cardiac MRI biomarker developments have enabled several methods for non-invasively characterizing myocardial microstructure in an effort to provide insight into early cardiac involvement for boys with DMD. provides an overview of an emerging cardiac MRI exam to assess cardiac function and microstructure for reference.
(A) High-resolution, static, black-blood imaging to evaluate thoracic and cardiovascular anatomy (B) short and long axis tagged images for the computation of cardiac strain and twist, (C & H): pre- and post-contrast T1 mapping and extracellular volume for the assessment of cardiac structural changes, (D) perfusion imaging to ensure contrast injection, (E) T2 mapping and apparent diffusion coefficient images for the assessment of cardiac structural changes, (F) dynamic (CINE) white-blood imaging (balanced steady-state free precession) of the left ventricular short and long axis to assess regional and global cardiac function and (G) post-contrast static late gadolinium enhancement for evaluating myocardial fibrosis.
CINE: Dynamic images; ECV: Extracellular volume; LGE: Late gadolinium enhancement.
T1-mapping
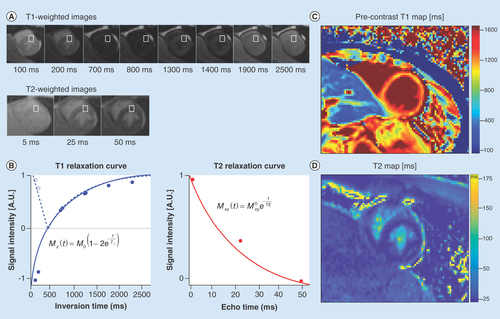
T1-weighted imaging is widely used in LGE studies, which define the presence or absence of focal fibrosis in boys with DMD. But a positive LGE finding is typically a late outcome, and is also semi-quantitative and unable to clearly depict diffuse fibrosis, if present. More recently, fast T1-mapping techniques have emerged for quantitatively measuring pixel-level T1-values from a series of T1-weighted images (). T1-mapping can be performed precontrast (so called native T1-mapping) or post-contrast [Citation59]. Taken together, pre- and post-contrast T1-mapping can be combined to estimate extracellular volume (ECV) fraction when patient-specific blood hematocrit is available [Citation60]. Native T1 maps, postcontrast T1 maps and ECV maps have gained increased attention due to their ability to capture earlier myocardial changes such as diffuse fibrosis due to increased collagen deposition due to cellular damage in cardiomyopathy compared with LGE findings that principally demonstrate overt and focal fibrosis [Citation61].
(A) A series of cardiac images are acquired at different times after an ‘inversion pulse’ that manipulates the longitudinal magnetization and the corresponding image contrast. Alternately, in (B) a series of images are acquired after different durations of ‘T2 preparation’ that manipulates the transverse magnetization and the corresponding image contrast. (B) Curve fitting is performed on a pixel-wise or region of interest basis (white boxes) and used to estimate the local tissue’s T1 and T2. The signal intensities (dots) represent the relative magnitude of the magnetization used to produce each of the images. Solid curves represent the curve fit for the equation in each plot. Additionally, the T1 plot shows the dashed curve with the first few data points not inverted about the ‘null-point’ – where signal from myocardium is suppressed (∼700 ms). After curve fitting (C) T1- and (D) T2-maps are generated on a pixel-wise basis.
Several studies have demonstrated the value of T1-mapping in boys with DMD. Soslow et al. performed a retrospective pilot study to evaluate the potential of myocardial T1 in DMD cardiomyopathy and demonstrated that postcontrast T1 was a measure of cardiac fibrosis that could also be detected in the absence of LGE [Citation62]. Therein they reported the ratio of T1 between postcontrast myocardium and the blood pool. Results from this study showed that DMD subjects (n = 21) exhibited shorter mean T1 ratio (1.42 vs. 1.72, p < 0.001) compared with healthy controls (n = 11). Furthermore, a subset analysis revealed that subjects with normal LVEF and negative LGE also demonstrated significantly shorter T1 ratio (−0.28, p < 0.001 and -0.25, p = 0.028) compared with healthy controls. Subsequently, Soslow et al. demonstrated that both myocardial native T1 and ECV increased in boys with DMD that exhibited preserved LVEF and negative LGE. Therein, DMD patients (n = 31) presented with significantly higher mean native T1 (1045 vs. 988 ms, p = 0.001) compared with the controls (n = 11) [Citation63].
Most recently, Starc et al. reported elevated myocardial ECV in patients with DMD. This study aimed to determine the ECV in a pediatric DMD population and correlated it with indices of LV function. A total of 47 patients (mean age 14 ± 2 years) were included for analysis. Results of this study showed that global myocardial ECV was significantly higher in the DMD group (29 ± 6%) compared with published normal values (24 ± 2%). Furthermore, an inverse relationship between global ECV and LVEF was identified (r = -0.46, p = 0.001) while global ECV and indexed LVEDV were significantly correlated (r = 0.41, p = 0.004) [Citation64]. These studies demonstrate the feasibility and utility of pre- and postcontrast T1-mapping and ECV measurement using MRI for detecting earlier and more subtle signs of cardiac involvement at the tissue level.
T2-mapping
T2-mapping affords a novel quantitative option to assess cardiac involvement in boys with DMD. T2-mapping can help determine the level of inflammation, edema and fat infiltration present in the affected muscle. These pathologies lengthen the T2 relaxation time, and therefore T2 mapping may help capture the level of myocardial involvement [Citation65] in boys with DMD.
Early T2-mapping studies assessed skeletal muscle in DMD patients. Garrood et al. studied ambulant boys (n = 11) with DMD and healthy controls (n = 5) to quantify the differences between normal and corticosteroid-treated DMD lower limb muscles using signal intensity measurements on T1-weighted and contrast-enhanced images and by measurement of T2 values. Results of that study demonstrated that T2 values for thigh muscle in boys with DMD were significantly higher than those observed in normal thigh muscle, suggestive of fibrofatty infiltration and edema. They concluded that T2 values were a more accurate measure of signal intensity than that from T1-weighted contrast-enhanced images. This early study was the first to show the value of T2-mapping in boys with DMD [Citation66].
Wansapura et al. were the first to look at cardiac involvement with T2-mapping in boys with DMD. They studied the LV T2 distribution in boys with DMD (n = 26) compared with healthy boys (n = 13) in effort to characterize myocardial T2 heterogeneity in relationship to severity of cardiac dysfunction. The study was stratified by age and LVEF as follows: Group-A was <12 years old (n = 12); Group-B was ≥12 years old, with EF≤55% (n = 8), and Group-C was ≥12 years old with EF>55% (n = 6). The results demonstrated that, from the T2 distribution of an LV short axis slice, the full-width half-max (FWHM, a measure of T2 heterogeneity) of the DMD subject groups rose progressively with age and decreasing EF (Group-A FWHM = 25.3 ± 3.8 ms; Group-B FWHM = 30.9 ± 5.3 ms and Group-C FWHM = 33.0 ± 6.4 ms). Importantly, this study was the first to make a link between T2 and function. It was also found that the FWHM was significantly higher in patients with reduced circumferential strain, a measure of systolic function, (Ecc ≤12%) (Group-B and Group-C) than those with Ecc >12% (Group-A). Thus, demonstrating that reduced EF and Ecc correlate well with increased T2 heterogeneity quantified by FWHM [Citation67].
Fat–water
The impact of DMD in the heart is characterized, in part, by the fibrofatty infiltration of myocardium. Therefore, understanding the fat and water composition of the myocardium in boys with DMD is helpful in determining the level of fatty infiltration. The earliest MRI studies in boys with DMD were aimed at upper- and lower-limb skeletal muscle using different chemical-shift based water-fat separation MRI techniques. ‘Chemical shift’ refers to the fact that water and fat have different resonant frequencies. Hence, carefully controlled MRI exams can separately image fat and water. While it has been observed that some of the pathological changes in DMD are shared between skeletal and cardiac muscle, the onset of disease in the myocardium relative to skeletal muscle remains underexplored.
A 2016 study by Gaur et al. investigated the muscle–fat fractions and muscle T1 and T2 relaxation times of the upper-arm skeletal muscles and the heart of ambulatory boys with DMD and age-range-matched healthy volunteer boys [Citation68]. The results showed that median muscle–fat fractions of the upper-arm were significantly higher in the biceps and triceps of boys with DMD than those of the healthy volunteers (20% vs. 9%, p < 0.001 and 13 vs. 7%, p < 0.0001, respectively). T1 values were not found to be significantly different between the two groups, but median T2 values was significantly increased in boys with DMD compared with the healthy boys (37 ms vs. 31 ms, p < 0.0001). Furthermore, T2 significantly correlated with muscle fat (%) in DMD (r = 0.6, p < 0.01). The myocardial-fat fractions were found to be similar between the two groups. However, myocardial T1 values were found to be lower in boys with DMD compared with the healthy boys, but with an overlapping range of values in both groups. As for T2, values from the anteroseptal segment were lower in DMD compared with healthy group (42 vs. 45 ms; p = 0.04).
The results from this study and previous studies [Citation69–72] show the potential for fat–water methods to yield effective MRI biomarkers for skeletal muscle degenerative changes in DMD and warrants further investigation to better understand fat–water composition in DMD affected myocardium.
Emerging MRI biomarkers of cardiac function
LGE and CINE imaging serve as the most widely available MRI tools to assess cardiac structure and function. They are clinically effective at diagnosing cardiac dysfunction and fibrosis that are present at intermediate and late stages in the disease process, but neither technique is an effective method to identify occult cardiac dysfunction prior to overt evidence of cardiac disease or the onset of patient symptoms. CINE imaging can estimate reductions in LVEF, but multiple recent studies have failed to identify a significant difference in LVEF between aged matched cohorts of boys with DMD [Citation52,Citation73] in late childhood or early adolescence, or a significant difference between LVEF over multiple time points in longitudinal studies of boys with DMD [Citation46,Citation48]. Similarly, positive LGE represents evidence of fibrosis and increased risk of LV dysfunction and arrhythmias [Citation74], but is seldom found in young DMD patients and does not serve as an effective indicator of early cardiac involvement. There is a clear need for more sensitive cardiac MRI biomarkers that provide insight into the progression of cardiac involvement in DMD, both for earlier and more effective treatment of patients and accurate evaluation of novel therapeutics.
Myocardial strain imaging In DMD
Myocardial strain imaging is a quantitative measurement of cardiac function that has shown great clinical promise in a variety of cardiac pathologies [Citation75]. In the context of cardiac MRI, strain measures the percent shortening of a region of tissue within the myocardium between two time-points in the cardiac cycle, typically between end-diastole and peak systole. Peak systolic mid-wall circumferential strain (Ecc) measures percent shortening of the myocardium within the LV short-axis plane, approximates local ‘myofiber’ shortening, and has shown particular clinical promise in the identification of early cardiac disease [Citation75]. The gold-standard technique to measure myocardial strain is MRI tagging and the most widely available post-processing method uses HARmonic Phase (HARP) based analysis [Citation76–78].
Strain imaging with MRI tagging
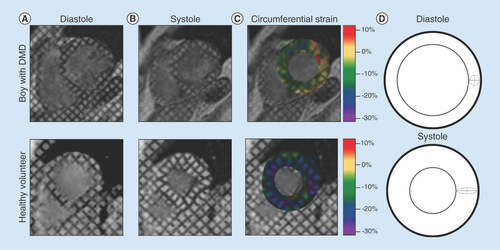
MRI tagging is a time-resolved imaging technique that quickly creates a dark grid of saturated signal (in a few milliseconds) on top of the otherwise bright myocardium at end-diastole () [Citation76–78]. The grid pattern deforms with contraction and the displacement of this grid pattern is tracked during the cardiac cycle. Utilizing specialized post-processing software it is possible to track the displacement of individual regions of tissue, and, using this information, to compute time-resolved regional and global strain measurements. By defining a polar coordinate system within the LV short-axis, it is then possible to compute Ecc [Citation79]. Estimates of radial strain (Err) are unreliable by MRI tagging given the ∼7–10 mm spacing of the grid pattern. Tags can be generated in the long-axis view too, but has not been found to be a meaningful differentiator between DMD and normal patients, and has not been well investigated with MRI [Citation48,Citation80].
By analyzing the deforming tag patterns between (A) diastole and (B) systole, it is possible to create (C) regional quantitative circumferential strain maps. Left ventricular strain describes how a (D) ‘reference’ region (gray circle) in diastole deforms via circumferential shortening (dashed line) and radial thickening (solid line) at peak systole.
DMD: Duchenne muscular dystrophy.
Ecc in DMD
Substantial evidence supports the hypothesis that Ecc derived from MRI tagging can differentiate DMD patients with occult cardiac dysfunction from healthy volunteers. Ecc can also track progressive decline in cardiac function in boys with DMD between multiple longitudinal scans more effectively than LVEF [Citation48]. Ashford et al. reported significantly reduced mid-ventricular and basal Ecc in a cohort (n = 13) of boys with DMD aged 10.6 ± 3.0 years compared with healthy volunteers aged 11.1 ± 2.53 despite normal LV volumes and LVEF [Citation73]. In a larger cohort (n = 70) of boys with DMD and healthy volunteers (n = 16), Hor et al. demonstrated that both young patients (<10 years) and age-matched patients (>10 years) with normal LVEF had significantly reduced mid-ventricular Ecc compared with healthy volunteers [Citation52]. They further stratified patients into groups above or below 10 years of age and with or without positive LGE findings. Patients >10 years old with reduced (<55%) LVEF, but negative LGE had significantly reduced Ecc compared with those >10 years old without reduced LVEF. Patients >10 years old with reduced LVEF and positive LGE exhibited the greatest decline. In a different longitudinal study of 51 boys with DMD, Hagenbuch et al. demonstrated that between two scans with a mean interval of 15.6 ± 6.0 months, there was a significant reduction in Ecc between the first and second examination, but no significant reduction in LVEF between the two scans. All patients exhibited a reduction in Ecc with a mean decrease of 13% whereas changes in EF were highly variable. This effect was also seen in the youngest patients (<10 years old) with normal EF, as there was a significant reduction between their scans [Citation48]. These results have been echoed in several other recent studies, and taken together, suggest that mid-ventricular Ecc is a sensitive cardiac MRI biomarker of occult cardiac dysfunction before the appearance of reduced LVEF or positive LGE [Citation81–83]. provides age and measures of LV regional function in normal healthy boys and boys with DMD.
Table 2. Age and measures of left ventricular regional function in normal healthy boys and boys with Duchenne muscular dystrophy.
Alternative MR-based methods for Ecc
While MR tagging is the gold standard for measuring Ecc in DMD and other pathologies, alternative imaging techniques such as Displacement Encoding with Stimulated Echoes (DENSE) [Citation84,Citation85], feature tracking, Strain Enoded (SENC) MRI and Tissue Phase Mapping (TPM) also exist, but are less studied in DMD. Displacement Encoding with Stimulated Echoes (DENSE) has shown particular sensitivity to changes in circumferential strain (Ecc) in, for example, acute MI and hypertrophic cardiomyopathy [Citation86]. While there are no reports of the use of DENSE in a DMD cohort, DENSE has been well validated [Citation87], and there are several potential advantages to utilizing this technique for MRI tagging. MRI tagging is limited by the resolution of the tag lines, but DENSE directly encodes displacement into each pixel, allowing for higher resolution maps of Ecc. DENSE can be acquired while the patient breathes freely, whereas DMD patients may struggle to hold their breath during the more traditional MRI tagging sequence. Further, DENSE postprocessing is more straightforward than HARP-based approaches, requiring only a single segmented time frame at end-diastole.
Feature tracking is another potential method of assessing Ecc in a DMD cohort. Feature tracking involves the use of post-processing tools to identify and follow features in standard short-axis CINE images, and to use the displacement and deformation of those features to compute Ecc. This method has the benefit of not requiring dedicated additional imaging beyond the conventional CINE acquisition to compute Ecc. Hor et al. compare MRI tagging to feature tracking in a large cohort of DMD patients and demonstrate a high correlation between the global Ecc computed with both methods, and no significant differences in strain results [Citation88,Citation89]. Other studies in non-DMD patients, however, show modest agreement and reproducibility between feature tracking and tagging for strain measurements for Ecc, and poor agreement for other strain components [Citation90]. To date, the role of feature tracking remains uncertain.
SENC imaging, which allows the rapid encoding of strain directly into an MR image [Citation91], and TPM, which encodes velocity into each image, thereby enabling the calculation of strain-rate [Citation92], may also have utility, but remain unstudied in DMD.
Cardiac rotational mechanics in DMD
Another emerging biomarker of cardiac dysfunction includes various measures of cardiac rotational mechanics (i.e., LV twist, torsion and CL-shear; ). LV twist measures the relative angle of rotation between the base and the apex of the LV myocardium between end-diastole and peak-systole. Torsion is a measurement of LV twist normalized by the distance between slices and is expressed in units of degrees/mm [Citation93]. Both are readily assessed with MRI tagging. Reyhan et al. reported a significant decrease in peak LV twist in DMD patients compared with healthy volunteers [Citation94]. However, other reports have found no significant difference in peak LV torsion between DMD patients and volunteers despite reduced EF [Citation73]. This may be partially explained by inconsistent basal and apical slice locations in DMD patients [Citation95]. While MR tagging is the only reported technique that has been used to measure LV twist and torsion in boys with DMD, DENSE and feature tracking can also be used and their inclusion in future studies is warranted.
(A) MRI tagging at the base and apex can be used to estimate left ventricular rotational mechanics, including (B) left ventricular twist, torsion and CL shear (θCL).
LV: Left ventricular; CL: Circumferential–longitudinal.
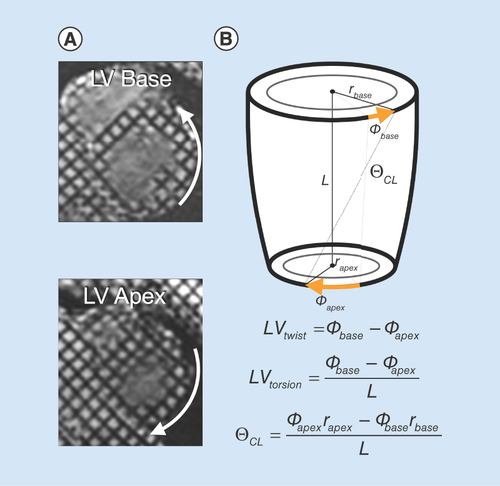
An additional metric of cardiac rotational mechanics that is understudied in DMD is circumferential-longitudinal shear angle (CL-shear or torsional shear angle) [Citation93]. CL-shear measures the change in angle between line segments which are initially aligned with the anatomical circumferential and longitudinal axes of the LV. Since it is independent of size (normalized by both LV radius and length) and can be calculated at any point in the LV short-axis, it may be a more robust measure of changes in rotational mechanics in DMD, and has previously been studied in hypertrophic cardiomyopathy, mitral regurgitation and DMD [Citation94,Citation96].
On-going challenges & unmet needs
Cardiac MRI biomarker exams that characterize cardiac structure, function and remodeling in boys with DMD are poised to better inform their clinical management and provide insight to the efficacy of new and emerging therapies. Current challenges for cardiac MRI exams include: total exam duration, the need for repeated breath holding and lack of wide-spread availability of validated cardiac MRI biomarker sequences and analysis tools.
Faster MRI methods remain a central area of research and acceleration methods continue to evolve. The advent of ‘parallel’ imaging in MRI had a significant impact on cardiac MRI and ‘compressed sensing’ is now poised to have a similar impact. The final result will assuredly be a thorough and quick cardiac MRI exam (less than 20–30 min) obtained entirely during free-breathing, to include several well-vetted cardiac MRI biomarkers. This goal is achievable in the next 3–5 years.
Several methods already exist to better enable free-breathing MRI exams for CINE MRI, fat–water MRI, LGE MRI and MRI tagging [Citation23,Citation24,Citation97–99]. These sequences significantly ease the exam burden boys with DMD and improve patience acceptance. As MRI exams become shorter and patients can more easily comply, image quality improves and physicians are better able to diagnose and treat their patients.
An important shift in current cardiac MRI approaches will be the widespread adoption of quantitative cardiac MRI biomarkers that provide accurate and early insight to incipient disease. Emerging methods for quantifying T1 [Citation100] (pre- or post-contrast), T2 [Citation101], and even the apparent diffusion coefficient [Citation101,Citation102] of myocardium during free-breathing continue to rapidly evolve. MRI tagging will also likely give way to DENSE-like approaches that provide higher quality strain data during free-breathing acquisitions. Additional work is needed to define the accuracy, precision, reproducibility and progressive changes in these biomarkers both in healthy boys and boys with DMD.
Image analysis of quantitative MRI data can be time consuming, requiring extensive segmentation and post-processing of images. As the need for quantitative biomarkers increases, the analysis methods will also improve aided, in part, by notable advances in machine learning. The cardiac MRI biomarker exam of the future for boys with DMD may also forego the use of any MRI contrast agent, thereby mitigating one concern of patients and further improving patient acceptance.
Conclusion
Cardiac MRI plays an increasingly important role in the diagnosis and clinical care of boys with DMD, owing to its ability to characterize progressive changes in cardiac mass, volume and global function. Cardiac MRI also excels at characterizing regional changes in cardiac function, tissue-level changes in the degree of fibrofatty involvement and several measures of microstructural remodeling. Conventional cardiac MRI biomarkers include accurate measurement of ventricular volumes, masses, ejection fraction and the presence or absence of myocardial fibrosis and scarring, but changes based on these measures are late outcomes. Emerging cardiac MRI biomarkers of myocardial microstructural remodeling include pre- and postcontrast T1-mapping, which enables estimating extracellular volume fraction; and T2-mapping a marker of inflammation, edema and fat. Emerging cardiac MRI biomarkers of myocardial function include the ability to estimate global rotational mechanics and regional strain using MRI tagging and image post-processing and changes in these metrics precede conventional cardiac MRI biomarkers. These emerging functional and microstructural cardiac MRI biomarkers may provide earlier insight to cardiac involvement in boys with DMD that enables improved cardiac care and evaluation of the efficacy of new and emerging therapies.
Future perspective
In the future, biomarkers from alternative imaging techniques paired with cardiac MRI information may further aid in the early diagnosis of cardiac disease and follow treatment response in boys with DMD. In a limited number of previous studies, positron emission tomography (PET) imaging has been used to identify regions of fibrotic tissue and clarify the metabolic processes potentially leading to fibrofatty infiltration [Citation103]. However, LGE MRI can identify these regions at higher resolution without exposure to ionizing radiation. MR spectroscopy has been used to study fat metabolism within fibrofatty infiltrations within the lateral wall of the heart, and may be a helpful biomarker, but has been understudied.
Within several years a comprehensive cardiac MRI biomarker exam will be available for clinical use to better evaluate heart health in boys with DMD. This exam will characterize several biomarkers of myocardial function (strain and rotational mechanics) that provide better sensitivity than currently available conventional measures, such as ejection fraction. This same exam will provide physicians with direct insight to cardiac microstructural remodeling and reveal the earliest signs of diffuse fibrosis, myocardial injury or fibrofatty infiltration. As emerging therapies become available for the management of boys with DMD, comprehensive cardiac MRI biomarker exams will be available to evaluate the on-target and off-target effects of these therapies.
Duchenne muscular dystrophy
Duchenne muscular dystrophy (DMD) is a fatal inherited genetic disorder that results in progressive skeletal, respiratory and cardiac muscle weakness that ultimately leads to loss of ambulation, respiratory failure and heart failure.
Conventional MRI biomarkers of cardiac microstructure & function
Cardiac MRI (MRI) plays an increasingly important role in the diagnosis and clinical care of boys with DMD, owing to its ability to characterize progressive changes in cardiac mass, volume and global function.
Cardiac MRI also excels at characterizing regional changes in cardiac function, tissue-level changes in the degree of fibrofatty involvement and several measures of microstructural remodeling.
Conventional cardiac MRI biomarkers include accurate measurement of ventricular volumes, masses, ejection fraction and the presence or absence of myocardial fibrosis and scarring, but changes based on these measures are late outcomes.
Emerging MRI biomarkers of cardiac microstructure
Emerging cardiac MRI biomarkers of myocardial microstructural remodeling include pre- and postcontrast T1-mapping, which enables estimating extracellular volume fraction; and T2-mapping a marker of inflammation, edema and fat.
Emerging MRI biomarkers of cardiac function
Emerging cardiac MRI biomarkers of myocardial function include the ability to estimate global rotational mechanics and regional strain using MRI tagging and image post-processing and changes in these metrics precede conventional cardiac MRI biomarkers.
Future perspective
These emerging functional and microstructural cardiac MRI biomarkers may provide earlier insight to cardiac involvement in boys with DMD that enables improved cardiac care and evaluation of the efficacy of new and emerging therapies.
Supplementary Figure 1
Download PNG Image (2.7 MB)
Supplementary Figure 2
Download PNG Image (2.7 MB)
Supplementary data
To view the supplementary data that accompany this paper please visit the journal website at: www.tandfonline.com/doi/full/10.2217/bmm-2018-0125
Financial & competing interests disclosure
This work is supported, in part, by NIH/NHLBI R01 HL131975. The authors have no other relevant affiliations or financial involvement with any organization or entity with a financial interest in or financial conflict with the subject matter or materials discussed in the manuscript apart from those disclosed.
No writing assistance was utilized in the production of this manuscript.
Additional information
Funding
References
- Wein N , AlfanoL, FlaniganKM. Genetics and emerging treatments for Duchenne and Becker muscular dystrophy. Pediatr. Clin. North Am.62 ( 3 ), 723 – 742 (2015).
- McNally EM , KaltmanJR, BensonDWet al. Contemporary cardiac issues in duchenne muscular dystrophy. Circulation131 ( 18 ), 1590 – 1598 (2015).
- Grimm T , KressW, MengG, MullerCR. Risk assessment and genetic counseling in families with Duchenne muscular dystrophy. Acta Myol.31 ( 3 ), 179 – 183 (2012).
- Muntoni F , TorelliS, FerliniA. Dystrophin and mutations: one gene, several proteins, multiple phenotypes. Lancet Neurol.2 ( 12 ), 731 – 740 (2003).
- Bushby K , FinkelR, BirnkrantDJet al. Diagnosis and management of Duchenne muscular dystrophy, part 1: diagnosis, and pharmacological and psychosocial management. Lancet Neurol.9 ( 1 ), 77 – 93 (2010).
- Campbell KP . Three muscular dystrophies: loss of cytoskeleton–extracellular matrix linkage. Cell80 ( 5 ), 675 – 679 (1995).
- Worton R . Muscular dystrophies: diseases of the dystrophin–glycoprotein complex. Science270 ( 5237 ), 755 (1995).
- Emery AE . The muscular dystrophies. Lancet359 ( 9307 ), 687 – 695 (2002).
- Cros D , HarndenP, PellissierJF, SerratriceG. Muscle hypertrophy in Duchenne muscular dystrophy. A pathological and morphometric study. J. Neurol.236 ( 1 ), 43 – 47 (1989).
- Poysky J . Behavior patterns in Duchenne muscular dystrophy: report on the Parent Project Muscular Dystrophy behavior workshop 8–9 of December 2006, Philadelphia, USA. Neuromusc. Disord.17 ( 11 ), 986 – 994 (2007).
- Kieny P , CholletS, DelalandePet al. Evolution of life expectancy of patients with Duchenne muscular dystrophy at AFM Yolaine de Kepper centre between 1981 and 2011. Ann. Phys. Rehabil. Med.56 ( 6 ), 443 – 454 (2013).
- Larkindale J , YangW, HoganPFet al. Cost of illness for neuromuscular diseases in the United States. Muscle Nerve49 ( 3 ), 431 – 438 (2014).
- Percy ME , ChangLS, MurphyEG, OssI, Verellen-DumoulinC, ThompsonMW. Serum creatine kinase and pyruvate kinase in Duchenne muscular dystrophy carrier detection. Muscle Nerve2 ( 5 ), 329 – 339 (1979).
- McMillan HJ , GregasM, DarrasBT, KangPB. Serum transaminase levels in boys with Duchenne and Becker muscular dystrophy. Pediatrics127 ( 1 ), e132 – e136 (2011).
- Muntoni F , TorelliS, FerliniA. Dystrophin and mutations: one gene, several proteins, multiple phenotypes. Lancet Neurol.2 ( 12 ), 731 – 740 (2003).
- Rybakova IN , ErvastiJM. Dystrophin–glycoprotein complex is monomeric and stabilizes actin filaments in vitro through a lateral association. J. Biol. Chem.272 ( 45 ), 28771 – 28778 (1997).
- Lammerding J , LeeRT. Torn apart: membrane rupture in muscular dystrophies and associated cardiomyopathies. J. Clin. Investig.117 ( 7 ), 1749 (2007).
- Mann CJ , PerdigueroE, KharrazYet al. Aberrant repair and fibrosis development in skeletal muscle. Skelet. Muscle1 ( 1 ), 21 (2011).
- Kaspar RW , AllenHD, MontanaroF. Current understanding and management of dilated cardiomyopathy in Duchenne and Becker muscular dystrophy. J. Am. Acad. Nurse Pract.21 ( 5 ), 241 – 249 (2009).
- Kornegay JN , BoganJR, BoganDJet al. Canine models of Duchenne muscular dystrophy and their use in therapeutic strategies. Mamm. Genome23 ( 1–2 ), 85 – 108 (2012).
- Polavarapu K , ManjunathM, Preethish-KumarVet al. Muscle MRI in Duchenne muscular dystrophy: evidence of a distinctive pattern. Neuromuscul. Disord.26 ( 11 ), 768 – 774 (2016).
- Wren TA , BlumlS, Tseng-OngL, GilsanzV. Three-point technique of fat quantification of muscle tissue as a marker of disease progression in Duchenne muscular dystrophy: preliminary study. AJR Am. J. Roentgenol.190 ( 1 ), W8 – W12 (2008).
- Kellman P , HernandoD, ShahSet al. Myocardial fibro-fatty infiltration in Duchenne muscular dystrophy canine model detected using multi-echo Dixon method of water and fat separation imaging. Proc. Intl. Soc. Mag. Reson Med.17, 3762 (2009).
- Kellman P , HernandoD, AraiAE. Myocardial fat imaging. Curr. Cardiovasc. Imaging Rep.3 ( 2 ), 83 – 91 (2010).
- Statile CJ , TaylorMD, MazurWet al. Left ventricular noncompaction in Duchenne muscular dystrophy. J. Cardiovasc. Magn. Reson.15 ( 1 ), 67 (2013).
- Bushby K , FinkelR, BirnkrantDJet al. Diagnosis and management of Duchenne muscular dystrophy, part 2: implementation of multidisciplinary care. Lancet Neurol.9 ( 2 ), 177 – 189 (2010).
- Bushby K , FinkelR, BirnkrantDJet al. Diagnosis and management of Duchenne muscular dystrophy, part 1: diagnosis, and pharmacological and psychosocial management. Lancet Neurol.9 ( 1 ), 77 – 93 (2010).
- Bianchi M , MazzantiA, GalbiatiEet al. Bone mineral density and bone metabolism in Duchenne muscular dystrophy. Osteoporos Int.14 ( 9 ), 761 – 767 (2003).
- Behera V , BeheraMK, ChauhanR, NairV. Duchenne muscular dystrophy. BMJ Case Rep.10, pii: bcr2014205296 (2014).
- Hoffman EP . Clinical and histopathological features of abnormalities of the dystrophin-based membrane cytoskeleton. Brain Pathol.6 ( 1 ), 49 – 61 (1996).
- Gilroy J , CahalanJL, BermanR, NewmanM. Cardiac and pulmonary complications in Duchenne’s progressive muscular dystrophy. Circulation27 ( 4 ), 484 – 493 (1963).
- Kamogawa Y , BiroS, MaedaMet al. Dystrophin-deficient myocardium is vulnerable to pressure overload in vivo. Cardiovasc. Res.50 ( 3 ), 509 – 515 (2001).
- Yasuda S , TownsendD, MicheleDE, FavreEG, DaySM, MetzgerJM. Dystrophic heart failure blocked by membrane sealant poloxamer. Nature436 ( 7053 ), 1025 (2005).
- Yilmaz A , SechtemU. Cardiac involvement in muscular dystrophy: advances in diagnosis and therapy. Heart98 ( 5 ), 420 (2012).
- Frankel KA , RosserRJ. The pathology of the heart in progressive muscular dystrophy: epimyocardial fibrosis. Hum. Pathol.7 ( 4 ), 375 – 386.
- Pearson CM . Muscular dystrophy. Am. J. Med.35 ( 5 ), 632 – 645.
- Roberts WC , SiegelRJ, McManusBM. Idiopathic dilated cardiomyopathy: analysis of 152 necropsy patients. Am. J. Cardiol.60 ( 16 ), 1340 – 1355.
- Kramer CM , BarkhausenJ, FlammSD, KimRJ, NagelE. Standardized cardiovascular MRI (CMR) protocols, society for cardiovascular magnetic resonance: board of trustees task force on standardized protocols. J. Cardiovasc. Magn. Reson.10 ( 1 ), 35 (2008).
- Kramer CM , BarkhausenJ, FlammSD, KimRJ, NagelE. Standardized cardiovascular magnetic resonance (CMR) protocols 2013 update. J. Cardiovasc. Magn. Reson.15 ( 1 ), 91 (2013).
- Brunklaus A , ParishE, MuntoniFet al. The value of cardiac MRI versus echocardiography in the pre-operative assessment of patients with Duchenne muscular dystrophy. Eur. J. Paediatr. Neurol.19 ( 4 ), 395 – 401 (2015).
- Mazur W , HorKN, GermannJTet al. Patterns of left ventricular remodeling in patients with Duchenne muscular dystrophy: a cardiac MRI study of ventricular geometry, global function, and strain. Int. J. Cardiovasc. Imaging28 ( 1 ), 99 – 107 (2012).
- Puchalski MD , WilliamsRV, AskovichBet al. Late gadolinium enhancement: precursor to cardiomyopathy in Duchenne muscular dystrophy? Int. J. Cardiovasc. Imaging 25 ( 1 ), 57 – 63 (2009).
- Schulz-Menger J , BluemkeDA, BremerichJet al. Standardized image interpretation and post processing in cardiovascular magnetic resonance: Society for Cardiovascular Magnetic Resonance (SCMR) Board of Trustees Task Force on Standardized Post Processing. J. Cardiovasc. Magn. Reson.15 ( 1 ), 35 (2013).
- Lorenz C . The range of normal values of cardiovascular structures in infants, children, and adolescents measured by MRI. Pediatr. Cardiol.21 ( 1 ), 37 – 46 (2000).
- Vasan RS , LevyD. Defining diastolic heart failure. Circulation101 ( 17 ), 2118 – 2121 (2000).
- Tandon A , VillaCR, HorKNet al. Myocardial fibrosis burden predicts left ventricular ejection fraction and is associated with age and steroid treatment duration in Duchenne muscular dystrophy. J. Am. Heart Assoc.4 ( 4 ), e001338 (2015).
- Solomon SD , AnavekarN, SkaliHet al. Influence of ejection fraction on cardiovascular outcomes in a broad spectrum of heart failure patients. Circulation112 ( 24 ), 3738 – 3744 (2005).
- Hagenbuch SC , GottliebsonWM, WansapuraJet al. Detection of progressive cardiac dysfunction by serial evaluation of circumferential strain in patients with Duchenne muscular dystrophy. Am. J. Cardiol.105 ( 10 ), 1451 – 1455 (2010).
- McCrohon J , MoonJ, PrasadSet al. Differentiation of heart failure related to dilated cardiomyopathy and coronary artery disease using gadolinium-enhanced cardiovascular magnetic resonance. Circulation108 ( 1 ), 54 – 59 (2003).
- Schulz-Menger J , von Knobelsdorff-BrenkenhoffF, BluemkeDA, BremerichJ, FlammSD, FogelMA. Standardized post processing in cardiovascular magnetic resonance. J. Cardiovasc. Magn. Reson.15 ( 1 ), 35 (2013).
- Silva MC , MeiraZMA, GiannettiJGet al. Myocardial delayed enhancement by MRI in patients with muscular dystrophy. J. Am. Coll. Cardiol.49 ( 18 ), 1874 – 1879 (2007).
- Hor KN , WansapuraJ, MarkhamLWet al. Circumferential strain analysis identifies strata of cardiomyopathy in Duchenne muscular dystrophy. J. Am. Coll. Cardiol.53 ( 14 ), 1204 – 1210 (2009).
- Stalder AF , RusseM, FrydrychowiczA, BockJ, HennigJ, MarklM. Quantitative 2D and 3D phase contrast MRI: optimized analysis of blood flow and vessel wall parameters. Magn. Reson. Med.60 ( 5 ), 1218 – 1231 (2008).
- Sanyal SK , JohnsonWW, DischeM, PitnerSE, BeardC. Dystrophic degeneration of papillary muscle and ventricular myocardium. A basis for mitral valve prolapse in Duchenne muscular dystrophy. Circulation62 ( 2 ), 430 – 438 (1980).
- Sanyal SK , LeungRK, TierneyRC, GilmartinR, PitnerS. Mitral valve prolapse syndrome in children with Duchenne’s progressive muscular dystrophy. Pediatrics63 ( 1 ), 116 – 123 (1979).
- Atkinson D , BursteinD, EdelmanR. First-pass cardiac perfusion: evaluation with ultrafast MR imaging. Radiology174 ( 3 ), 757 – 762 (1990).
- Quinlivan R , LewisP, MarsdenPet al. Cardiac function, metabolism and perfusion in Duchenne and Becker muscular dystrophy. Neuromuscul. Disord.6 ( 4 ), 237 – 246 (1996).
- Kawai N , SotobataI, OkadaMet al. Evaluation of myocardial involvement in Duchenne’s progressive muscular dystrophy with thallium-201 myocardial perfusion imaging. Jpn Heart J.26 ( 5 ), 767 – 775 (1985).
- Messroghli DR , RadjenovicA, KozerkeS, HigginsDM, SivananthanMU, RidgwayJP. Modified look–locker inversion recovery (MOLLI) for high-resolution T1 mapping of the heart. Magn. Reson. Med.52 ( 1 ), 141 – 146 (2004).
- Jerosch-Herold M , SheridanDC, KushnerJDet al. Cardiac MRI of myocardial contrast uptake and blood flow in patients affected with idiopathic or familial dilated cardiomyopathy. Am. J. Physiol. Heart Circ. Physiol.295 ( 3 ), H1234 – H1242 (2008).
- Haaf P , GargP, MessroghliDR, BroadbentDA, GreenwoodJP, PleinS. Cardiac T1 mapping and extracellular volume (ECV) in clinical practice: a comprehensive review. J. Cardiovasc. Magn. Reson.18 ( 1 ), 89 (2016).
- Soslow JH , DamonBM, SavilleBRet al. Evaluation of post-contrast myocardial T1 in Duchenne muscular dystrophy using cardiac MRI. Pediatr. Cardiol.36 ( 1 ), 49 – 56 (2015).
- Soslow JH , DamonSM, CrumKet al. Increased myocardial native T1 and extracellular volume in patients with Duchenne muscular dystrophy. J. Cardiovasc. Magn. Reson.18, 5 (2016).
- Starc JJ , MooreRA, RattanMSet al. Elevated myocardial extracellular volume fraction in Duchenne muscular dystrophy. Pediatr. Cardiol.38 ( 7 ), 1485 – 1492 (2017).
- Boxt LM , HsuD, KatzJet al. Estimation of myocardial water content using transverse relaxation time from dual spin-echo MRI. Magn. Reson. Imaging11 ( 3 ), 375 – 383 (1993).
- Garrood P , HollingsworthKG, EagleMet al. MR imaging in Duchenne muscular dystrophy: quantification of T1-weighted signal, contrast uptake, and the effects of exercise. J. Magn. Reson. Imaging30 ( 5 ), 1130 – 1138 (2009).
- Wansapura JP , HorKN, MazurWet al. Left ventricular T2 distribution in Duchenne muscular dystrophy. J. Cardiovasc. Magn. Reson.12 ( 1 ), 14 (2010).
- Gaur L , HannaA, BandettiniWP, FischbeckKH, AraiAE, MankodiA. Upper arm and cardiac MRI in Duchenne muscular dystrophy. Ann. Clin. Transl. Neurol.3 ( 12 ), 948 – 955 (2016).
- Wokke BH , BosC, ReijnierseMet al. Comparison of Dixon and T1-weighted MR methods to assess the degree of fat infiltration in Duchenne muscular dystrophy patients. J. Magn. Reson. Imaging38 ( 3 ), 619 – 624 (2013).
- Kim HK , SeraiS, LindquistDet al. Quantitative skeletal muscle MRI: Part 2, MR spectroscopy and T2 relaxation time mapping-comparison between boys with Duchenne muscular dystrophy and healthy boys. AJR Am. J. Roentgenol.205 ( 2 ), W216 – W223 (2015).
- Ricotti V , EvansMR, SinclairCDet al. Upper limb evaluation in duchenne muscular dystrophy: fat–water quantification by MRI, muscle force and function define endpoints for clinical trials. PLoS ONE11 ( 9 ), e0162542 (2016).
- Wokke BH , Van Den BergenJC, HooijmansMT, VerschuurenJJ, NiksEH, KanHE. T2 relaxation times are increased in skeletal muscle of DMD but not BMD patients. Muscle Nerve53 ( 1 ), 38 – 43 (2016).
- Ashford M , LiuW, LinSet al. Occult cardiac contractile dysfunction in dystrophin-deficient children revealed by cardiac magnetic resonance strain imaging. Circulation112 ( 16 ), 2462 – 2467 (2005).
- Finsterer J , StöllbergerC. The heart in human dystrophinopathies. Cardiology99 ( 1 ), 1 – 19 (2003).
- Götte MJ , GermansT, RüsselIKet al. Myocardial strain and torsion quantified by cardiovascular magnetic resonance tissue tagging. J. Am. Coll. Cardiol.48 ( 10 ), 2002 – 2011 (2006).
- Osman NF , KerwinWS, McVeighER, PrinceJL. Cardiac motion tracking using CINE harmonic phase (HARP) MRI. Magn. Reson. Med.42 ( 6 ), 1048 (1999).
- Osman NF , PrinceJL. Regenerating MR tagged images using harmonic phase (HARP) methods. IEEE Transact. Biomedi. Eng.51 ( 8 ), 1428 – 1433 (2004).
- Castillo E , OsmanNF, RosenBDet al. Quantitative assessment of regional myocardial function with MR-tagging in a multi-center study: interobserver and intraobserver agreement of fast strain analysis with harmonic phase (HARP) MRI. J. Cardiovasc. Magn. Reson.7 ( 5 ), 783 – 791 (2005).
- Young AA , KramerCM, FerrariVA, AxelL, ReichekN. Three-dimensional left ventricular deformation in hypertrophic cardiomyopathy. Circulation90 ( 2 ), 854 – 867 (1994).
- Ogata H , NakataniS, IshikawaYet al. Myocardial strain changes in Duchenne muscular dystrophy without overt cardiomyopathy. Int. J. Cardiol.115 ( 2 ), 190 – 195 (2007).
- Ryan TD , TaylorMD, MazurWet al. Abnormal circumferential strain is present in young Duchenne muscular dystrophy patients. Pediatr. Cardiol.34 ( 5 ), 1159 – 1165 (2013).
- Hor KN , KissoonN, MazurWet al. Regional circumferential strain is a biomarker for disease severity in duchenne muscular dystrophy heart disease: a cross-sectional study. Pediatr. Cardiol.36 ( 1 ), 111 – 119 (2015).
- Lang SM , ShughS, MazurWet al. Myocardial fibrosis and left ventricular dysfunction in Duchenne muscular dystrophy carriers using cardiac MRI. Pediatr. Cardiol.36 ( 7 ), 1495 – 1501 (2015).
- Spottiswoode BS , ZhongX, HessAet al. Tracking myocardial motion from cine DENSE images using spatiotemporal phase unwrapping and temporal fitting. IEEE Trans. Med. Imaging26 ( 1 ), 15 – 30 (2007).
- Aletras AH , DingS, BalabanRS, WenH. DENSE: displacement encoding with stimulated echoes in cardiac functional MRI. J. Magn. Reson.137 ( 1 ), 247 – 252 (1999).
- Aletras AH , TilakGS, NatanzonAet al. Retrospective determination of the area at risk for reperfused acute myocardial infarction with T2-weighted cardiac MRI histopathological and displacement encoding with stimulated echoes (DENSE) functional validations. Circulation113 ( 15 ), 1865 – 1870 (2006).
- Wehner GJ , SueverJD, HaggertyCMet al. Validation of in vivo 2D displacements from spiral cine DENSE at 3T. J. Cardiovasc. Magn. Reson.17 ( 1 ), Q120 (2015).
- Hor KN , BaumannR, PedrizzettiGet al. Magnetic resonance derived myocardial strain assessment using feature tracking. J. Visual. Exp.: JoVE ( 48 ), 2356 (2011).
- Hor KN , GottliebsonWM, CarsonCet al. Comparison of magnetic resonance feature tracking for strain calculation with harmonic phase imaging analysis. JACC: Cardiovasc. Imaging3 ( 2 ), 144 – 151 (2010).
- Augustine D , LewandowskiAJ, LazdamMet al. Global and regional left ventricular myocardial deformation measures by magnetic resonance feature tracking in healthy volunteers: comparison with tagging and relevance of gender. J. Cardiovasc. Magn. Reson.15 ( 1 ), 8 (2013).
- Osman NF , SampathS, AtalarE, PrinceJL. Imaging longitudinal cardiac strain on short-axis images using strain-encoded MRI. Magn. Reson. Med.46 ( 2 ), 324 – 334 (2001).
- Jung B , FöllD, BöttlerP, PetersenS, HennigJ, MarklM. Detailed analysis of myocardial motion in volunteers and patients using high-temporal-resolution MR tissue phase mapping. J. Magn. Reson. Imag.24 ( 5 ), 1033 – 1039 (2006).
- Young AA , CowanBR. Evaluation of left ventricular torsion by cardiovascular magnetic resonance. J. Cardiovasc. Magn. Reson.14 ( 1 ), 49 (2012).
- Reyhan ML , WangZ, KimHJ, HalnonNJ, FinnJP, EnnisDB. Effect of free-breathing on left ventricular rotational mechanics in healthy subjects and patients with Duchenne muscular dystrophy. Magn. Reson. Med.77 ( 2 ), 864 – 869 (2017).
- Hor KN , KissoonN, MazurWet al. Regional circumferential strain is a biomarker for disease severity in duchenne muscular dystrophy heart disease: a cross-sectional study. Pediatr. Cardiol.36 ( 1 ), 111 – 119 (2015).
- Reyhan M , WangZ, LiMet al. Left ventricular twist and shear in patients with primary mitral regurgitation. J. Magn. Reson. Imag.42 ( 2 ), 400 – 406 (2015).
- Kellman P , Chefd’hotelC, LorenzCH, ManciniC, AraiAE, McVeighER. Fully automatic, retrospective enhancement of real-time acquired cardiac cine MR images using image-based navigators and respiratory motion-corrected averaging. Magn. Reson. Med.59 ( 4 ), 771 – 778 (2008).
- Kellman P , LarsonAC, HsuLYet al. Motion-corrected free-breathing delayed enhancement imaging of myocardial infarction. Magn. Reson. Med.53 ( 1 ), 194 – 200 (2005).
- Reyhan M , NatsuakiY, EnnisDB. Fourier analysis of stimulated echoes (FAST) for the quantitative analysis of left ventricular twist. J. Magn. Reson. Imag.35 ( 3 ), 587 – 593 (2012).
- Weingärtner S , RoujolS, AkçakayaM, BashaTA, NezafatR. Free-breathing multislice native myocardial T1 mapping using the slice-interleaved T1 (STONE) sequence. Magn. Reson. Med.74 ( 1 ), 115 – 124 (2015).
- Aliotta E , MoulinK, ZhangZ, EnnisDB. Simultaneous measurement of T2 and apparent diffusion coefficient (T2+ ADC) in the heart with motion-compensated spin echo diffusion-weighted imaging. Magn. Reson. Med.79 ( 2 ), 654 – 662 (2018).
- Aliotta E , WuHH, EnnisDB. Convex optimized diffusion encoding (CODE) gradient waveforms for minimum echo time and bulk motion–compensated diffusion-weighted MRI. Magn. Reson. Med.77 ( 2 ), 717 – 729 (2017).
- Quinlivan RM , LewisP, MarsdenPet al. Cardiac function, metabolism and perfusion in Duchenne and Becker muscular dystrophy. Neuromuscul. Disord.6 ( 4 ), 237 – 246 (1996).