
Abstract
Aim: To investigate novel potential biomarkers for antidiastole of tuberculous pleural effusion (TPE) from malignant pleural effusion (MPE). Materials & methods: iTRAQTM-coupled LC–MS/MS were applied to analyze the proteome of TPE and MPE samples. The candidate proteins were verified by enzyme-linked immunosorbent assay. Results: A total of 432 differential proteins were identified. Enzyme-linked immunosorbent assay revealed significantly higher levels of fibronectin (FN) and cathepsin G (CTSG) in MPE than in TPE, but lower levels of leukotriene-A4 hydrolase (LTA4H). The receiver operator characteristic values were 0.285 for FN, 0.64 for LTA4H, 0.337 for CTSG and 0.793 for a combination of these candidate markers. Conclusion: FN, LTA4H and CTSG were identified as potential biomarkers to differentiate TPE from MPE and their combination exhibited higher diagnostic capacity.
Tuberculosis (TB) is an infectious disease caused by the bacterium Mycobacterium tubercu losis (Mtb) [Citation1] and affects the lung in the majority of patients [Citation2]. There were an estimated 10.4 million new (incident) TB cases and 1.4 million deaths worldwide in 2015 [Citation3]. Furthermore, TB remains one of the most frequent causes of pleural effusions attributing to antigenic proteins released by Mtb. These antigen were permeated into the pleural cavity and trigger the delayed hypersensitivity reaction generating the accumulation of fluid in the cavity [Citation1]. The detection of Mtb in the pleural fluid or pleural biopsy specimens is the gold standard for the diagnosis of tuberculous pleural effusion (TPE) [Citation4–6]. However, both the microscopy of acid-fast bacilli and the culture of Mtb in the pleural fluid showed extremely weak sensitivities in the diagnosis of TB pleuritis [Citation1,Citation7]. Routine chemistry indexes could be observed but lack of specificity, stability and accuracy in the identification of TPE and malignant pleural effusion (MPE) [Citation1]. Pleural fluid adenosine deaminase (ADA) is an important tool in the diagnosis of pleural TB. High ADA levels are related to the subset of activated T lymphocytes in response to tuberculous antigens [Citation8]. And it was reported that pleural fluid ADA levels were also independent predictors of worse survivalin patients with MPE [Citation9]. But the level of ADA may not have obvious antidiastole efficiency in antidiastole of TPE and MPE, although it performs great in the diagnosis of pleural TB.
In the present study, clinical samples of TPE and MPE collected from patients with lung cancer or TB pleuritis were used respectively for isobaric tagging for relative and absolute quantification (iTRAQTM)-based quantitative proteomic analysis. This study was expected to provide valuable novel biomarkers for the clinical antidiastole of TPE and MPE. In this study, iTRAQTM [Citation10,Citation11] combined with liquid chromatography–tandem mass spectrometry quantitation method, was applied to identify and quantify the differences of proteome in TPE and MPE clinical samples. And enzyme-linked immunosorbent assay (ELISA) was used for further verification.
Materials & methods
Patient populations & clinical specimens
A total of 20 TPE and 20 MPE specimens obtained from tuberculous pleurisy and non-small-cell lung cancer (NSCLC) patients were used to identify different expression proteins through proteomics approach. The samples were collected from the Department of Respiratory Medicine in the First Affiliated Hospital of Chongqing Medical University from November 2015 to August 2016. Tuberculous pleurisy was diagnosed according to the TB guidelines for the diagnosis and treatment of TB in the global TB report [Citation12]. Patients with NSCLC were diagnosed according to the diagnosis and treatment guide of National Comprehensive Cancer Network [Citation13], including four cases of stage I, six cases of stage II, 11 cases of stage III and nine cases of stage IV. The clinical characteristics of the patients were shown in .
Table 1. Laboratory characteristics of non-small-cell lung cancer and tuberculosis pleura effusions for proteome dataset.
To further investigate potential biomarkers from proteomic results in distinguishing TPE from MPE, 153 specimens were obtained from 40 patients with tuberculous pleurisy, 40 patients with NSCLC, 37 patients with parapneumonic pleural effusions (PPEs) and 36 patients with transudate of pleural cavity. The inclusion criteria of patients with PPEs were as follows: exudative effusions associated with bacterial pneumonia, lung abscesses or bronchiectasis; absence of Mtb in pleural fluid obtained from serial thoracentesis procedures; remission and recovery for ≥3 months at follow-up visits after antibiotic treatment; and pathological manifestations of inflammatory pleuritis, chronic empyema or pleural fibrosis and plaques without evidence of Mtb.; the specimens were collected in the Second Affiliated Hospital of Chongqing Medical University from November 2016 to August 2017. Tuberculous pleurisy was diagnosed following the TB guidelines for the diagnosis and treatment of TB in the global TB report (2016) [Citation14]. NSCLC patients were diagnosed according to the diagnosis and treatment guide of National Comprehensive Cancer Network [Citation13]. The laboratory characteristics of these 153 specimens were summarized in .
Table 2. Laboratory characteristics of four groups of pleural effusions for enzyme-linked immunosorbent assay analysis.
The pulmonary TB patients coupled with lung cancer were excluded from this study. The patients with diabetes mellitus, nephritis, hepatitis and having any anticancer therapy were also excluded. 5 ml of pleural effusions were collected in a sterile tube and centrifuged for 20 min at 4°C at the speed of 4000 rpm. The supernatant was then separated and stored at -80°C for further analysis. Informed consent was received from all the patients before the specimens were collected.
iTRAQ proteomics
Sample preparation for iTRAQ
Albumin and IgG in pleural effusion was removed by Proteo Prep Blue AlbuminandIgG Depletion kit (Sigma-Aldrich, MO, USA). 30 μl pleural effusion (100 μg protein) was mixed with 120 μl deoxidizer reagent and then bathed at 37°C for 1 h. Then 120 μl alkylating agents were added and incubated for 10 min at room temperature in the dark. The sample was transferred to an ultrafiltration centrifugal tube and centrifuged at 4°C, 11,500 rpm for 30 min to remove the unreactive components. 150 μl of tetraethylammonium bromide was added into each ultrafiltration device and then centrifuged at 4°C for 30 min at 11,500 rpm, repeated three-times and removed the discharge liquid, adding 100 μl confected enzymatic hydrolysate into each tube and 37°C water bathing overnight. The protein sample digested by enzyme was centrifuged at room temperature for 10 min at 11,500 rpm. Then 50 μl tetraethylammonium bromide was added and centrifuged for 5 min, 11,500 rpm under room temperature. The supernatant was transferred into the centrifuge and total protein concentration was measured with BCA protein assay kit (Pierce Biotechnology, IL, USA).
iTRAQ labeling
Proteins (100 μg) from each pool was blocked, digested and labeled in according to the iTRAQ protocol. The iTRAQ tags for MPE and TPE were 113 and 114, respectively. The labeled digests were combined into one sample mixture. To reduce any potential variation introduced by the labeling reaction, each sample was split in two identical aliquots of 50 μg to perform two technical replicates with tag swapping. One microgram of each labeled sample was individually analyzed by LC–MS/MS to check the completeness of the labeling. Acquired data were searched with Sequest search engine, setting the iTRAQ labeling as variable modification.
HPLC & mass assay
First dimensional separation at basic PH reverse phase chromatography
Tryptic digest mixture was dissolved in 100 μl mobile phase A (10 mM ammonium hydroxide in water/acetonitrile, 98/2 [v/v], PH = 10.5) and was then injected via a 1200 series HPLC (Agilent) into a Zorbax Extend-C18 column (150 × 2.1 mm, Agilent). The mobile phase B included 10 mM ammonium hydroxide in water/acetonitrile, 10/90 (v/v), the linear gradient elution was performed with 5–45% B in 50 min at a flow rate of 0.3 ml/min. A total of 12 fractions from the first dimensional separation was collected (one fraction per 4 min) and then lyophilized for further second dimensional online LC–MS analysis.
Reverse phase nanoflow HPLC & tandem mass spectrometry
The lyophilized digestion was re-dissolved in 2% acetonitrile, 0.1% formic acid and loaded on ChromXP C18 nanoLC trap column. The online chromatography separation was employed on the Eksigent nanoLC-Ultra™ 2D System. The trapping, desalting procedure was carried out at 2 μl/min for 10 min with 100% solvent A. Solvents were composed of water/acetonitrile/formic acid. Then, an elution gradient of 5–35% acetonitrile (0.1% formic acid) in 50-min gradient was used on an analytical column. LC–MS/MS analysis was performed with a TripleTOF 5600 System fitted with a Nanospray III source. Data were acquired using an ion spray voltage of 2.5 kV, curtain gas of 30 PSI, nebulizer gas of 5 PSI and an interface heater temperature of 150°C.
Protein identification by LC–MS analysis
The MS/MS data were analyzed for protein identification and quantification using ProteinPilot v.4.5 (AB Sciex, Inc., USA). The local false discovery rate was estimated with the integrated PSPEP tool in the ProteinPilot software after searching in uniprot human database, which contains 134,366 protein sequences downloaded from the website of UniprotKB Results (http://www.uniprot.org/uniprot/). Three upregulated proteins (cathepsin G [CG] and fibronectin [FN]) and one downregulated protein (leukotriene A-4 hydrolase [LTA4H]) were selected to perform further validation.
ELISA validation
The expression of CG, FN and LTA4H in human TPE and MPE were operated by sandwich ELISA kits purchased from R&D systems (MN, USA). The protein levels were positively correlated with the depth of reaction product's color. According to the standard curve, the concentration of proteins in the pleural effusion were calculated.
Statistical analysis
All statistical calculations were performed using SPSS v16.0 (SPSS, Inc., IL, USA). Student's t-test was used to compare continuous variables. One-way ANOVA was employed to compare the variations among more than two groups. A two-tailed p value ≤ 0.05 was considered statistically significant. Receiver operator characteristic (ROC) curves were used to present the diagnostic sensitivity, specificity and the areas under the ROC curves (AUC), according to Hanley and McNeil method [Citation15]. Logistic regression analysis was applied to predict the diagnostic probability. All these tests were performed in triplicates.
Results
Differential proteins between TPE & MPE
A total of 432 mapped proteins from the 14,221 iTRAQ-labeled peptides were identified though proteomic analysis using a cut-off of ProtScore>1.3 and CI >95% (p < 0.05). According to the criteria of fold change >2.0 or <0.5 between TPE and MPE, we identified 219 downregulated and 76 upregulated differential expression proteins. displays the most significantly expressed upregulated (n = 15) and downregulated proteins (n = 15) for differentiation of TPE from MPE.
Table 3. The upregulated proteins (n = 15) and downregulated proteins (n = 15) for tuberculous pleural effusion compared with malignant pleural effusion.
Three potential pleural effusion biomarkers for antidiastole of TPE & MPE
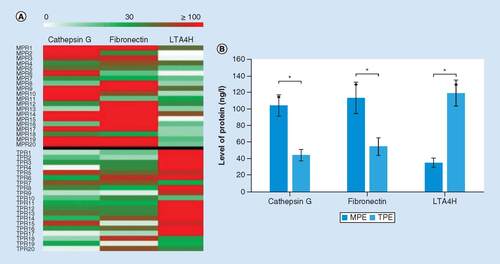
Among the most differentially expressed proteins, based on previous research, CTSG, FN and LTA4H were selected as candidates among the 30 differential proteins for further verification. A presents the expressions of CTSG, FN and LTA4H in the TPE and MPE groups, stratified by the level of the TPE group. Combined with the average levels measured by proteomics analysis (B), both CTSG and FN were higher in the MPE group than that in the TPE group, while the level of LTA4H expression was higher in the TPE group.
(A) Heat map of cathepsin, fibronectin and LTA4H levels in TPE and MPE samples. The heat map above the black line is the MPE group and the heat map under the black line is the TPE group. (B) The average levels of cathepsin, fibronectin and LTA4H expressed in TPE and MPE measured by proteomics analysis. The reported values are the mean ± SD.
*p < 0.05.
MPE: Malignant pleural effusion; SD: Standard deviation; TPE: Tuberculous pleural effusion.
Validation of pleural effusion biomarkers for distinguishing TPE & MPE
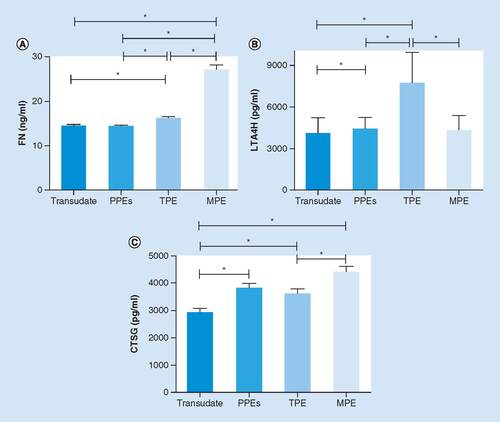
To verify the result of proteomics analysis, we extended the pleural effusion (PE) sample size to 153 specimens, comprising a TPE group (n = 40), an MPE group (n = 40), a PPEs group (n = 37) and a ‘transudate’ group (n = 36). ELISA was employed to perform preliminary clinical verification of the three candidates selected from proteomic analysis (CTSG, FN and LTA4H), as described above. As shown in A, significant difference in the expression of FN was observed between the TPE and MPE groups. The level of FN was much higher in the MPE group than that in the TPE group (p < 0.05), while compared with the PPEs and transudate groups, the FN in the TPE group was expressed in higher levels (p < 0.05). B reveals particularly significant elevation of LTA4H in the TPE group, compared with other groups (p < 0.05). The concentration of LTA4H in the TPE group was obviously higher than that in the MPE group (p < 0.05). In C, a trend toward a higher CTSG expression was additionally observed in the MPE group. The level of CTSG in the TPE group was significantly lower than that in the MPE group (p < 0.05); however, it was similar to that in the PPEs group (p > 0.05). The results revealed that the outcomes of ELISA were consistent with the proteomic analysis. Moreover, it had profound implications in distinguishing TPE and MPE that the levels of three potential pleural effusion biomarkers had evident statistical differences between the TPE and MPE groups.
The concentrations of FN (A), LTA4H (B) and CTSG (C) in four different groups of PE analyzed by ELISA. Each column represents the mean ± SD of at least three independent experiments.
*p < 0.05.
CTSG: Cathepsin G; FN: Fibronectin; MPE: Malignant pleural effusion; PPE: Pleural effusions; SD: Standard deviation; TPE; Tuberculous pleural effusion.
ROC analysis of pleural effusion biomarkers for the distinction of TPE & MPE
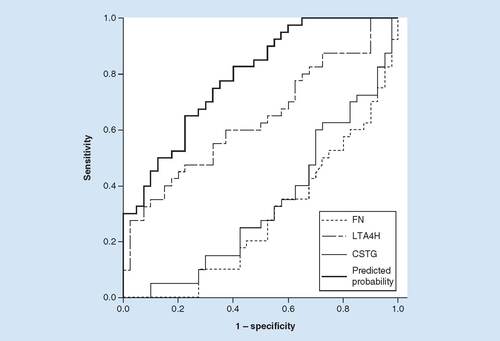
Based on the preliminary validation of the three candidate markers in different groups by ELISA, further displays the ROC plots of these markers and their combination for discrimination between TPE and MPE. The AUC value was determined to be 0.285 for FN (95% CI: 0.174–0.396), 0.64 for LTA4H (95% CI: 0.518–0.762), 0.337 for cathepsin G (CTSG; 95% CI: 0.218–0.456) and 0.793 for a combination of these candidate markers (95% CI, 0.697–0.888). The highest predicate probability of the candidate markers combination measured via logistic regression analysis was 0.963 at the cut-off value of 13.37 (FN, ng/l), 8746.59 (LTA4H, pg/l) and 2070.91 (CTSG, pg/l) for distinction of TPE from MPE. Besides, the optimal sensitivity and specificity of the combination of all the indexes were 0.650 and 0.775, respectively. Based on these results, the combination of three biomarkers exhibited higher antidiastole ability, relative to the three markers alone.
Based on the results of ELISA, reciever operating characteristiccurve analysis was employed to calculate the sensitivity, specificity and the areas under the curves (AUC). The predicate probability was 0.963 measured by logistic regression analysis. ROC analysis of FN, LTA4H, CTSG and a combination of three candidate markers for discrimination between tuberculous pleural effusion and malignant pleural effusion. The AUC value was determined as 0.285 for FN (95% CI: 0.174–0.396), 0.64 for LTA4H (95% CI: 0.518–0.762), 0.337 for CTSG (95% CI: 0.218–0.456) and 0.793 for a combination of these candidate markers (95% CI: 0.697–0.888). The optimal sensitivity and specificity of the combination of all the indexes were 0.650 and 0.775, respectively.
CTSG: Cathepsin G; FN: Fibronectin.
Discussion
TPE is the most common clinical manifestation of extra-pulmonary TB, which is one of the most frequent causes of pleural effusion [Citation16,Citation17]. Besides pulmonary TB, lung cancer is also prone to be complicated with PE [Citation18–20]. The major challenges in laboratory medicine are related to the diagnosis and antidiastole of TPE with other types of pleural effusion. Our study applied proteomic technology to analyze clinical samples and reveal potentially meaningful biomarkers for antidiastole of TPE from MPE. This new study attempted to fill the gap in this area which has previously been neglected.
Nowadays, the definitive diagnosis of TPE depends on the demonstration of tuberculous bacilli in sputum, PE or pleural biopsy specimens or the observation of granulomas [Citation21]. However, there exists a frequency of overlooks in sputum culture test for Mtb for the diagnosis of PE. The positive rate of Mtb culture is between 41.7 and 52% and it requires several weeks; however, the test offers 100% diagnostic specificity [Citation22,Citation23]. The detection of ADA is more common in TPE based on its high sensitivity and specificity [Citation24,Citation25]. Beside, the measurement of unstimulated pleural fluid IFN-γ concentration by ELISA assay is also considered as a useful diagnostic tool for TB pleuritis [Citation26]. While ADA remains an inflammatory biomarker, it confers a lack of specificity as the level of ADA significantly changes not only in TPE but also in MPE and is associated with worse survival of patients with MPE [Citation9] The IFN-γ test is not yet widely available in clinical practice and important information on its utility in low TB burden settings is also not yet available [Citation1,Citation27]. Furthermore, the determination of other routine chemistry indexes for the diagnosis of TPE has a lower yield than that of ADA and IFN-γ and had these own localization [Citation17]. Appropriate novel biomarkers need to be discovered to identify TPEs from other types of effusion.
Among the different pathogenic factors that induce MPE, lung cancer is the predominant etiology [Citation28]. NSCLC accounts for 85% of all lung cancers, with the majority of patients initially diagnosed at advanced stages [Citation29]. Furthermore, MPE and TPE contain plenty of protein components that directly relate to malignant tumor and tuberculous pleurisy. MPE is usually diagnosed by exfoliated cytological examination or transcutaneous pleural biopsy [Citation30]. However, a limited number (only 40–70%) of patients with MPE can be diagnosed via cytological examination or pleural biopsy [Citation31]. To date, several potential biomarkers, carcinoembryonic antigen (CEA), lung surfactant protein A and VEGF, have been evaluated in MPE. However, due to limitations in sensitivity and specificity, these markers are not currently recommended or encouraged in routine clinical practice [Citation30,Citation32]. Therefore, the differentiation of TPE from MPE has profound implications in the diagnosis as well as therapy of TB and lung cancer.
To provide valuable novel biomarkers for the clinical antidiastole of TPE and MPE, isobaric tagging for relative and absolute protein quantification (iTRAQTM), combined with LC–MS/MS, was applied in this project [Citation12,Citation13]. We defined 432 different expression proteins from 20 PE clinical specimens of TPE and MPE (NSCLC). These contained 219 upregulating proteins and 75 downregulating proteins g. The 15 proteins with most significant differences in upregulation and downregulation are shown in . Based on the literature search, FN, LTA4H and CTSG were selected as the candidates among 30 different expression proteins for further verification. Finally, we discovered that both FN and CTSG had higher levels in the MPE samples compared to those in the TPE samples, while the LTA4H level in the TPE samples was significantly higher than that in the MPE samples.
FN, a member of the glycoprotein family with high-molecular weight and ligands of integrins, plays a major role in cell adhesion, growth, migration and differentiation, and it is also important for biological processes, such as wound healing and embryonic development [Citation33–35]. Altered FN expression, degradation and organization have been associated with a number of pathologies, including cancer and fibrosis [Citation33]. In addition, FN has also been reported as an important regulator of cisplatin-based chemotherapy resistance in advanced NSCLC [Citation36]. LTA4H, a bio-functional enzyme with epoxy hydrolase and aminopeptidase activities, plays an important role as a chemoattractant for neutrophils [Citation37]. Besides, it has been reported that combined drug therapy can ameliorate acute lung injury in mice models [Citation38]. LTA4H also possesses aminopeptidase activity with the neutrophil chemoattractant proline–glycine–proline, which is a biomarker for chronic obstructive pulmonary disease [Citation39]. A paucity of studies report the significance of elevated LTA4H in TPE. Hence, we speculate that the chronic inflammation associated with pulmonary TB may induce an accumulation of neutrophils and lead to the increase in LTA4H found in TPE. CTSG, a member of the peptidase S1 protein family, participates in the killing and digestion of engulfed pathogens and in connective tissue remodeling at inflammation sites [Citation40,Citation41]. In addition, CTSG and neutrophil elastase have been reported to play important roles in the deceleration of pathogen replication during the early phase of antimycobacterial responses [Citation42] and were downregulated in THP-1 monocytes after infection with Mtb [Citation43].
Furthermore, we collected more clinical samples to verify the proteomics results and the results of ELISA were consistent with those of proteomic analysis. Moreover, the PPEs group and transudate group were taken into consideration. Different expressions of candidates were not only found between TPE and MPE groups, but also existed among the other groups. This indicated that the three candidates were expressed at different levels in different conditions. Three potential biomarker levels in TPE were significantly different among other three groups. However, the CTSG level was similarly expressed in the TPE and PPEs groups. The underlying mechanisms deserve more investigation. Through the analysis of ROC curve, we found that LTA4H had a higher AUC value than CTSG and FN. Indeed, the potential biomarkers demonstrated an unexpected diagnostic efficiency, respectively, while their combination showed greater diagnostic yield. The combination of the three biomarkers exhibited higher diagnostic capacity, relative to the three markers alone ().
Conclusion
In conclusion, FN, LTA4H and CTSG were identified as potential biomarkers to antidiastole TPE from MPE. Furthermore, their combination exhibited higher diagnostic capacity. These novel biomarkers could have a profound impact on the diagnosis and therapy of TB and lung cancer.
An appropriate novel biomarker crucially needs to be discovered to identify tuberculous pleural effusions (TPEs) from other types of effusion.
This study aimed to investigate novel potential biomarkers for antidiastole TPE from malignant pleural effusion (MPE).
Methods
Quantitative proteomic analysis of the proteomes of TPE and MPE with iTRAQTM-coupled LC–MS/MS was performed.
Results
The expressions of CTSG, FN and LTA4H were significantly different in TPE compared with those in para-pneumonic pleural effusions and transudate groups.
FN, LTA4H and CTSG were identified as novel biomarkers for antidiastole TPE from MPE.
The combination of FN, LTA4H and CTSG exhibited a higher diagnostic capacity.
Discussion
This work provides valuable novel biomarkers for the clinical antidiastole of TPE from MPE.
The identification of these biomarkers may confer a profound impact on the diagnosis and therapy of tuberculosis and lung cancer.
Ethical conduct of research
The authors state that they have obtained appropriate institutional review board approval or have followed the principles outlined in the Declaration of Helsinki for all human or animal experimental investigations. In addition, for investigations involving human subjects, informed consent has been obtained from the participants involved.
Author's contributions
All authors fulfill all of the four criteria:
Substantial contributions to the conception or design of the work; or the acquisition, analysis, or interpretation of data for the work;
Drafting the work or revising it critically for important intellectual content;
Final approval of the version to be published;
Agreement to be accountable for all aspects of the work in ensuring that questions related to the accuracy or integrity of any part of the work are appropriately investigated and resolved.
Acknowledgements
The manuscript has been seen and approved by all authors. There is no conflict of interest for authors.
Financial & competing interests disclosure
This work was supported by Chongqing Science &Technology commission (No. cstc2015jcyjA10079) and Chongqing Municipal Education Commisson. (No. KJ1702036); the Project of the National Science Foundation of China under Grants 61401285, 81702083 and 81401750; Shenzhen Science Plan JCYJ20140418182819179. The authors have no other relevant affiliations or financial involvement with any organization or entity with a financial interest in or financial conflict with the subject matter or materials discussed in the manuscript apart from those disclosed.
No writing assistance was utilized in the production of this manuscript.
References
- Vorster MJ , AllwoodBW, DiaconAH, KoegelenbergCF. Tuberculous pleural effusions: advances and controversies. J. Thorac. Dis.7 (6), 981–991 (2015).
- Porcel JM . Tuberculous pleural effusion. Lung187 (5), 263–270 (2009).
- World Health Organization . Global tuberculosis report 2016. http://www.tbonline.info/posts/2016/10/16/global-tb-report-2016/.
- Diacon AH , Van De WalBW, WyserCet al. Diagnostic tools in tuberculous pleurisy: a direct comparative study. Eur. Respir. J.22 (4), 589–591 (2003).
- Light RW . Update on tuberculous pleural effusion. Respirology15 (3), 451–458 (2010).
- Koegelenberg CF , BolligerCT, TheronJet al. Direct comparison of the diagnostic yield of ultrasound-assisted Abrams and Tru-Cut needle biopsies for pleural tuberculosis. Thorax65 (10), 857–862 (2010).
- Valdes L , San-JoseE, FerreiroLet al. Predicting malignant and tuberculous pleural effusions through demographics and pleural fluid analysis of patients. Clin. Respir. J.9 (2), 203–213 (2015).
- Yildirim H , MetintasM, AkGet al. Increased pleural fluid adenosine deaminase levels in patients with malignant pleural effusions: a potential predictor of talc pleurodesis outcome. Lung185 (6), 349–354 (2007).
- Terra RM , AntonangeloL, MarianiAW, De OliveiraRL, TeixeiraLR, Pego-FernandesPM. Pleural fluid adenosine deaminase (ADA) predicts survival in patients with malignant pleural effusion. Lung194 (4), 681–686 (2016).
- Yang Y , MuJ, ChenGet al. iTRAQ-based quantitative proteomic analysis of cerebrospinal fluid reveals NELL2 as a potential diagnostic biomarker of tuberculous meningitis. Int. J. Mol. Med.35 (5), 1323–1332 (2015).
- Ding Y , YangM, SheSet al. iTRAQ-based quantitative proteomic analysis of cervical cancer. Int. J. Oncol.46 (4), 1748–1758 (2015).
- WHO . Treatment of tuberculosis guidelines for national programmes (2015). http://apps.who.int/bookorders/anglais/detart1.jsp?sesslan=1&codlan=1&codcol=15&codcch=4397.
- Thurnher MM . 2007 World Health Organization classification of tumours of the central nervous system. Cancer Imaging9 (Spec No A), S1–S3 (2009).
- WHO . Treatment guidelines for drug-resistant tuberculosis (2016). https://www.who.int/tb/areas-of-work/drug-resistant-tb/treatment/resources/en/.
- Hanley JA , McneilBJ. A method of comparing the areas under receiver operating characteristic curves derived from the same cases. Radiology148 (3), 839–843 (1983).
- Zeng N , WanC, QinJet al. Diagnostic value of interleukins for tuberculous pleural effusion: a systematic review and meta-analysis. BMC Pulm. Med.17 (1), 180 (2017).
- Ferreiro L , San JoseE, ValdesL. Tuberculous pleural effusion. Arch. Bronconeumol.50 (10), 435–443 (2014).
- Rodriguez-Panadero F , Romero-RomeroB. Management of malignant pleural effusions. Curr. Opin. Pulm. Med.17 (4), 269–273 (2011).
- Simpson G , JudgeDJ. Management of malignant pleural effusion. Respirology20 (1), 169 (2015).
- Srour N , AmjadiK, ForsterA, AaronS. Management of malignant pleural effusions with indwelling pleural catheters or talc pleurodesis. Can. Respir. J.20 (2), 106–110 (2013).
- Gopi A , MadhavanSM, SharmaSK, SahnSA. Diagnosis and treatment of tuberculous pleural effusion in 2006. Chest131 (3), 880–889 (2007).
- Valdes L , FerreiroL, Cruz-FerroEet al. Recent epidemiological trends in tuberculous pleural effusion in Galicia, Spain. Eur. J. Intern. Med.23 (8), 727–732 (2012).
- Ruan SY , ChuangYC, WangJYet al. Revisiting tuberculous pleurisy: pleural fluid characteristics and diagnostic yield of mycobacterial culture in an endemic area. Thorax67 (9), 822–827 (2012).
- Qiu L , TeeterLD, LiuZet al. Diagnostic associations between pleural and pulmonary tuberculosis. J. Inf. Secur.53 (6), 377–386 (2006).
- Liang QL , ShiHZ, WangK, QinSM, QinXJ. Diagnostic accuracy of adenosine deaminase in tuberculous pleurisy: a meta-analysis. Respir. Med.102 (5), 744–754 (2008).
- Yurt S , KucukerginC, YigitbasBA, SeckinS, TiginHC, KosarAF. Diagnostic utility of serum and pleural levels of adenosine deaminase 1–2, and interferon-gamma in the diagnosis of pleural tuberculosis. Multidiscip. Respir. Med.9 (1), 12 (2014).
- Dheda K , Van Zyl-SmitRN, SechiLAet al. Utility of quantitative T-cell responses versus unstimulated interferon-{gamma} for the diagnosis of pleural tuberculosis. Eur. Respir. J.34 (5), 1118–1126 (2009).
- Heffner JE , KleinJS. Recent advances in the diagnosis and management of malignant pleural effusions. Mayo. Clin. Proc.83 (2), 235–250 (2008).
- Moro-Sibilot D , SmitE, De Castro CarpenoJet al. Outcomes and resource use of non-small cell lung cancer (NSCLC) patients treated with first-line platinum-based chemotherapy across Europe: FRAME prospective observational study. Lung Cancer88 (2), 215–222 (2015).
- Yu CJ , WangCL, WangCIet al. Comprehensive proteome analysis of malignant pleural effusion for lung cancer biomarker discovery by using multidimensional protein identification technology. J. Proteome Res.10 (10), 4671–4682 (2011).
- Sallach SM , SallachJA, VasquezE, SchultzL, KvaleP. Volume of pleural fluid required for diagnosis of pleural malignancy. Chest122 (6), 1913–1917 (2002).
- Domej W , TilzGP, Földes-PappZet al. Cystatin C of pleural effusion as a novel diagnostic aid inpleural diseases of different aetiologies. Clin. Sci. (London)102 (3), 373–380 (2002).
- Malik G , KnowlesLM, DhirRet al. Plasma fibronectin promotes lung metastasis by contributions to fibrin clots and tumor cell invasion. Cancer Res.70 (11), 4327–4334 (2010).
- Pankov R , YamadaKM. Fibronectin at a glance. J. Cell Sci.115 (20), 3861–3863 (2002).
- Williams CM , EnglerAJ, SloneRD, GalanteLL, SchwarzbauerJE. Fibronectin expression modulates mammary epithelial cell proliferation during acinar differentiation. Cancer Res.68 (9), 3185–3192 (2008).
- Meena LS , MeenaJ. Cloning and characterization of a novel PE_PGRS60 protein (Rv3652) of Mycobacterium tuberculosis H37 Rv exhibit fibronectin-binding property. Biotechnol. Appl. Biochem.63 (4), 525–531 (2016).
- De Oliveira EO , WangK, KongHSet al. Effect of the leukotriene A4 hydrolase aminopeptidase augmentor 4-methoxydiphenylmethane in a pre-clinical model of pulmonary emphysema. Bioorg. Med. Chem. Lett.21 (22), 6746–6750 (2011).
- Xiao Q , DongN, YaoXet al. Bufexamac ameliorates LPS-induced acute lung injury in mice by targeting LTA4H. Sci. Rep.6, 25298 (2016).
- Snelgrove RJ , JacksonPL, HardisonMTet al. A critical role for LTA4H in limiting chronic pulmonary neutrophilic inflammation. Science330 (6000), 90–94 (2010).
- Okudela K , MitsuiH, WooTet al. Alterations in cathepsin L expression in lung cancers. Pathol. Int.66 (7), 386–392 (2016).
- Hamon Y , LegowskaM, HerveVet al. Neutrophilic cathepsin c is maturated by a multistep proteolytic process and secreted by activated cells during inflammatory lung diseases. J. Biol. Chem.291 (16), 8486–8499 (2016).
- Steinwede K , MausR, BohlingJet al. Cathepsin G and neutrophil elastase contribute to lung-protective immunity against mycobacterial infections in mice. J. Immunol.188 (9), 4476–4487 (2012).
- Rivera-Marrero CA , StewartJ, ShaferWM, RomanJ. The down-regulation of cathepsin G in THP-1 monocytes after infection with Mycobacterium tuberculosis is associated with increased intracellular survival of bacilli. Infect. Immun.72 (10), 5712–5721 (2004).