
 ?Mathematical formulae have been encoded as MathML and are displayed in this HTML version using MathJax in order to improve their display. Uncheck the box to turn MathJax off. This feature requires Javascript. Click on a formula to zoom.
Abstract
Aim: Using baseline data from a clinical trial of domagrozumab in Duchenne muscular dystrophy, we evaluated the correlation between functional measures and quantitative MRI assessments of thigh muscle. Patients & methods: Analysis included timed functional tests, knee extension/strength and North Star Ambulatory Assessment. Patients (n = 120) underwent examinations of one thigh, with MRI sequences to enable measurements of muscle volume (MV), MV index, mean T2 relaxation time via T2-mapping and fat fraction. Results: MV was moderately correlated with strength assessments. MV index, fat fraction and T2-mapping measures had moderate correlations (r ∼ 0.5) to all functional tests, North Star Ambulatory Assessment and age. Conclusion: The moderate correlation between functional tests, age and baseline MRI measures supports MRI as a biomarker in Duchenne muscular dystrophy clinical trials. Trial registration: ClinicalTrials.gov, NCT02310763; registered 4 November 2014.
Lay abstract
Clinical trials in Duchenne muscular dystrophy have proven to be challenging, due in part to the lack of robust biomarkers that are sensitive to detecting disease progression. While physical function, such as walking or climbing stairs, will be critical to demonstrating the long-term efficacy of a therapeutic, MRI may be a more objective approach that could detect subtle changes in disease status and offer earlier signals of clinical efficacy. In this study, researchers used baseline data from a Phase II clinical study (NCT02310763) to evaluate the relationship between measures of physical function and quantitative MRI assessments. They found that many MRI measures were moderately correlated with physical function, and muscle volume measurements were correlated with measures of strength. This study supports the use of MRI as a biomarker in Duchenne muscular dystrophy clinical trials.
Background
Duchenne muscular dystrophy (DMD) is a rare genetic X-linked neuromuscular disease. The estimated incidence of DMD is 15.9–19.5 per 100,000 newborn males [Citation1]. Patients with DMD suffer from progressive muscle fiber degeneration and weakness that initially results in motor milestone delay and progressively advances to loss of independent ambulation and ability to perform activities of daily living [Citation2]. Respiratory impairment and cardiomyopathy generally ensue, and historically, patients rarely survived beyond their second decade. Improvement in cardiac and respiratory care of patients with DMD has extended life expectancy and enables more patients to survive into their third decade and beyond [Citation3].
DMD is caused by mutations in the dystrophin gene that lead to deficiency or complete lack of the protein dystrophin, which is essential for muscle fiber stability [Citation2]. Although the molecular origin of DMD has been known for many years, treatment options remain limited. Demonstration of clinical benefit in clinical trials of DMD has proven to be challenging, in part due to the lack of robust clinical end points and biomarkers to detect disease progression in relatively short durations. Functional end points in clinical trials can present several challenges due to nonlinear functional changes, the variability of end point measurement, heterogeneity of disease progression and the essential subjectivity inherent in the voluntary performance and measurement of motor tasks [Citation4,Citation5]. Therefore, there is an unmet need for objective outcome measures in DMD that represent both the underlying pathophysiology and disease progression, in addition to being sensitive to treatment effects.
MRI of the muscle has proven to be a valuable noninvasive tool for monitoring disease progression in patients with DMD [Citation6–10]. DMD disease progression is characterized by inflammation, progressive muscle necrosis, impaired muscle regeneration and replacement of muscle with fat and fibrotic tissue [Citation9,Citation11]. Correlation of pathological findings with MRI is the standard for evaluating the timing and extent of response to therapeutic intervention [Citation12,Citation13]; however, evaluation of the correlation between functional tests and quantitative MRI is a necessary first step to establish imaging as a sensitive, reliable and potentially predictive biomarker for future clinical studies. Previous studies have demonstrated correlations between functional tests and imaging [Citation14–19] and a systematic review reported correlations between MRI measurements and motor function, with the strongest correlations using quantitative MRI measurements such as fat fraction or mean T2 [Citation20]. Furthermore, recent retrospective analyses from natural history studies have shown that MRI fat fraction and T2 measures in the vastus lateralis and biceps femoris long head were among the fastest progressing biomarkers to predict future functional decline in boys with DMD [Citation21–23].
The work done to date characterizing the relationship between MRI measures and functional performance suggests that MRI could be an important biomarker for future clinical trials. This underscores the need to have a robust understanding of the relationship between different MRI measures and various functional measures commonly used to assess disease progression in DMD. For biomarker implementation in future interventional clinical studies in DMD, imaging protocols must be widely accessible at clinical imaging centers, and analysis methods must be scalable to allow a high throughput of images.
This article outlines imaging protocols and methods that were scalable and applied in a Phase II, multicenter, global clinical trial (NCT02310763) to evaluate domagrozumab in ambulatory boys with DMD [Citation24]. Using baseline data from this trial, we evaluated the correlation between an array of functional tests and quantitative MRI assessments of the thigh. The relationships between functional tests and scalable MRI assessments, together with an understanding of age-related changes, will help inform future clinical trial design.
Patients & methods
Study design & patients
This Phase II trial was designed to evaluate the safety and tolerability, efficacy, pharmacokinetics and pharmacodynamics of domagrozumab (PF-06252616) in boys with DMD. The study protocol, protocol amendments and informed consent/assent forms were approved by the institutional review board or ethics committee. The study was conducted in accordance with legal and regulatory requirements, international ethical guidelines for biomedical research involving human subjects, Good Clinical Practices and the Declaration of Helsinki. Written informed consent by parent or legal guardian, and the patient’s assent when applicable, were obtained before any study-specific activity was performed.
Patients were enrolled at 31 sites in eight countries. Enrolled patients were ambulatory boys aged 6 to <16 years with medically and genetically confirmed DMD. All patients were receiving glucocorticosteroid therapy for a minimum of 6 months, with stable dosing for at least 3 months prior to baseline imaging and functional assessments. Only patients who were able to climb four stairs in ≥2.5 but ≤12 s at the screening visit proceeded to the imaging and functional assessments. Those patients who were unwilling or unable (e.g., metal implants, requires sedation) to undergo examination with closed MRI without sedation were not enrolled. Boys were enrolled between November 2014 and May 2018.
The focus of the analysis presented herein was on baseline data from the functional end points and quantitative thigh MRI assessments. Predose data from all patients with MRI images (n = 120) were evaluated to compare baseline functional assessments with baseline thigh MRI measurements and patient age. All MRI measures were acquired during the screening period, a 42-day window before initiating dosing with domagrozumab or placebo. Functional measures were acquired during the baseline visit before dosing; however, if there were missing values, their values acquired from the screening period were used as the baseline.
Efficacy & pharmacodynamic assessments
Key functional measures included in this analysis: timed functional tests (four-stair climb, rise from the floor, run 10 m, 6-min-walk distance), North Star Ambulatory Assessment (NSAA) and knee extension strength evaluation. All functional assessments were conducted and evaluated by trained and study-certified physiotherapists/physiologists. Knee extension strength was quantified by means of a handheld dynamometer. Key imaging measures included: thigh muscle volume (MV), MV index (MVI), thigh fat fraction and T2-mapping.
MRI images were collected from imaging facilities trained on the specific requirements of this study. All sites were trained to acquire images according to imaging guidelines as described in the next section. Site training covered all aspects of imaging, including patient positioning, setting up the imaging sequences, image quality review and submission of images to a central imaging laboratory. Techniques for pediatric imaging were discussed with sites, and all sites were able to collect images without the use of sedation. As part of the training, sites collected images of a healthy volunteer to demonstrate understanding of the imaging study requirements. After the volunteer test scans were approved, the scanner and MRI technologists were considered qualified for the study.
After image acquisition at the site, images were sent to BioTelemetry Research (Cardiocore & VirtualScopics, NY, USA) for quality inspection and evaluation. All images were evaluated by a trained radiologist reader using in-house software. Only images collected from qualified MRI scanners using the standardized scanning protocol were accepted for analysis.
MRI scanning protocol
MRI protocols were designed to be fast enough to be well tolerated by pediatric patients while minimizing discomfort. MRI scans were collected across all sites using either 1.5 T or 3.0 T MRI scanners. Thighs were imaged using multiple scan sequences to evaluate MV, mean T2 relaxation time and fat fraction. Boys were positioned in the scanner in a supine position with a target leg elevated above the scan table to prevent thigh compression from affecting MV measurements. The target leg was stabilized parallel to the scanner table using positioning sponges to increase patient comfort. The target leg, typically the right leg, was the thigh that would be evaluated during image review at all study time points.
Sites were not selected based on their MRI scanner; the protocol was designed to be broadly generalizable on most clinical scanners. The following parameters were provided to sites during the site training process. Modifications were made as needed to achieve high-quality images for analysis. For the proton-density scan and Dixon scans, sites were instructed to acquire images covering from the acetabulum to the bottom of the patella. For T2-mapping protocols, acquisitions started from the top of the lesser trochanter and captured approximately 7–10 cm of the proximal thigh. The proton-density scan protocol was selected to allow for image acquisition throughout the upper leg in a relatively short time period without loss of image quality while still generating good contrast between muscle and surrounding fat tissue. The Dixon and T2-mapping scanning protocols were selected to maximize the number of sites that could acquire these scans.
Proton-density scan
Sites were instructed to acquire axial fast spin echo, turbo spin echo or spin echo sequences using the inherent body coil. Imaging guidelines included repetition time approximately 3000–4000 ms, echo time approximately 13 ms, field of view approximately 320 mm, slice thickness 5 mm with 0-mm gap, number of averages approximately 2 and acquisition matrix approximately 320 × 320. In some cases, multiple sequences were acquired to achieve full coverage of the thigh.
Dixon scan
Sites were instructed to acquire axial 2- or 3-point Dixon scans using manufacturer provided sequences with the inherent body coil. Sequences included IDEAL or LAVA Flex on GE systems, mDixon on Philips systems and Vibe Dixon on Siemens systems. Only sites that had manufacturer-supplied fat/water imaging sequences were required to submit Dixon scans for analysis. Parameters were modified according to manufacturer protocols, with the following guidelines: field of view approximately 320 mm, slice thickness 5–10 mm with 0-mm gap, number of averages approximately 2 and acquisition matrix approximately 256 × 192. Field of view was adjusted per patient and minimized when possible.
T2-mapping scans
T2-mapping scans were typically acquired using a body/torso array coil. Sites were instructed to acquire axial spin-echo scans using the following guidelines: repetition time approximately 1500–3000 ms, echo times approximately five echoes 20–120 ms, field of view approximately 320 mm, slice thickness approximately 7 mm with 2-mm gap, no fat saturation, number of averages approximately one and acquisition matrix approximately 256 × 256. To ensure the quality of T2-mapping acquisitions, a phantom was included in the scan field of view and reviewed as part of the quality control assessment at BioTelemetry Research. T2 values had to be within 10% of the expected range in order for an image to pass the quality inspection. The T2 phantom included five vials with varying levels of copper sulfate, representing 15, 30, 60, 120 and 240 ms relaxation times.
Image analysis
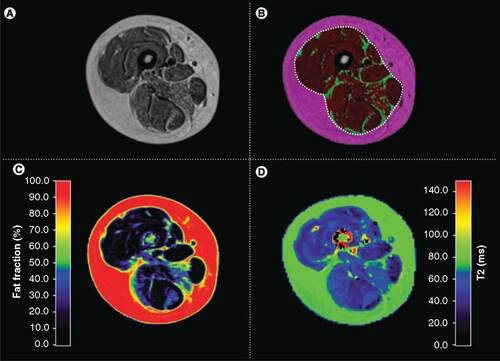
All images were evaluated at BioTelemetry Research using in-house software. Segmentation algorithms based on fuzzy clustering and active contours [Citation25–27] were used to segment images into bone, muscle bundle and subcutaneous fat for each acquired slice of the target thigh (A & B). The muscle bundle of proton-density weighted scans was then segmented into muscle and inter/intra-muscular fat regions (B). The region of interest determinations was reviewed for each slice by an imaging technologist and then confirmed by a study-trained independent radiologist to ensure accuracy of image segmentation. The combined muscle and inter/intra-muscular fat regions represents the entire muscle bundle and is outlined by a white dotted line in B. MV measures were based on the contractile muscle measured in the muscle bundle, corresponding to the red region of interest in B.
(A) Proton-density weighted scans are segmented into three volumetric regions. (B) Each slice of the proton-density weighted scan is segmented into muscle (red), inter/intra-muscular fat (green, i.e, smaller segments shown amidst the red) and subcutaneous fat (magenta; area outside the white dotted line). The white dotted line represents the regions used for the fat fraction map and the T2-mapping analysis comprising the entire muscle bundle. (C) Fat fraction; map was acquired using a Dixon imaging sequence. (D) T2-map for the same subject. Healthy muscle tissue will have lower T2 relaxation times.
In order to account for the progressive fatty infiltration into the muscle bundle, MVI was also evaluated. MVI is a measure of the fraction of the total thigh tissue that is lean muscle [Citation17] and is calculated using the following formula (EquationEquation 1(Eq. 1) ):
(Eq. 1)
Fat fraction maps were generated from the water-fat images acquired during the Dixon imaging protocol. The fat fraction map was calculated using the following formula (EquationEquation 2(Eq. 2) ):
(Eq. 2)
The muscle and inter/intra-muscular fat regions, comprising the entire muscle bundle, were used to derive the thigh fat fraction measurement from the fat fraction maps (C).
The T2 relaxation time was calculated on a pixel-by-pixel basis from the multi-echo T2-mapping scan using a non-linear curve fit assuming a mono-exponential decay model [Citation14,Citation28,Citation29]. As was done in previous work, the initial echo time was not included in the curve fit in order to minimize the effect of stimulated echoes on T2 calculation [Citation28]. The T2-map was acquired covering fewer slices in the proximal thigh and used the muscle and inter/intra-muscular fat regions of interest (i.e., muscle bundle) for analysis (D). T2-maps were evaluated in two ways: mean T2-relaxation time and percent of nonelevated voxels. The percent of nonelevated voxels was the percent of total voxels in the T2-mapping acquisition with a relaxation time of less than 55 ms. Voxels with an elevated T2-relaxation time are more likely to represent fatty or inflamed tissue [Citation14,Citation29]. The threshold of 55 ms was estimated based on review of healthy volunteer scans in combination with the thresholds described in previous work [Citation14,Citation29]. It is acknowledged that the threshold of 55 ms is elevated above healthy muscle tissue, and that is consistent with the intended use. The threshold was established to allow longitudinal evaluation of shifts in T2-mapping histograms consistent with DMD disease progression and was not established as a definitive threshold between healthy and diseased tissue.
Statistical analysis
Pearson correlation coefficients were calculated between imaging tests, functional tests and patient age. Tests were considered moderately correlated if |r| approximately 0.5. All functional test data, except for the 6-min-walk distance test and NSAA, had right-skewed data distributions and therefore the data were log transformed to be more normally distributed for statistical analysis.
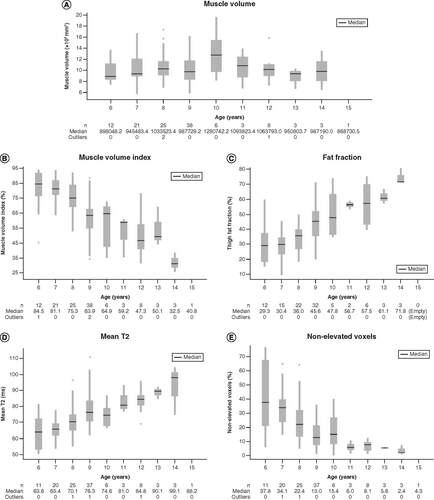
In some cases, sites were not able to perform the fat fraction or T2-mapping acquisitions due to scanner technical limitations. In these cases, only the available data were used for correlation analysis. The number of patients used for each comparison are included in .
(A) Muscle volume; (B) muscle volume index; (C) fat fraction; (D) mean T2 relaxation and (E) percent nonelevated voxels. The box shows the median value, upper quartile and lower quartile. Whiskers represent upper and lower adjacent values. Dots represent outliers.
Results
The study enrolled 121 ambulatory boys, aged 6 to <16 years. One patient who was randomized, however, did not complete the baseline MRI and therefore was omitted from this analysis (n = 120). All images were acquired without the use of sedatives. The correlation coefficients and their statistical significances between the primary imaging measures, functional assessments and patient age are presented in . Of the imaging measures, MV had the weakest correlations to timed functional assessments and NSAA and had no apparent correlation to patient age (A & ). On the other hand, MV had the strongest correlation with the knee extension/strength assessments (). MVI had a moderate correlation to timed functional tests, NSAA and patient age, but was only weakly correlated to the knee extension strength assessments (). MVI declined with age (B).
*p < 0.001; **0.001 ≤ p < 0.05.
MVI: Muscle volume index; NSAA: North Star Ambulatory Assessment.
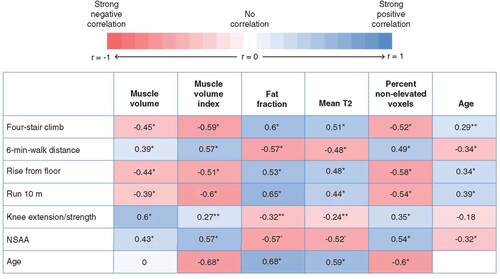
Fat fraction was moderately correlated to timed functional tests, NSAA and patient age, but had a weaker correlation with the knee extension strength assessments (C & ). Fat fraction on average showed the highest observed correlation with timed functional tests compared with the other imaging measures. T2-mapping measures, including the mean T2 relaxation time and percent nonelevated voxels similarly showed a moderate correlation to timed functional tests, NSAA and patient age (D & E), and had weaker correlations with the knee extension/strength assessments (). Timed functional tests, strength assessments and NSAA had either weak or weak/moderate correlation with patient age ( & ).
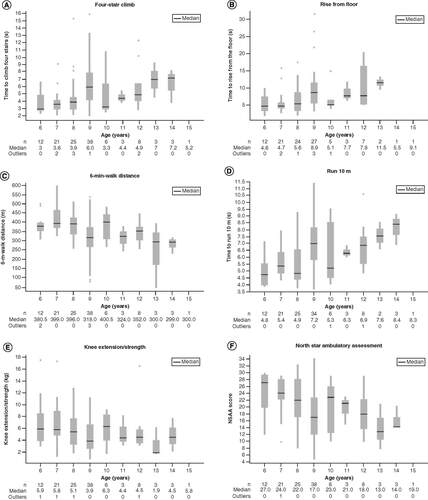
(A) Four-stair climb; (B) rise from floor; (C) 6-min-walk distance; (D) run 10 m; (E) knee extension/strength; and (F) NSAA. The box shows the median value, upper quartile, and lower quartile. Whiskers represent upper and lower adjacent values. Dots represent outliers.
NSAA: North Star Ambulatory Assessment.
Discussion
In this multicenter, multinational clinical trial, imaging was well tolerated by the study participants and all images were acquired without the use of sedatives. These analyses showed generally moderate correlation between several baseline quantitative MRI measures and functional tests in patients with DMD. This is the first study to analyze the entire thigh, rather than small regions in individual muscle groups. Importantly, this work provides data on whole-thigh MV, rather than focusing on a cross-sectional area in a few central slices.
The results of this study provide further support for the use of imaging as an objective, noninvasive biomarker for use in DMD clinical trials. Furthermore, this multicenter study shows that imaging protocols can be generalized to enable inclusion into later phase (i.e., Phase II/III) clinical trials, and imaging analysis can be scaled to have the high throughput necessary for clinical trials.
Correlation between imaging measures & functional tests
Except for MV, imaging measures (MVI, fat fraction and T2-mapping) were moderately correlated with the timed functional tests, NSAA and patient age. This is in agreement with findings from previous studies showing correlation between imaging and functional tests in patients with DMD. Several studies have shown correlations between muscle fat fraction and/or T2-mapping and functional tests, including four-stair climb, rise from the floor, run 10 m and 6-min-walk distance test [Citation14–16,Citation18,Citation19]. Correlations were also found between MVI and functional tests, including run 10 m and 6-min-walk distance test [Citation17].
Interestingly, MV measures did not correlate as well with timed functional tests; however, it did correlate with the knee extension/strength measurement. The finding that MV is correlated with strength is aligned with a previous report looking at muscle cross-sectional area in patients with DMD and age-matched controls [Citation30]. This previous study evaluated the contractile cross-sectional area in a single slice in the thigh and demonstrated a correlation with strength measurements. The combined conclusion between this work and previous work demonstrates that both whole-thigh MV and single-slice contractile cross-sectional area correlate with strength measures in DMD patients.
MVI, fat fraction and T2-mapping measures overall correlated with timed functional tests and NSAA, but only correlated weakly with knee extension/strength measurements. These findings suggest that lean MV may be an important indicator of overall strength, whereas measures evaluating muscle quality or measures affected by the quantity of fatty tissues (MVI, fat fraction or T2-mapping) may be more important for characterizing potential functional changes on timed functional tests or functional scores.
Correlation between imaging measures or functional assessments & patient age
In this study, MV did not show a clear trend of increasing with age in boys with DMD, as may be anticipated in a growing child. This finding is particularly interesting when keeping in mind that the MV captured the entire thighs of boys. The number of slices acquired and evaluated was dependent on the patient height (i.e., taller boys had more slices evaluated). Despite the extra slices in the MRI scan, the MV did not increase appreciably in older, typically taller, boys. This finding is in agreement with a previous study that found no significant correlation between single-slice contractile cross-sectional area and age in young boys with DMD, whereas healthy boys had a significant increase in cross-sectional area with age [Citation30].
The lack of correlation between whole-thigh MV and age may be explained by the competing effects of linear growth with progressive fatty replacement and muscle atrophy in a DMD population. Muscle hypertrophy may also play a role in the relative stabilization of MV measures across the age range evaluated, although this effect may be less pronounced in thigh measurements relative to lower-leg measures [Citation30]. Given the lack of correlation between MV and age, measuring MV in boys with DMD could be useful for designing future imaging measures in this population. During longitudinal analysis of clinical trial results, an increase in MV could indicate a true therapeutic effect rather than an age-related change. This could be an important consideration when evaluating clinical trial data for a potential anabolic effect.
Our results showed that MVI declined with age. This is consistent with previously published results showing MVI of the lower limbs was significantly lower in boys with DMD compared with healthy boys, and that decreases in thigh MVI were significantly correlated with age [Citation17]. Fat fraction analysis of the entire thigh muscle bundle in this study showed a moderate correlation with patient age. Increased fat fraction with age has been demonstrated in several other studies using both Dixon imaging and magnetic resonance spectroscopy assessments in individual muscle groups [Citation28,Citation31,Citation32]. T2-mapping measures in this study also indicated moderate correlation to patient age. Looking at both mean T2 and percent of elevated/nonelevated voxels may be particularly important in longitudinal studies to understand not only the changes in the mean T2 value, but to also characterize the spread of T2 values within the muscle bundle. Other studies have shown a correlation between T2-mapping and age in patients with DMD, in addition to showing that distribution of T2 values increases with disease progression and elevated voxels may be sensitive to longitudinal changes in boys with DMD [Citation14,Citation32–34].
Functional tests showed an overall weaker correlation with patient age. Mean functional performance in different age groups () showed a reduced rate of change across the age groups as compared with MVI, fat fraction or T2-mapping analyses. In addition, 6-min-walk distance test performance appears to increase up to approximately ages 7–8 years before a functional decline is initially observed. A similar observation, with a peak in 6-min-walk distance, has been noted in several previous studies [Citation26,Citation27]. This lack of functional decline in this age range would need to be a consideration when planning a study with functional end points. Taken together, our findings further support the use of MVI, fat fraction analysis and T2-mapping to measure disease progress in patients with DMD. MV may be an additional biomarker of interest to help quantify changes in strength or evaluate the pharmacologic effect based on the mechanism of action of a potential therapy.
A study by Willcocks and colleagues further highlights the importance of reviewing both imaging and functional data to characterize disease progression in DMD. Although the 6-min-walk distance test showed improvement or stabilization over 1 year in patients with DMD, progressive increases were identified in fat fractions and T2-mapping [Citation35]. This further underscores the importance of using imaging biomarkers, which can detect changes in muscle structure or quality before functional changes are observed. MRI and magnetic resonance spectroscopy have demonstrated the ability to detect a therapeutic effect following initiation of corticosteroids [Citation36]. Although previous interventional studies had very small sample sizes, it is generally hypothesized that imaging may be able to detect subclinical disease progression in advance of changes in functional performance. Furthermore, quantitative MRI measures may be more sensitive than functional measures in tracking disease progression [Citation23].
It should be noted that this study had several limitations. This study could have been enhanced by the addition of a control non-DMD population. While this would have increased the understanding of the manifestation of DMD, it was outside the scope of this study. Other studies showing correlations between quantitative MRI and functional performance evaluated individual muscle groups due to the potential for nonhomogenous disease progression across all thigh muscle [Citation14,Citation15]. It is understood that the analysis of the entire muscle bundle may lead to a lower correlation coefficient between imaging and functional performance due to variation in thigh muscle involvement. Individual muscle analysis would likely require manual segmentation, which is less scalable for large clinical studies. In addition, due to the large number of sites (31) in this study, MRI scanner capabilities varied slightly among sites. This study reflects the normal variations that may occur when scaling up quantitative MRI end points into interventional clinical studies across multiple sites. The slight variations in scan acquisition may contribute to increased variability of these measures; however, this is a challenge that will need to be considered before incorporating imaging into multicenter clinical trials. This impact can be minimized in longitudinal studies by having baseline and follow-up scans on the same MRI equipment for each subject.
Lastly, a notable limitation, is that this was a cross-sectional analysis based on values from one baseline time point that could have been affected by various factors leading up to this time point. Longitudinal data were not fully available at the time of this analysis. Initial publication of the domagrozumab Phase II trial did not report a significant treatment effect based on function, however, as discussed in the corrigendum there was a significant treatment effect detected by MRI [Citation24,Citation37]. There was a significant difference between domagrozumab and placebo in the mean percentage change from baseline in thigh MV at week 17 (2.945%, p = 0.0087) and week 49 (4.087%, p = 0.0298), and in MVI at week 33 (2.612%, p = 0.0376) and week 49 (3.208%, p = 0.0411) [Citation37]. This did not alter the overall conclusions of the trial and future publication of the longitudinal MRI of T2-mapping and fat fraction data is planned. The significant treatment effect detected on MV measures as part of the domagrozumab study underscores the importance of understanding the relationship of these MRI biomarkers with functional measures and patient age.
A particular strength of this study is that data were collected from 31 sites across eight countries. Although other studies have demonstrated correlations between imaging measures, functional tests and DMD patient age [Citation28], these studies were run at a small number of sites selected specifically for imaging capabilities. This study is the largest interventional clinical study to include these types of quantitative MRI assessments and demonstrates the feasibility to scale image acquisition protocols across different MRI scanners and streamline image analysis techniques. Scalable image acquisition and analysis protocols are critical to the future implementation of quantitative MRI biomarkers in clinical trials.
In order to improve clinical trial design and increase the chance of identifying a potential therapy for DMD, new biomarkers are needed that enable objective decision making and do not rely on patient collaboration. The greater rate of change of imaging assessments as opposed to functional changes across ages 6–15 supports the use of imaging evaluation to detect subclinical changes in this population. Finally, the generally moderate correlation between the MRI assessments and functional performance provides additional evidence on the utility of these measures to assess efficacy outcomes in clinical trials.
Conclusion
This study demonstrates that quantitative MRI measures can be incorporated in multicenter, multinational clinical trials. MV correlated with strength measurements, whereas all other imaging measures correlated best with timed functional tests and patient age. This study suggests that MV may be a better indicator of overall strength, and muscle quality/fat content may be a better biomarker for performance on timed functional tests and NSAA. The overall moderate correlation between an array of functional tests and several MRI measures provides further evidence of the utility of MRI as an objective biomarker for future clinical trials.
There is an unmet need for objective outcome measures in Duchenne muscular dystrophy (DMD) that represent the underlying pathophysiology, disease progression and treatment effects.
We developed a scalable quantitative MRI protocol that can be used for multicenter clinical trials for objective assessment of thigh muscle volume (MV), muscle volume index, T2-relaxation time and whole thigh fat fraction analysis.
We used baseline data from a Phase II trial of domagrozumab in DMD to evaluate the correlation between functional measures and quantitative MRI assessments of thigh muscle.
This study is the first analysis of whole-thigh MV in boys with DMD. MV was weakly correlated to most timed functional tests and age, however, was moderately correlated with strength assessments.
Muscle volume index, a measure of the fraction of total thigh tissue that is lean muscle, whole thigh fat fraction and T2-mapping measures all had moderate correlations to timed functional tests, North Star Ambulatory Assessment and age.
These findings suggest that muscle quality and fat content measures may be better biomarkers for performance on timed functional tests and North Star Ambulatory Assessment; the whole MV may be more strongly associated with strength measures.
The rate of change of MRI biomarkers across ages was greater than that observed on functional end points suggesting that imaging may be able to detect subclinical disease in boys with DMD.
These results demonstrate the feasibility of using MRI in a large, multicenter study and support continued use of MRI as an objective biomarker for DMD clinical trials.
Author contributions
M Binks, SP Sherlock, S Marraffino contributed in study concept and design; SP Sherlock, S Marraffino contributed in acquisition of data; statistical analysis was performed by Y Zhang and SP Sherlock; all authors contributed to the analysis and interpretation of data, drafting of the manuscript, critical revision of the manuscript for important intellectual content and approval of the final draft.
Ethical conduct of research
The study protocol, protocol amendments, and informed consent/assent forms were approved by institutional review board or ethics committee. The study was conducted in accordance with legal and regulatory requirements, international ethical guidelines for biomedical research involving human subjects, Good Clinical Practices, and the Declaration of Helsinki. Written informed consent by parent or legal guardian, and the patient's assent when applicable, were obtained before any study-specific activity was performed.
Data sharing statement
Upon request, and subject to certain criteria, conditions and exceptions (see https://www.pfizer.com/science/clinical-trials/trial-data-and-results for more information), Pfizer will provide access to individual de-identified participant data from Pfizer-sponsored global interventional clinical studies conducted for medicines, vaccines and medical devices for indications that have been approved in the US and/or EU or in programs that have been terminated (i.e., development for all indications has been discontinued). Pfizer will also consider requests for the protocol, data dictionary, and statistical analysis plan. Data may be requested from Pfizer trials 24 months after study completion. The de-identified participant data will be made available to researchers whose proposals meet the research criteria and other conditions, and for which an exception does not apply, via a secure portal. To gain access, data requestors must enter into a data access agreement with Pfizer.
Acknowledgements
The authors thank the participating patients and their families and all the site investigators and their staff for their commitment to this trial. The authors also thank the entire Pfizer domagrozumab team as well as the physiotherapists (ATOM) who enabled the training and functional assessment protocol and VirtualScopics/Biotelemetry Research for image analysis support.
Financial & competing interests disclosure
This study was sponsored by Pfizer. SP Sherlock, Y Zhang, M Binks and S Marraffino are employees of and own stock in Pfizer. The authors have no other relevant affiliations or financial involvement with any organization or entity with a financial interest in or financial conflict with the subject matter or materials discussed in the manuscript apart from those disclosed.
Medical writing support was provided by V Dror of Engage Scientific Solutions, and funded by Pfizer.
Additional information
Funding
References
- Ryder S , LeadleyRM, ArmstrongNet al. The burden, epidemiology, costs and treatment for Duchenne muscular dystrophy: an evidence review. Orphanet. J. Rare Dis.12(1), 79 (2017).
- Venugopal V , PavlakisS. Duchenne muscular dystrophy.StatPearls LLC, Treasure Island, FL, USA (2018).
- Landfeldt E , ThompsonR, SejersenT, McMillanHJ, KirschnerJ, LochmullerH. Life expectancy at birth in Duchenne muscular dystrophy: a systematic review and meta-analysis. Eur. J. Epidemiol.35(7), 643–653 (2020).
- Goemans N , vanden Hauwe M, WilsonR, van ImpeA, KlingelsK, BuyseG. Ambulatory capacity and disease progression as measured by the 6-min-walk-distance in Duchenne muscular dystrophy subjects on daily corticosteroids. Neuromuscul. Disord.23(8), 618–623 (2013).
- Pane M , MazzoneES, SormaniMPet al. 6 minute walk test in Duchenne MD patients with different mutations: 12 month changes. PLoS ONE9(1), e83400 (2014).
- Akima H , LottD, SenesacCet al. Relationships of thigh muscle contractile and non-contractile tissue with function, strength, and age in boys with Duchenne muscular dystrophy. Neuromuscul. Disord.22(1), 16–25 (2012).
- Marden FA , ConnollyAM, SiegelMJ, RubinDA. Compositional analysis of muscle in boys with Duchenne muscular dystrophy using MR imaging. Skeletal Radiol.34(3), 140–148 (2005).
- Mathur S , LottDJ, SenesacCet al. Age-related differences in lower-limb muscle cross-sectional area and torque production in boys with Duchenne muscular dystrophy. Arch. Phys. Med. Rehabil.91(7), 1051–1058 (2010).
- Mercuri E , PichiecchioA, AllsopJ, MessinaS, PaneM, MuntoniF. Muscle MRI in inherited neuromuscular disorders: past, present, and future. J. Magn. Reson. Imaging25(2), 433–440 (2007).
- Wren TA , BlumlS, Tseng-OngL, GilsanzV. Three-point technique of fat quantification of muscle tissue as a marker of disease progression in Duchenne muscular dystrophy: preliminary study. AJR Am. J. Roentgenol.190(1), W8–W12 (2008).
- Guiraud S , DaviesKE. Pharmacological advances for treatment in Duchenne muscular dystrophy. Curr. Opin. Pharmacol.34, 36–48 (2017).
- Hollingsworth KG , GarroodP, EagleM, BushbyK, StraubV. Magnetic resonance imaging in Duchenne muscular dystrophy: longitudinal assessment of natural history over 18 months. Muscle Nerve48(4), 586–588 (2013).
- Ricotti V , EvansMR, SinclairCDet al. Upper limb evaluation in duchenne muscular dystrophy: fat-water quantification by MRI, muscle force and function define endpoints for clinical trials. PLoS ONE11(9), e0162542 (2016).
- Arpan I , ForbesSC, LottDJet al. T2 mapping provides multiple approaches for the characterization of muscle involvement in neuromuscular diseases: a cross-sectional study of lower leg muscles in 5–15-year-old boys with Duchenne muscular dystrophy. NMR Biomed.26(3), 320–328 (2013).
- Barnard AM , WillcocksRJ, FinangerELet al. Skeletal muscle magnetic resonance biomarkers correlate with function and sentinel events in Duchenne muscular dystrophy. PLoS ONE13(3), e0194283 (2018).
- Gaeta M , MessinaS, MiletoAet al. Muscle fat-fraction and mapping in Duchenne muscular dystrophy: evaluation of disease distribution and correlation with clinical assessments. Preliminary experience. Skeletal Radiol.41(8), 955–961 (2012).
- Godi C , AmbrosiA, NicastroFet al. Longitudinal MRI quantification of muscle degeneration in Duchenne muscular dystrophy. Ann. Clin. Transl. Neurol.3(8), 607–622 (2016).
- Mankodi A , BishopCA, AuhS, NewbouldRD, FischbeckKH, JaniczekRL. Quantifying disease activity in fatty-infiltrated skeletal muscle by IDEAL-CPMG in Duchenne muscular dystrophy. Neuromuscul. Disord.26(10), 650–658 (2016).
- Schmidt S , HafnerP, KleinAet al. Timed function tests, motor function measure, and quantitative thigh muscle MRI in ambulant children with Duchenne muscular dystrophy: a cross-sectional analysis. Neuromuscul. Disord.28(1), 16–23 (2018).
- Ropars J , GravotF, BenSalem D, RousseauF, BrochardS, PonsC. Muscle MRI: a biomarker of disease severity in Duchenne muscular dystrophy? A systematic review. Neurology94(3), 117–133 (2020).
- Barnard AM , WillcocksRJ, TriplettWTet al. MR biomarkers predict clinical function in Duchenne muscular dystrophy. Neurology94(9), e897–e909 (2020).
- Naarding KJ , ReyngoudtH, van ZwetEWet al. MRI vastus lateralis fat fraction predicts loss of ambulation in Duchenne muscular dystrophy. Neurology94(13), e1386–e1394 (2020).
- Nagy S , SchadelinS, HafnerPet al. Longitudinal reliability of outcome measures in patients with Duchenne muscular dystrophy. Muscle Nerve61(1), 63–68 (2020).
- Wagner KR , Abdel-HamidHZ, MahJKet al. Randomized Phase II trial and open-label extension of domagrozumab in Duchenne muscular dystrophy. Neuromuscul. Disord.30(6), 492–502 (2020).
- Cai W , ChenS, ZhangD. Fast and robust fuzzy c-means clustering algorithms incorporating local information for image segmentation. Pattern Recognition40(3), 825–838 (2007).
- Positano V , ChristiansenT, SantarelliMF, RinggaardS, LandiniL, GastaldelliA. Accurate segmentation of subcutaneous and intermuscular adipose tissue from MR images of the thigh. J. Magn. Reson. Imaging29(3), 677–684 (2009).
- Xu C , PrinceJL. Snakes, shapes, and gradient vector flow. IEEE Trans. Image Process7(3), 359–369 (1998).
- Forbes SC , WillcocksRJ, TriplettWTet al. Magnetic resonance imaging and spectroscopy assessment of lower extremity skeletal muscles in boys with Duchenne muscular dystrophy: a multicenter cross sectional study. PLoS ONE9(9), e106435 (2014).
- Willcocks RJ , ArpanIA, ForbesSCet al. Longitudinal measurements of MRI-T2 in boys with Duchenne muscular dystrophy: effects of age and disease progression. Neuromuscul. Disord.24(5), 393–401 (2014).
- Wokke BH , vanden Bergen JC, VersluisMJet al. Quantitative MRI and strength measurements in the assessment of muscle quality in Duchenne muscular dystrophy. Neuromuscul. Disord.24(5), 409–416 (2014).
- Bonati U , HafnerP, SchadelinSet al. Quantitative muscle MRI: a powerful surrogate outcome measure in Duchenne muscular dystrophy. Neuromuscul. Disord.25(9), 679–685 (2015).
- Kim HK , SeraiS, LindquistDet al. Quantitative skeletal muscle MRI: part 2, MR spectroscopy and T2 relaxation time mapping-comparison between boys with Duchenne muscular dystrophy and healthy boys. AJR Am. J. Roentgenol.205(2), W216–W223 (2015).
- Kim HK , LaorT, HornPS, RacadioJM, WongB, DardzinskiBJ. T2 mapping in Duchenne muscular dystrophy: distribution of disease activity and correlation with clinical assessments. Radiology255(3), 899–908 (2010).
- Johnston JH , KimHK, MerrowACet al. Quantitative skeletal muscle MRI: part 1, derived T2 fat map in differentiation between boys with Duchenne muscular dystrophy and healthy boys. AJR Am. J. Roentgenol.205(2), W207–W215 (2015).
- Willcocks RJ , RooneyWD, TriplettWTet al. Multicenter prospective longitudinal study of magnetic resonance biomarkers in a large duchenne muscular dystrophy cohort. Ann. Neurol.79(4), 535–547 (2016).
- Arpan I , WillcocksRJ, ForbesSCet al. Examination of effects of corticosteroids on skeletal muscles of boys with DMD using MRI and MRS. Neurology83(11), 974–980 (2014).
- Wagner KR , Abdel-HamidHZ, MahJKet al. Corrigendum to “Randomized Phase II trial and open-label extension of domagrozumab in Duchenne muscular dystrophy” [Neuromuscular Disorders, Vol. 30 (6) 2020, 492–502]. Neuromuscul. Disord. doi:10.1016/j.nmd.2021.01.001 (2021) ( Epub ahead of print).