
Abstract
Aim: To evaluate whether PRAMEF12 can serve as a diagnostic biomarker for glioma. Methods: We examined PRAMEF12 expression in multiple normal and glioma tissues. The diagnostic value of PRAMEF12 was evaluated using receiver operating characteristic curve analysis. The effect of PRAMEF12 ablation on proliferation, cell cycle and apoptosis was investigated. Database analyses were utilized for functional enrichment analysis. Results: PRAMEF12 expression in normal tissue was restricted to the human testis. PRAMEF12 displayed significant diagnostic value in glioma. PRAMEF12 knockdown inhibited cell proliferation, induced apoptosis and resulted in induction of S-phase cell cycle arrest. Pathway enrichment analysis indicated that PRAMEF12 may participate in cancer. Conclusion: PRAMEF12, a novel cancer/testis gene, may be a potential new diagnostic biomarker for glioma.
PRAMEF12 is a novel cancer/testis gene.
PRAMEF12 protein expression was demonstrated in 163 (84.9%) of 192 glioma specimens.
PRAMEF12 displayed significant diagnostic value for glioma.
PRAMEF12 gene silencing suppresses cell proliferation and induces cell apoptosis in glioma cell lines.
PRAMEF12 gene silencing resulted in induction of S-phase cell cycle arrest.
The pathway enrichment analysis results indicate that PRAMEF12 may participate in the progress of spermatogenesis and cancer.
Glioma is the most common and malignant primary tumor type of the central nervous system. Despite recent advances in surgical, radiotherapeutic and chemotherapeutic management, the prognosis of patients with malignant glioma remains unfavorable, with a median survival of 14.6 months [Citation1]. Conventional therapy can often result in debilitating cognitive and neurological deficits. To improve the management of glioma, it is necessary to explore additional novel tumor markers and therapeutic targets. Of these, the development of immunotherapy specifically targeting malignant cells is potentially an effective and specific approach to improve tumor prognosis [Citation2,Citation3].
The discovery of tumor antigens provides a novel approach to precise tumor-targeted treatments. Cancer/testis antigens (CTAs) are tumor antigens that have been implicated as ideal potential biomarkers for tumor diagnosis and targets for oncology therapy [Citation4,Citation5]. More than 200 distinct CTA genes have been cataloged [Citation6]. These genes have been investigated in a wide variety of tumors. Several CTAs, in particular MAGE-A3 and NY-ESO-1, have recently been studied as target antigens in vaccine clinical trials for many cancer types [Citation7], including malignant glioma [Citation8], with the potential goal of identifying specific markers to monitor the immune responses of these patients.
PRAME is one of the most immunogenic CTAs discovered thus far. It appears to be an accurate biomarker for metastasis in tumors [Citation9,Citation10] and an attractive potential immunotherapy target [Citation11]. More than 40 CTA families have been identified, including MAGE, SSX and NY-ESO-1 [Citation12,Citation13]. PRAMEF12 is located on chromosome 1p36.21 and encodes a 483-amino acid protein. However, to the best of our knowledge, little has been reported regarding the properties and function of PRAMEF12 in the literature.
In the present study, we examined the expression profile of PRAMEF12 in multiple normal tissues and glioma tissues, explored its role in glioma and evaluated whether PRAMEF12 can serve as a diagnostic or prognostic biomarker for patients with glioma. In addition, we analyzed the biological functions and molecular mechanisms of PRAMEF12 in low-grade glioma (LGG) and glioblastoma (GBM) through bioinformatics analysis.
Materials & methods
Cell lines
U-251 MG, U-87 MG (HTB-14), U-118 MG (HTB-15) and A-172 human glioma cell lines were purchased from the American Type Culture Collection (VA, USA). U-87 (HTB-14) is most probably a GBM cell line but its origin is unknown. U-118 MG (HTB-15) cell line had been authenticated using its short tandem repeat profile. All cells were maintained in a humidified incubator at 37 °C in an atmosphere of 5% CO2 and cultured in the presence of 10% fetal bovine serum (Biological Industries, Kibbutz Beit-Haemek, Israel).
Total RNA extraction & cDNA synthesis
Total RNA extraction and cDNA synthesis were performed as previously reported [Citation14]. Briefly, total RNA from normal tissues of the testis, esophagus, stomach, small intestine, colon, liver, pancreas, kidney, prostate, adrenal gland, uterus, breast, ovary, bronchus, lung, heart, cerebellum, cerebrum, lymph node, skin and spleen were purchased from TaKaRa Bio Co., Ltd. (Dalian, China). RNA from cancer cell lines was isolated using RNAiso plus (TaKaRa Bio) according to the manufacturer’s protocol. After eliminating genomic DNA using gDNA Wipeout Buffer, the total RNA was reverse-transcribed into single-stranded cDNA in 20 μl reaction buffer using the QuantiTect Reverse Transcription Kit (Qiagen GmbH, Hilden, Germany).
Reverse transcription by RT-PCR
RT-PCR was performed as previously reported [Citation14]. Forward and reverse oligonucleotide primers specific to PRAMEF12 and GAPDH were designed using Primer Express v. 3.0 software (Thermo Fisher Scientific, MA, USA). The cDNA was amplified via PCR using the following primers: PRAMEF12 forward, 5′-TGCATTCCCCTAGACAGGAAG-3′; PRAMEF12 reverse, 5′-GGCATTCGGTCATTACGACTG-3′; GAPDH forward, 5′-AGAAGGCTGGGGCTCATTTG-3′; GAPDH reverse, 5′-AGGGGCCATCCACAGTCTTC-3′. Subsequently, 35 amplification cycles (one precycle step at 95 °C for 5 min; 35 cycles of denaturation at 95 °C for 30 s, annealing at 58 °C for 30 s and extension at 72 °C for 45 s; with a final extension at 72 °C for 10 min) were performed for each sample. The PCR products were visualized as bands on ethidium bromide-stained 1.5% agarose gels under ultraviolet light.
Quantitation by qRT-PCR
qRT-PCR was performed to determine mRNA expression using SYBR® Premix Ex Taq (TaKaRa Bio), with GAPDH as an internal control. Amplification was performed using a QuantStudio™ Dx System (Applied Biosystems, Monza, Italy). All reactions were conducted in duplicate. The relative mRNA expression levels of PRAMEF12 were identified based on the comparative threshold cycle method.
Immunohistochemical staining
A paraffin-embedded human testis tissue microarray (TMA; #TEN241) and a glioma TMA (#GL2083a) were purchased from US Biomax, Inc. (Xi'an, China) and analyzed using immunohistochemistry. The glioma TMA included 117 males and 75 females (median age: 45 years; range: 9–73 years). All TMA specimens were divided into two groups (grade I–II and grade III–IV) according to the WHO classification [Citation15,Citation16]. However, US Biomax could not provide the molecular data of GL2083a. All of the TMAs were deparaffinized in xylene and rehydrated in a descending series of ethanol (100, 95, 85 and 80%) and washed in phosphate-buffered saline (PBS). Thermal antigen retrieval was carried out in boiling citrate buffer (2 mM citric acid, 10 mM sodium citrate, pH 6.0) for 15 min. Endogenous peroxidase activity of the sections was quenched by incubation with 3% hydrogen peroxide for 20 min at room temperature. To block nonspecific binding, the sections were incubated in 10% goat serum for 1 h at room temperature and then incubated with the anti-PRAMEF12 primary antibody (dilution 1:200; #HPA045286; Sigma-Aldrich, Merck Millipore, Darmstadt, Germany) overnight at 4 °C. Following incubation with a biotin-labeled goat anti-rabbit antibody for 1 h at room temperature, they were incubated with an avidin–biotin complex system (ABC Elite; Vector Laboratories, CA, USA). Subsequently, diaminobenzidine was added to the final reaction products for 10 min or until a color change was observed using a microscope. The samples were subsequently counterstained with hematoxylin. In the negative control sample for immunohistochemical staining, the anti-PRAMEF12 primary antibody was replaced with a control IgG (dilution 1:500; ab172730; Abcam, Cambridge, UK).
Evaluation of immunostaining
The degree of immunostaining was evaluated and scored by two pathologists. Brown staining in the nuclei indicated positive expression of PRAMEF12. The proportion of immunopositive tumor cells was scored as follows: 0, no staining; 1, ≤30%; 2, 31–60%; and 3, 61–100%. Staining was considered to be absent if no or few tumor cells were present (<30 cells).
Immunofluorescence cell staining
Protein subcellular localization of PRAMEF12 in U-251 MG cells was explored using the Human Protein Atlas [Citation17]. For immunofluorescence assays, U-251 MG, U-87 MG, U-118 MG and A-172 cells were seeded on chamber slides at a density of 5 × 10³ cells/coverslip for 24 h prior to staining. After fixing the cells with 4% paraformaldehyde for 20 min, they were permeabilized with 0.5% IGEPAL (Sigma-Aldrich, Merck Millipore) and blocked for 1 h with 5% normal goat serum for processing for immunofluorescence assays. Following blocking, the cells were incubated with a rabbit anti-PRAMEF12 antibody (1:100; Sigma-Aldrich, Merck Millipore). The cells were then incubated with anti-rabbit IgG. After washing, they were treated with 4′,6-diamidino-2-phenylindole for nuclear staining. The immunofluorescence images were merged using Image-Pro® Plus, v. 6.1 (Media Cybernetics, MD, USA).
Transfection for establishing stable cell lines
U-251 MG and U-87 MG cells were transfected with siRNA oligonucleotides using Lipofectamine™ (Invitrogen; Thermo Fisher Scientific, Inc.) 3000 following the manufacturer’s protocol. The siRNA for PRAMEF12 and negative control siRNA (si-NC) was purchased from GenePharma (Shanghai, China). The siRNA sequences were: si-PRAMEF12, 5′-AAGCUUUAAAUAAAUCCACCC-3′ and 5′-GUGGAUUUAUUUAAAGCUUUC-3′. qRT-PCR and western blotting were used to detect the knockdown efficiency.
Cell proliferation assay
After knockdown efficacy was confirmed, cell proliferation rate changes after transfection with specific siRNAs were assessed using the Cell Counting Kit-8 (CCK-8; Dojindo, Kumamoto, Japan) assay. U-251 MG and U-87 MG cells (2 × 10³ cells/well) were plated in 96-well plates. Then, 24 h post-transfection with either PRAMEF12 siRNA or si-NC, 10 μl CCK-8 solution was added to five wells. Cell proliferation rates were analyzed by measuring the absorbance at a wavelength of 450 nm. All experiments were performed in three independent trials.
Cell cycle analysis
Cells were harvested 48 h after transfection with either PRAMEF12 siRNA or si-NC, washed once with PBS and fixed with 75% ethanol overnight at 4 °C. After being treated with RNase for 30 min at room temperature, the cells were stained with propidium iodide (Sigma, MO, USA) and analyzed using a flow cytometer (BD Pharmigen, CA, USA). The cell phase was analyzed using the ModFit LT software.
Cellular apoptosis analysis
Transfected cells were plated at a concentration of 1 × 10⁶ cells/well. After transfection for 48 h, the cells were washed with PBS three times. Cell apoptosis was then evaluated using an annexin V–fluorescein isothiocyanate apoptosis detection kit and propidium iodide (both from Invitrogen, CA, USA) according to the manufacturer’s instructions. The mixed solution was incubated for 15 min at room temperature in the dark. The stained cells were analyzed by flow cytometry using a Navi 105 apparatus (Beckman Coulter, CA, USA) via three experimental repetitions.
Database analyses
The correlation between PRAMEF12 expression and survival in glioma was analyzed using the PrognoScan database (http://dna00.bio.kyutech.ac.jp/PrognoScan/index.html) [Citation18]. LinkedOmics (https://www.proteinatlas.org) was used to obtain genes differentially expressed in correlation with PRAMEF12 in LGG and GBM via the LinkFinder module [Citation19]. A heat map containing the top 50 positively and negatively correlated genes was formed. The protein–protein interaction (PPI) network of PRAMEF12 was predicted using GeneMANIA (https://genemania.org) [Citation20] and STRING (https://www.string-db.org) [Citation21]. Metascape (http://metascape.org) integrates over 40 bioinformatics databases [Citation22] and is a reliable tool for the identification of abundant gene annotation functions, enrichment analysis and PPI network structure analysis. We performed an analysis of a gene list containing the top 50 genes positively and negatively correlated with PRAMEF12 via LinkedOmics, and 20 genes from GeneMANIA and STRING. The Jvenn interactive Venn diagram viewer was used to conduct an intersection analysis to compare the interacting genes of PRAMEF12 in LGG and GBM, and for gene ontology (GO) results of Metascape.
Statistical analyses
The statistical analyses were performed using the SPSS v. 19.0 software package (IBM Corp., NY, USA). Data are expressed as mean ± standard deviation. Immunohistochemical data were analyzed using the χ-square test. Student’s t-test was used to evaluate statistical differences. The diagnostic value of PRAMEF12 in glioma was determined using receiver operating characteristic (ROC) curve analysis using GraphPad Prism software (v. 7; GraphPad, Inc., CA, USA). p < 0.05 was considered to indicate statistical significance.
Results
PRAMEF12 expression in normal tissues
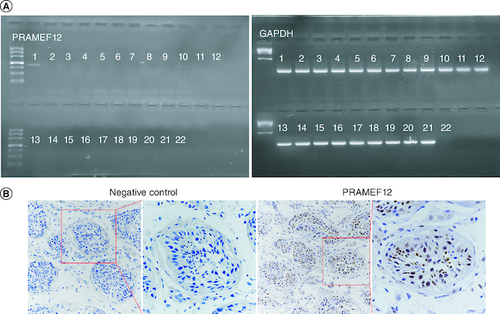
We used the expressed sequence tag database from the National Center for Biotechnology Information (http://www.ncbi.nlm.nih.gov/UniGene/) to initially analyze the expression profile of PRAMEF12 in multiple human tissues. Negative expression was evident in multiple human tissues, including the testis. Further RT-PCR analysis of PRAMEF12 mRNA expression in 21 different normal tissues indicated that PRAMEF12 was strongly expressed in the testis but was undetectable in any of the other tissues (A). This result might have been a false-negative result from the high-throughput expressed sequence tag data. Immunohistochemical staining for PRAMEF12 protein was performed using a human testis TMA. The PRAMEF12 protein was expressed in the nuclei of spermatocytes (B). In contrast, no nonspecific staining was observed when the primary antibody was replaced by a control IgG.
Figure 1. Expression profile of PRAMEF12 in 21 healthy human tissues.
(A) RT-PCR analysis showing PRAMEF12 gene expression in the testis. Lanes: 1, testis; 2, esophagus; 3, stomach; 4, small intestine; 5, colon; 6, liver; 7, pancreas; 8, kidney; 9, prostate; 10, adrenal gland; 11, uterus; 12, breast; 13, ovary; 14, bronchus; 15, lung; 16, heart; 17, cerebellum; 18, cerebrum; 19, lymph node; 20, skin; 21, spleen; 22, water. (B) Nuclear staining of PRAMEF12 was prominent in spermatocytes. Objective: ×20 (inset: ×40).
PRAMEF12 expression in glioma tissues
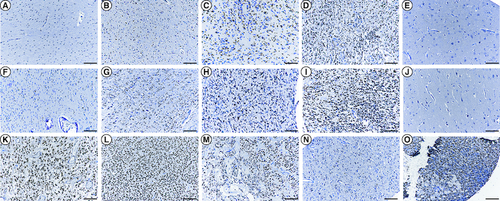
To study the pattern of expression of PRAMEF12 in glioma, immunohistochemical analysis using a TMA was performed. In glioma, PRAMEF12 protein expression was significantly higher than in adjacent normal brain tissues (p = 1.68E-07; ). Overall, nuclear expression of PRAMEF12 was demonstrated in 84.9% (163/192) glioma specimens. Specifically, PRAMEF12 expression was detected in 84.8% (122/132) astrocytoma, 83.9% (26/31) GBM, 100.0% (7/7) not otherwise specified, 100.0% (9/9) oligodendroglioma, 63.6% (7/11) ependymoma, 100.0% (1/1) ganglioglioma and 100.0% (1/1) gliosarcoma tissues (). Immunohistochemical staining revealed that expression of PRAMEF12 was not associated with gender, age or histotype (p = 0.89, p = 0.05 and p = 0.31, respectively; ). Representative images of PRAMEF12 staining ranging from absent to intense are shown in . Only 5/16 adjacent normal brain tissues stained positive for PRAMEF12 protein, with negative staining of the remaining adjacent normal brain tissues (E & J).
Table 1. Correlation between PRAMEF12 expression and clinicopathological characteristics of glioma patients.
Figure 2. Immunocytochemical analysis of PRAMEF12 protein expression in glioma and adjacent normal tissues on a tissue microarray slide.
Immunohistochemical staining of (A–D) astrocytoma tissues, (F–I) glioblastoma tissues, (K) not otherwise specified, (L) oligodendroglioma, (M) ependymoma, (N) ganglioglioma, (O) gliosarcoma and (E & J) the adjacent normal tissues showed a sharp contrast between expression in the normal and tumorous areas. (A & F) Staining score 0: no nuclear staining of tumor cells. (B & G) Staining score 1+: ≤30% nuclear staining of tumor cells. (C & H) Staining score 2+: 31–60% positive nuclear staining. (D & I) Staining score 3+: 61–100% positive nuclear staining. (E & J) Negative PRAMEF12 staining. Scale bar = 50 μm.
Diagnostic & prognostic values of PRAMEF12 in glioma
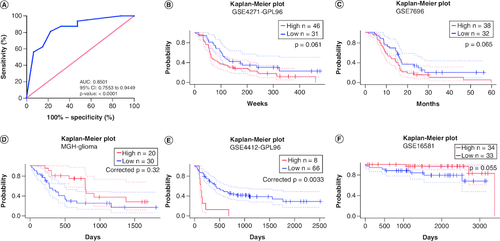
The diagnostic role of PRAMEF12 for patients with glioma was assessed by performing ROC curve analysis using immunohistochemical staining (A). The area under the ROC curve for PRAMEF12 protein was 0.8501. This result indicated that PRAMEF12 could be a predictor for the diagnosis of glioma. The relationships between PRAMEF12 expression and prognosis of glioma in PrognoScan are shown in B–F. High PRAMEF12 expression was associated with poorer prognosis (corrected p = 0.0033) in only one cohort (GSE4412-GPL96).
Figure 3. The diagnostic and prognostic values of PRAMEF12 in glioma.
(A) Receiver operating characteristic analysis of PRAMEF12 protein levels in glioma by immunohistochemical staining. (B–F) Survival curves of overall survival in five glioma cohorts: GSE4271-GPL96 (n = 77), GSE7696 (n = 70), MGH-glioma (n = 50), GSE4412-GPL96 (n = 74) and GSE16581 (n = 67).
PRAMEF12 expression in glioma cell lines
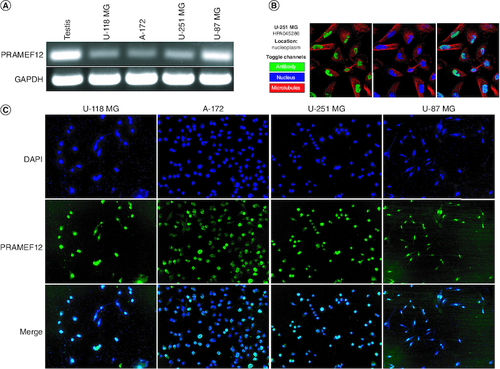
The expression of PRAMEF12 mRNA was also analyzed in the U-118 MG, A-172, U-251 MG and U-87 MG glioma cell lines. RT-PCR revealed that all cells expressed PRAMEF12 mRNA (A). PRAMEF12 protein is mainly localized to the nucleoplasm in the Human Protein Atlas (B). We further examined the localization of PRAMEF12 protein in the four glioma cell lines using an indirect immunofluorescence assay. The glioma cells were fixed, permeabilized and probed with anti-PRAMEF12 antibodies. All four glioma cell lines showed nuclear localization of PRAMEF12 protein (C).
Figure 4. PRAMEF12 expression and localization in glioma cell lines.
(A) RT-PCR analysis showing PRAMEF12 gene expression in the glioma cell lines U-118 MG, A-172, U-251 MG and U-87 MG. (B) PRAMEF12 protein is mainly localized to the nucleoplasm in the Human Protein Atlas. (C) Cells were fixed, permeabilized and processed for indirect immunofluorescence studies, which revealed nuclear localization (green color) of PRAMEF12 protein. Nuclei were stained blue using 4′,6-diamidino-2-phenylindole.
PRAMEF12 affects proliferation, cell cycle & apoptosis of glioma cells
To further explore the effects of PRAMEF12 on cell proliferation and apoptosis, the endogenous expression of PRAMEF12 was knocked down in U-87 MG and U-251 MG cells using a specific si-PRAMEF12. The knockdown efficiency was validated using qRT-PCR and western blot analysis. As shown in A & B, compared with that in the empty vector-transfected control cells, the expression level of PRAMEF12 was significantly downregulated in the si-PRAMEF12-transfected cells. CCK-8 assays were performed to assess the proliferation rates of U-87 MG and U-251 MG cells after silencing of PRAMEF12. In both U-87 MG and U-251 MG cells, si-PRAMEF12 significantly inhibited proliferation compared with si-NC (C).
Figure 5. PRAMEF12 overexpression affected the proliferation, cell cycle and apoptosis of glioma cells.
(A & B) qRT-PCR and western blotting results indicated that specific siRNAs significantly downregulated the mRNA expression levels of PRAMEF12. (C) PRAMEF12 knockdown inhibited proliferation of glioma cells. (D) Cell cycle analysis in lentivirus-infected glioma cells. The relative percentages of U-87 MG and U-251 MG cells at G1, S and G2/M phases were compared. (E) PRAMEF12 knockdown induced apoptosis in U-87 MG and U-251 MG cells. Data are depicted in terms of mean ± standard deviation.
*p < 0.05; **p < 0.01.
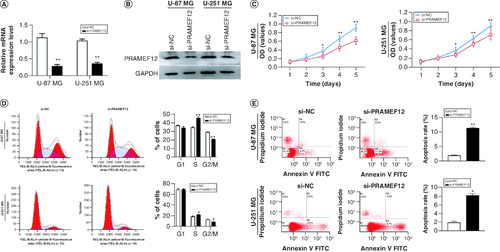
The marked suppression of cell proliferation by si-PRAMEF12 prompted us to evaluate the effects of PRAMEF12 on cell cycle progression. Consistent with the observations on cell proliferation, flow cytometry analysis revealed a significant S-phase cell cycle arrest in si-PRAMEF12 cells compared with si-NC cells (D).
Flow cytometry was also performed to analyze the apoptosis rates of U-87 MG and U-251 MG cell lines after silencing of PRAMEF12. Compared with si-NC cells, the apoptosis rates were significantly increased in the si-PRAMEF12 cells (E). The results confirmed that PRAMEF12 can promote proliferation and inhibit apoptosis in glioma cells in vitro.
Genes coexpressed with PRAMEF12 in LGG & GBM
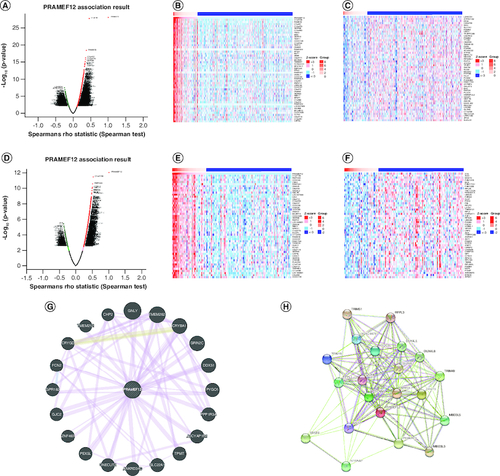
Analysis of differentially expressed genes (DEGs) can contribute to the understanding of the roles of PRAMEF12 in the development and progression of glioma. Correlated genes of PRAMEF12 in LGG or GBM were obtained by the LinkFinder module using the LinkedOmics database, which includes multi-omics data from all 32 cancer types in The Cancer Genome Atlas and ten Clinical Proteomics Tumor Analysis Consortium cancer cohorts. The results are depicted in a volcano plot (A & D). The top 50 positively and negatively DEGs correlated with PRAMEF12 are shown in the heat map (LGG: B & C; GBM: E & F). The PPI networks of PRAMEF12 target genes using GeneMANIA are shown in G, and functional protein association networks of PRAMEF12-correlated genes using STRING are shown in H.
Figure 6. Differentially expressed genes in correlation with PRAMEF12 in low-grade glioma and glioblastoma using the LinkedOmics database.
(A) Volcano plot of Spearman positive and negative association results of PRAMEF12 in LGG. (B & C) Heat maps of the top 50 positively and negatively correlated genes of PRAMEF12 in LGG. (D) Volcano plot of Spearman positive and negative association results of PRAMEF12 in GBM. (E & F) Heat maps of the top 50 positively and negatively correlated genes of PRAMEF12 in GBM. (G) Protein–protein interaction network of PRAMEF12 target genes using GeneMANIA. (H) Functional protein association network of PRAMEF12-correlated genes using STRING.
GBM: Glioblastoma; LGG: Low-grade glioma.
Functional enrichment analysis of PRAMEF12 & its correlated genes in LGG & GBM
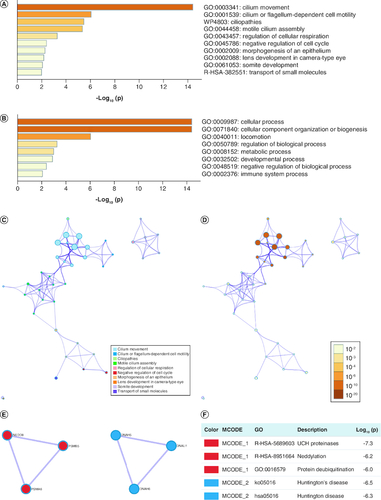
Metascape was utilized for enrichment analysis. Metascape offers a rather unique network analysis capability for PPIs. The functions of PRAMEF12 and its correlated genes (50 positively and negatively correlated genes obtained from LinkedOmics, 20 PRAMEF12 target genes obtained from GeneMANIA and 20 PRAMEF12-correlated genes obtained from STRING) focused mainly on cilium movement, cilium- or flagellum-dependent cell motility, ciliopathies, regulation of cellular respiration, negative regulation of cell cycle and other functions (A, B & Supplementary Table 1). Networks of GO and Kyoto Encyclopedia of Genes and Genomes (KEGG) enriched terms were colored by cluster ID (C) and p-value (D). The PPI network and minimal common oncology data element (MCODE) components are shown in E & F, respectively. PRAMEF12 and its correlated genes were mainly associated with Ub C-terminal hydrolase proteinases, neddylation, protein deubiquitination and Huntington’s disease in LGG.
Figure 7. Functions of PRAMEF12 and genes showing significant association with PRAMEF12 alterations in low-grade glioma (Metascape).
(A) Heat map of the GO and KEGG enriched terms colored by p-values. (B) Heat map of top-level GO biological processes enriched terms colored by p-values. (C) Network of GO and KEGG enriched terms colored by clusters. (D) Network of GO and KEGG enriched terms colored by p-values. (E) The most significant molecular complex detection (MCODE) from the protein–protein interaction network. (F) Functional analysis of MCODE components.
GO: Gene ontology; KEGG: Kyoto Encyclopedia of Genes and Genomes; MCODE: Minimal common oncology data element.
The functions of PRAMEF12 and its correlated genes mostly focused on axoneme assembly, motile cilium assembly, peptide chain elongation, cilium- or flagellum-dependent cell motility, ciliopathies, spermatogenesis, anoikis, negative regulation of Wnt signaling pathway, and other functions (Supplementary Figure 1A, B & Supplementary Table 2). Networks of GO and KEGG enriched terms were colored by cluster ID (Supplementary Figure 1C) and p-value (Supplementary Figure 1D). The PPI network and MCODE components are shown in Supplementary Figure 1E & F, respectively. PRAMEF12 and its correlated genes were mainly associated with peptide chain elongation, eukaryotic translation elongation, viral mRNA translation, axonemal dynein complex assembly, microtubule-based movement and axoneme assembly in GBM.
The intersection analysis results of the top 50 positively and negatively correlated genes of PRAMEF12 between LGG and GBM revealed 24 common members (Supplementary Figure 2A). The other intersection analysis results of Metascape GO results of LGG and GBM revealed 23 common members (Supplementary Figure 2B). The date of access to the databases was December 2022.
Discussion
Gliomas are characterized by high rates of mortality and are the deadliest form of central nervous system tumors [Citation15,Citation16]. The mechanisms underlying local invasion and recurrence in this cancer remain poorly understood, which is a major obstruction in discovering novel therapeutic strategies [Citation23,Citation24]. Accumulating evidence on the underlying molecular mechanisms of glioma is important to identify promising biomarkers for diagnosis or prediction of prognosis, developing efficient therapeutic methods and identifying novel drug targets.
CTAs are a category of tumor-associated antigens. They are aberrantly expressed in different histological types of tumors, but not in healthy tissues, except for testis tissue [Citation4,Citation25]. Because they are expressed in immune-privileged organs, CTAs are considered clinically important biomarkers of cancer and also immunotherapeutic targets [Citation5,Citation26]. An increasing number of CTAs have been identified whose expression is correlated with malignancy [Citation14,Citation27]. However, only a limited number of CTAs in glioma have thus far been confirmed as being causative. Genetic ablation of PRAMEF12 arrests spermatogenesis and results in sterility, confirming that PRAMEF12 plays a key role in maintenance of the spermatogenesis lineage [Citation28]. In the present study, we confirmed that in healthy individuals, PRAMEF12 is predominantly expressed in the testes.
The high frequency of PRAMEF12 protein expression observed in human glioma specimens suggests that PRAMEF12 might be involved in tumorigenesis. Therefore, we conclude that PRAMEF12 is a novel CTA. Moreover, the high frequency of PRAMEF12 expression in patients with glioma is notable compared with that of other promising CTAs. A previous study reported lower expression levels of other CTAs, including MAGE-3 (22%), MAGE-1 (16%) and MAGE family member C1 (CT-7; 11%), in malignant glioma tissues [Citation29]. Another study revealed the frequent expression of various proteins in GBM, including ACTL8 (57%), OIP5 (54%), XAGE3 (44%) and CTCFL (15%) [Citation30]. In contrast, the present study identified PRAMEF12 protein expression in 163/192 (84.9%) glioma tissues, indicating its potential role in tumorigenesis. The diagnostic value analyzed using the ROC analysis implicated PRAMEF12 as a potential diagnostic biomarker for glioma patients. In one cohort, high PRAMEF12 expression was associated with poorer prognosis. However, the positive rate was too low and so it was judged to be a false prognostic biomarker. Therefore more tissue samples are needed to confirm whether it can be used as a diagnostic marker or an independent prognostic factor.
In this study, it was also necessary to evaluate the expression of mRNAs and proteins in glioma cell lines to support a functional role for the differential expression. PRAMEF12 was expressed in all the examined glioma cell lines. In addition to the analysis of mRNA expression, immunofluorescence assays were performed to confirm the localization of PRAMEF12 protein in all glioma cells. We observed nuclear localization of PRAMEF12 in all four glioma cell lines, confirming the result of nuclear localization in the Human Protein Atlas.
To date, the catalog of CTAs comprises more than 200 distinct genes [Citation12]. However, only a small fraction of these genes have been functionally analyzed. In a previous study, melanoma-associated cancer/testis antigen 16 (CT16) was found to be frequently expressed in advanced melanoma, and cell survival was markedly decreased after knockdown of this protein by specific siRNAs [Citation31]. Another study analyzing SPAG9 gene and protein expression revealed SPAG9 expression in 81% of bladder transitional cell carcinoma tissue specimens; SPAG9 gene silencing resulted in G0-G1 arrest of cancer cells and the growth, migration and invasion of these cells in vitro [Citation32]. In addition, RGS22 is overexpressed in low metastatic epithelial cancers and is involved in the processes of cell migration and invasion in esophageal cancer cell lines [Citation33]. The present study showed considerably higher PRAMEF12 expression in glioma than in adjacent normal brain tissues. Knockdown of PRAMEF12 significantly inhibited proliferation while promoting apoptosis in U-87 MG and U-251 MG cells. PRAMEF12 gene silencing in glioma cell lines resulted in significant S-phase cell cycle arrest. Therefore our data demonstrate the malignancy-promoting properties of PRAMEF12 and its putative role in tumorigenesis. Further analyses of cell cycle arrest should be performed to clarify the underlying molecular mechanism. Moreover, this study reports preliminary analysis only. Further studies are needed to validate the gene interactions and signaling pathways.
Genes usually interact with other genes to exert biological functions. GO and KEGG pathway enrichment analyses were performed to better understand the action mechanism of PRAMEF12 and the most frequently altered linked genes. Their functions focused on cellular processes, cellular component organization or biogenesis, locomotion and other functions. According to our results, some pathways deserve closer attention. These include the following: GO:0007283: spermatogenesis; GO:0030178: negative regulation of Wnt signaling pathway; GO:0045786: negative regulation of cell cycle; and hsa05016: Huntington’s disease. A previous study demonstrated that PRAMEF12 plays a key role in maintenance of spermatogenesis [Citation28]. The pathway analysis (ko05016 and hsa05016) followed the previously reported result that PRAMEF12 is one DEG of presymptomatic Huntington’s disease [Citation34]. The Wnt signaling pathway has been described as a key player in many cancers [Citation35,Citation36]. All these results indicate that PRAMEF12 may regulate the progress of spermatogenesis, Huntington’s disease and cancer. However, we did not explore the biological function of PRAMEF12 and the detailed mechanisms are still unclear, which is a limitation of this study.
Conclusion
Our collective results suggest that PRAMEF12 is a novel CTA. PRAMEF12 may serve as a molecular marker to diagnose glioma. PRAMEF12 may act as an oncogene to affect the proliferation, cell cycle and apoptosis of glioma cells. Therefore, PRAMEF12 may be a promising candidate diagnostic biomarker and therapeutic target for better management of glioma patients. Further studies are needed to validate PRAMEF12 as a diagnostic biomarker for glioma. Future studies will have to analyze whether PRAMEF12 or PRAMEF12-derived peptides can be successfully employed as anticancer vaccines.
Author contributions
J Li and J Zhong designed the outline and drafted the manuscript. A Tang, J Yin and S Li offered professional suggestions to the manuscript. All authors approved the final manuscript.
Financial disclosure
This study was supported by Medical Scientific Research Foundation of Guangdong Province (no. A2022525), Guangdong High-level Hospital Construction Fund (no. ynkt2021-zz21) and Shenzhen Medical Key Discipline of Pediatric Surgery (2020-2024) (no. SZXK035).
The authors have no other relevant affiliations or financial involvement with any organization or entity with a financial interest in or financial conflict with the subject matter or materials discussed in the manuscript apart from those disclosed. This includes employment, consultancies, honoraria, stock ownership or options, expert testimony, grants or patents received or pending, or royalties.
Writing disclosure
No writing assistance was utilized in the production of this manuscript.
Ethical conduct of research
The authors state that they have obtained appropriate institutional review board approval or have followed the principles outlined in the Declaration of Helsinki for all human or animal experimental investigations. In addition, for investigations involving human subjects, informed consent has been obtained from the participants involved.
Supplementary Figures S1-S2 and Tables S1-S2
Download Zip (3.7 MB)Supplementary data
To view the supplementary data that accompany this paper please visit the journal website at: www.futuremedicine.com/doi/suppl/10.2217/bmm-2023-0219
Competing interests disclosure
The authors have no competing interests or relevant affiliations with any organization or entity with the subject matter or materials discussed in the manuscript. This includes employment, consultancies, honoraria, stock ownership or options, expert testimony, grants or patents received or pending, or royalties.
Additional information
Funding
References
- Stupp R, Mason WP, van den Bent MJ et al. Radiotherapy plus concomitant and adjuvant temozolomide for glioblastoma. N. Engl. J. Med. 352(10), 987–996 (2005).
- Mitchell DA, Fecci PE, Sampson JH. Immunotherapy of malignant brain tumors. Immunol. Rev. 222, 70–100 (2008).
- Grauer OM, Wesseling P, Adema GJ. Immunotherapy of diffuse gliomas: biological background, current status and future developments. Brain Pathol. 19(4), 674–693 (2009).
- Scanlan MJ, Simpson AJ, Old LJ. The cancer/testis genes: review, standardization, and commentary. Cancer Immun. 4, 1 (2004).
- Suri A. Cancer testis antigens – their importance in immunotherapy and in the early detection of cancer. Expert Opin. Biol. Ther. 6(4), 379–389 (2006).
- CTDatabase. http://www.cta.lncc.br/
- Fratta E, Coral S, Covre A et al. The biology of cancer testis antigens: putative function, regulation and therapeutic potential. Mol. Oncol. 5(2), 164–182 (2011).
- Phuphanich S, Wheeler CJ, Rudnick JD et al. Phase I trial of a multi-epitope-pulsed dendritic cell vaccine for patients with newly diagnosed glioblastoma. Cancer Immunol. Immunother. 62(1), 125–135 (2013).
- Field MG, Decatur CL, Kurtenbach S et al. PRAME as an independent biomarker for metastasis in uveal melanoma. Clin. Cancer Res. 22(5), 1234–1242 (2016).
- Li J, Yin J, Zhong J, Yang Z, Tang A, Li S. Clinicopathological and prognostic significance of PRAME overexpression in human cancer: a meta-analysis. Biomed. Res. Int. 2020, 8828579 (2020).
- Hermes N, Kewitz S, Staege MS. Preferentially expressed antigen in melanoma (PRAME) and the PRAME family of leucine-rich repeat proteins. Curr. Cancer Drug Targets 16(5), 400–414 (2016).
- Hofmann O, Caballero OL, Stevenson BJ et al. Genome-wide analysis of cancer/testis gene expression. Proc. Natl Acad. Sci. USA 105(51), 20422–20427 (2008).
- Grigoriadis A, Caballero OL, Hoek KS et al. CT-X antigen expression in human breast cancer. Proc. Natl Acad. Sci. USA 106(32), 13493–13498 (2009).
- Li J, Zou X, Li C et al. Expression of novel cancer/testis antigen TMEM31 increases during metastatic melanoma progression. Oncol. Lett. 13(4), 2269–2273 (2017).
- Lapointe S, Perry A, Butowski NA. Primary brain tumours in adults. Lancet 392(10145), 432–446 (2018).
- Laug D, Glasgow SM, Deneen B. A glial blueprint for gliomagenesis. Nature Rev. Neurosci. 19(7), 393–403 (2018).
- Ponten F, Jirstrom K, Uhlen M. The Human Protein Atlas–a tool for pathology. J. Pathol. 216(4), 387–393 (2008).
- Mizuno H, Kitada K, Nakai K, Sarai A. PrognoScan: a new database for meta-analysis of the prognostic value of genes. BMC Med. Genomics 2, 18 (2009).
- Vasaikar SV, Straub P, Wang J, Zhang B. LinkedOmics: analyzing multi-omics data within and across 32 cancer types. Nucleic Acids Res. 46(D1), D956–D963 (2018).
- Warde-Farley D, Donaldson SL, Comes O et al. The GeneMANIA prediction server: biological network integration for gene prioritization and predicting gene function. Nucleic Acids Res. 38, W214–220 (2010).
- Szklarczyk D, Gable AL, Lyon D et al. STRING v11: protein–protein association networks with increased coverage, supporting functional discovery in genome-wide experimental datasets. Nucleic Acids Res. 47(D1), D607–D613 (2019).
- Zhou Y, Zhou B, Pache L et al. Metascape provides a biologist-oriented resource for the analysis of systems-level datasets. Nat. Commun. 10(1), 1523 (2019).
- Marumoto T, Saya H. Molecular biology of glioma. Adv. Exp. Med. Biol. 746, 2–11 (2012).
- Wang Y, Jiang T. Understanding high grade glioma: molecular mechanism, therapy and comprehensive management. Cancer Lett. 331(2), 139–146 (2013).
- Song MH, Choi KU, Shin DH, Lee CH, Lee SY. Identification of the cancer/testis antigens AKAP3 and CTp11 by SEREX in hepatocellular carcinoma. Oncol. Rep. 28(5), 1792–1798 (2012).
- Caballero OL, Chen YT. Cancer/testis (CT) antigens: potential targets for immunotherapy. Cancer Sci. 100(11), 2014–2021 (2009).
- Zhang XY, Yan QX, Guo XY et al. Expression profile of SPACA5/Spaca5 in spermatogenesis and transitional cell carcinoma of the bladder. Oncol. Lett. 12(5), 3731–3738 (2016).
- Wang Z, Xu X, Li JL, Palmer C, Maric D, Dean J. Sertoli cell-only phenotype and scRNA-seq define PRAMEF12 as a factor essential for spermatogenesis in mice. Nat. Commun. 10(1), 5196 (2019).
- Syed ON, Mandigo CE, Killory BD, Canoll P, Bruce JN. Cancer-testis and melanocyte-differentiation antigen expression in malignant glioma and meningioma. J. Clin. Neurosci. 19(7), 1016–1021 (2012).
- Freitas M, Malheiros S, Stavale JN et al. Expression of cancer/testis antigens is correlated with improved survival in glioblastoma. Oncotarget 4(4), 636–646 (2013).
- Nylund C, Rappu P, Pakula E et al. Melanoma-associated cancer-testis antigen 16 (CT16) regulates the expression of apoptotic and antiapoptotic genes and promotes cell survival. PLOS ONE 7(9), e45382 (2012).
- Kanojia D, Garg M, Saini S et al. Sperm associated antigen 9 plays an important role in bladder transitional cell carcinoma. PLOS ONE 8(12), e81348 (2013).
- Hu Y, Xing J, Wang L et al. RGS22, a novel cancer/testis antigen, inhibits epithelial cell invasion and metastasis. Clin. Exp. Metastasis 28(6), 541–549 (2011).
- Christodoulou CC, Zachariou M, Tomazou M et al. Investigating the transition of pre-symptomatic to symptomatic Huntington’s disease status based on omics data. Int. J. Mol. Sci. 21(19), 7414 (2020).
- Bugter JM, Fenderico N, Maurice MM. Mutations and mechanisms of WNT pathway tumour suppressors in cancer. Nat. Rev. Cancer 21(1), 5–21 (2021).
- Zhan T, Rindtorff N, Boutros M. Wnt signaling in cancer. Oncogene 36(11), 1461–1473 (2017).