
Abstract
Aim:
To determine the expression signature of triple-negative breast cancer (TNBC) with differences of secreted protein acidic and rich in cysteine expression and clinical behavior.
Patients, materials & methods:
cDNA microarray analysis was performed to determine the expression profiling of TNBC, characterized regarding secreted protein acidic and rich in cysteine expression status. Immunohistochemistry analysis on tissue microarrays containing an independent cohort of TNBC was performed for validation.
Results:
Negative staining of SOHLH2 and positive staining of DNAJC12 and LIM1 was correlated with a poor outcome of the patients.
Conclusion:
Our findings provide new information on transcriptome changes associated with the clinical behavior of TNBC that may serve as a potential tool for the identification and characterization of new candidate biomarkers.
Breast cancer is the second most common type of cancer worldwide and by far the most frequent among women, with an estimated 1.67 million new cases diagnosed in 2012 – the equivalent of 25% of all cancers [Citation1]. Breast cancer is a complex and heterogeneous disease that is currently classified into four intrinsic subtypes: Luminal-A, Luminal-B, Triple-Negative and HER-2-overexpressed breast cancer [Citation2–6].
Triple-negative breast cancer (TNBC) subtype constitutes a distinct group of breast tumors characterized by the absence of estrogen receptor (ER) and progesterone receptor expression, and absence of amplification/overexpression of the HER2 oncoprotein [Citation7]. TNBC is a highly lethal molecular intrinsic subtype corresponding to 12–17% of all breast tumors [Citation8–10]. TNBC often affects African–American patients and young premenopausal women [Citation11,Citation12]. There is a well-established association between deleterious BRCA1 mutations and the risk of developing TNBC subtype, with lifetime risks reaching as high as 50–85% [Citation13–15]. In addition to inactivation of BRCA1, mutations in TP53 and loss of RB1 function are also frequently observed in TNBC [Citation11,Citation16]. Studies using next-generation DNA sequencing and the integration of genomic, epigenomic and transcriptome platforms have revealed a complex profile of TNBC molecular changes, including amplifications, deletions and mutations, which characterize tumors with a high degree of genomic instability [Citation17,Citation18]. The high genetic heterogeneity of these tumors represents a challenge for the development of targeted therapies targeting this tumor subtype. Currently, there is no clinically approved target therapy, and treatment options are reduced, making chemotherapy and surgery still the conventional approach. Neoadjuvant chemotherapy has proven efficacy in the treatment of TNBC, and the regimens include combinations of anthracyclines, alkylating agents, taxanes and platinum salts [Citation19–22].
The secreted protein acidic and cysteine rich (SPARC) gene (also known as BM-40 or osteonectin) encodes a 32-kDa matricellular glycoprotein involved in several biological processes, such as extracellular matrix organization (ECM), focal adhesion, cell proliferation, cell death, angiogenesis and cell differentiation [Citation23–25]. Due to its matricellular protein characteristics, SPARC has multiple functional properties that make it difficult to establish its role in tumor progression, which depending on the context, cell type and microenvironment can act as an oncogene or tumor-suppressor gene [Citation26]. Changes in SPARC expression profile are observed in different tumors. However, the role of SPARC protein and its prognostic value in different types of tumors is divergent and reflects the complexity of actions of this matricellular protein [Citation27–30]. Also, there is evidence that increased SPARC expression confers increased sensitivity to chemotherapy and radiotherapy in colon carcinoma [Citation31]. Furthermore, it has been shown to bind with high affinity to albumin, which raised some interest in its possible role in improving the delivery of albumin-bound cytotoxic drugs to the tumor [Citation32].
A previous study from our group has associated low SPARC expression with worse prognosis and more aggressive phenotypes of breast cancer, including TNBC [Citation33]. In the present study, using cDNA microarray analysis, we evaluated the expression signature of TNBC with differences of SPARC expression. Several genes were identified when comparing the gene expression profile of TNBCs with positive expression of SPARC and good prognosis in comparison with TNBC with negative SPARC expression and poor prognosis. Three of the genes identified as differentially expressed, SOHLH2, DNAJC12 and LIM1 were further validated using immunohistochemistry (IHC) on tissue microarrays (TMAs) containing TNBC. Our study allowed the identification of new biomarker candidates with potential for a better classification and prognosis prediction of TNBC.
Materials & methods
Study design, patients & tumor specimens
The study was designed to evaluate the expression profiling of TNBC with differences in SPARC expression. For this retrospective study, we used two independent cohorts composed of TNBC patients. The discovery cohort was composed of four samples of primary TNBC samples that were selected based on the tumor status of SPARC expression and patient’s outcome previously determined by our group [Citation33]. Tumor samples were dissected to remove residual normal tissue before being frozen and stored in liquid nitrogen until the time of extraction of RNA. From this cohort, two TNBC samples with SPARC expression under median value (66.7–89.9) and short overall survival (OS; 12.5–32 months), and other two samples with SPARC expression above median value (127.6–169.4) and long OS (51.9–57.9 months) were used for gene expression cDNA microarray analysis. The validation cohort composed of 51 specimens of well-characterized TNBC was retrospectively obtained from A. C. Camargo Cancer Center, São Paulo, Brazil archives and evaluated as duplicate by IHC in TMA slides. All 51 patients were diagnosed with invasive ductal carcinomas, the majority of the patients had tumors with histological and nuclear Grade 3, and clinical stage was homogeneous between Stages II and III at diagnosis (). The age of the patients ranged from 24 to 77 years (median 48 years). The follow-up period ranged from 18.57 to 243.67 months (median 80.2 months). The Institutional Ethics Committee approved this study and all subjects provided informed consent.
Table 1. Clinicopathological features of triple-negative breast cancer patients.
Extraction of RNA
Tumor samples were sprayed with the aid of a Termovac, and total RNA was extracted using the acid guanidinium thiocyanate-phenol-chloroform method [Citation34], and high-quality RNA was purified using the RNeasy Mini Kit (Qiagen, MD, USA) as previously described [Citation35]. The sample integrity was also determined by RNA nanochips using the Agilent 2100 Bioanalyzer platform (Agilent Technologies, CA, USA), using samples that had an RNA integrity number (RIN) ≥ 8.
cDNA microarray analysis
The cDNA microarray analysis was performed using the low-input RNA Linear Amplification Kit 2-color (GE Healthcare Bio-Sciences Corp., NJ, USA) as previously described [Citation35]. The data were quantified, and the quality control performed using the Agilent FE Software (Agilent Technologies). The extracted data were imported into Agilent Gene Spring 12.5 – GX Analyze Program (Agilent Technologies). The Ingenuity Pathway Knowledge Base (IPA) system (Qiagen) was used to identify and construct gene networks.
The raw data from the present study have been deposited in NCBI′s (National Center for Biotechnology Information) Gene Expression Omnibus (GEO) [Citation36] and are accessible through GEO Series accession number GSE98931 (www.ncbi.nlm.nih.gov/geo/query/acc.cgi?acc=GSE98931).
TMAs construction & IHC
Breast TMAs were constructed and immunostained as previously described [Citation33]. The primary antibodies were rabbit polyclonal anti-SOHLH2 (Abcam, MA, USA; catalog ab101402, 1:50), rabbit polyclonal anti-SPARC (Santa Cruz Biotechnology, Inc., CA, USA; catalog sc-25574; clone H90, 1:50), goat polyclonal anti-DNAJC12 (Santa Cruz Biotechnology, Inc.; catalog ta-803415; clone OTI1C2, 1:200), mouse monoclonal anti-LIM1 (Abcam; all according to the manufacturers’ recommendations). The optimal dilution was defined using well-characterized positive samples and tested before staining of the TMA slides.
Evaluation of IHC
Immunohistochemical evaluation was semiquantitative for each marker, considering the percentage of stained cells and intensity of the reaction. For the most intense markers (SPARC and SOHLH2), the immunostainings were graded according to the intensity of staining: 0 (no signal), 1 (weak), 2 (moderate) and 3 (strong), and to the percentage of stained cells: 0 (no cell), 1 (<10%), 2 (10–50%), 3 (51–90%) and 4 (>90% of cells). The core was classified according to the most representative staining in tumor cells, and for statistical analysis, cases were grouped as negative (no signal/weak) or positive (moderate/strong). The lower intensity markers (DNAJC12 and LIM1) were categorized as positive when more than 10% of the cells were labeled, and negative when the labeling was absent, or present in less than 10% of the tumor cells.
Statistical analysis
Statistical analysis was performed using demographic, clinical and pathological information of the patients, and patient follow-up tabulated in the Statistical Package for Social Science for Windows program, version 20.0. The correlations between the data obtained in the immunohistochemical analysis and the demographic, clinical and anatomopathological variables were calculated by the Fisher exact test. The analysis of the prognostic factors was done through the Kaplan–Meier product-limit estimator and Cox proportional hazard models. To compare the cumulative survival probability curves, we used the log-rank test. All differences with a p-value of less than 0.05 were considered significant.
Results
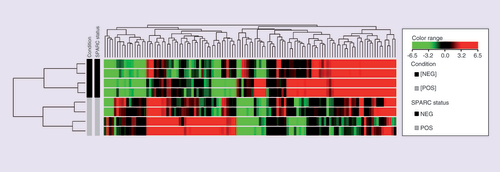
In this study, we sought to determine the expression profile of TNBC tumors with differences in SPARC expression pattern and biological behavior to identify potential new biomarkers. cDNA microarray assays (Agilent Technologies, 4X44K) were performed to identify differentially expressed genes in a small discovery cohort composed by TNBC with SPARC-positive expression and good prognosis (TNBC/SPARC+) and TNBC with SPARC-negative expression and poor prognosis (TNBC/SPARC-). Using a fold change of more than three as a cutoff, we identified a significant number of differentially expressed genes (Supplementary Tables 1 and 2). In the comparison between TNBC/SPARC+ versus TNBC/SPARC-, 338 transcripts were upregulated and 437 transcripts were downregulated. The lists containing the top 50 differentially expressed genes (up- and downregulated) and its association to cancer are presented in and , respectively. shows the heat map of the top 50 differentially expressed genes.
Table 2. 50 top genes differentially expressed identified in transcriptome analysis: SPARC positive versus SPARC negative – positively regulated.
The hierarchical cluster shows the fold change inexpression of the 50 TOP upregulated genes and 50 TOP downregulated genes, using the cut off foldchange ≥ 3. Columns in heat map correspond to the samples categorized as TNBC with SPARC positive expression and good prognosis (in grey) and TNBC with SPARC negative expression and poor prognosis (in black). Transcript enrichment is encoded in the heat map in green when showing downregulation; or red when showing upregulation in the comparison of TNBC/SPARC+ vs TNBC/SPARC.
TNBC: Triple negative breast cancer; TOP: Gene expression profiling of TNBC with differences in SPARC expression.
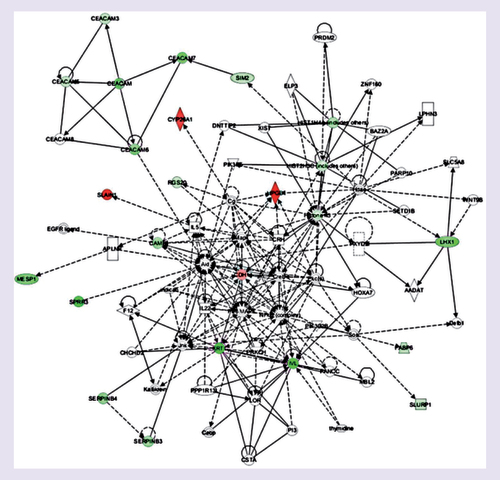
The differentially expressed genes were categorized by the gene ontology analysis regarding of the cellular processes they participate. They are involved in different biological processes, such as immune system processes, metabolic processes, cellular response to chemical stimuli, angiogenesis, apoptosis and cell adhesion. However, there was no increment in specific biological processes in the comparison between up- or downregulated genes. Furthermore, using the IPA Ingenuity® program, we evaluated the possible occurrence of interactions between the differentially expressed genes in the TNBC/SPARC+ versus TNBC/SPARC- comparison. Different gene networks were generated. Among these networks, we highlight one that shows the negative modulation of transcripts of members of the CEACAM family (CEACAM-3, 5, 6 and 7) and the LHX1 (LIM1) gene transcripts ().
Genes or gene products are represented as nodes, and the biological relationship betweentwo nodes is represented as an edge. The intensity of the node color indicates the degree of upregulation (red) or downregulation (green). Edges are displayed with various labels that describe the nature of the relationship between the nodes: — binding only, → acts on, Θ auto-regulation.
The selection of the genes for validation was done using gene annotation in public data base and literature mining. Several genes identified as differentially expressed in the comparison between TNBC/SPARC+ versus TNBC/SPARC- seem to be good candidates for biomarkers with potential prognostic value for TNBC. Two of the selected genes showed high fold change in the comparison between TNBC/SPARC+ versus TNBC/SPARC-, one upregulated (SOHLH2; fold change: 24.20) and one downregulated (LHX1; fold change: -22.51), and are contained in the table of the top 50 genes ( & ). Also, we selected for validation an upregulated gene with showed a smaller fold change (DNAJC12; fold change: 3.5; Supplementary Table 1), which is already part of the gene pool studied by our laboratory [Citation37]. For the validation of the selected genes, we used two independent cohorts. First, we performed an exploratory analysis using the KM Plotter database (www.kmplot.com [Citation38]) to evaluate Kaplan–Meyer curves for disease-free survival (DFS) and OS for all breast cancer subtypes and for Basal-like/TNBC stratified by the transcript expression of SOHLH2, DNAJC12 and LIM1. This analysis was performed using the best cutoff and validated probes (SPARC – 212667_at, SOHLH2 – 1555401_at, DNAJC2 – 223722_at and LIM1 – 206230_at). Second, we sought to access the prognostic value of the proteins encoded by the selected genes by IHC on TMAs containing 51 TNBC samples ().
Table 3. 50 top genes differentially expressed identified in transcriptome analysis: SPARC positive versus SPARC negative – negatively regulated.
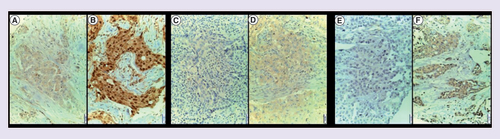
SOHLH2 protein showed nuclear and cytoplasmic staining: (A) tumor cells with cytoplasmic weak staining. (B) Nuclear and cytoplasmic positive staining of tumor cells with a discreet stromal staining. DNAJC12 protein showed cytoplasmic staining. (C) Negative staining. (D) Cytoplasmic positive staining. LIM1 protein showed cytoplasmic staining. (E) Negative staining. (F) Positive staining.
Magnification: 20x.
The Kaplan–Meier curves generated using the KM Plotter tool for all breast cancer subtypes, and Basal-like/TNBC subtype stratified by the transcript expression of selected genes are presented in Supplementary Figures 1, 2, and 3. Low mRNA levels of SOHLH2 were associated with short DFS and a trend to be associated with OS for all breast cancer subtypes and Basal-like/TNBC subtype patients (Supplementary Figure 1). Interestingly, low mRNA levels of DNAJC12 were found to be correlated to worsen DFS and OS for breast cancer patients of all subtypes, whereas the high transcriptional expression of DNAJC12 was associated with shorter DFS and OS in Basal-like/TNBC subtype (Supplementary Figure 2). Low mRNA levels of LIM1 expression were associated with shorter DFS for both breast cancer patients of all subtypes and Basal-like/TNBC patients (Supplementary Figure 3).
To access the contribution of the potential new biomarkers to the development and progression of TNBC, the demographic and clinical–pathological characteristics of the patients were compared to their status of immunostaining. SPARC (neg. vs pos.: 47.5 ± 11.9 vs 51.6 ± 13.3; p = 0.183), SOHLH2 (neg. vs pos.: 34.2 ± 9.4 vs 51.8 ± 11.3; p = 0.005) and LIM1 (neg. vs pos.: 54.1 ± 10.4 vs 44.9 ± 11.2; p = 0.023) immunostaining showed age differences (Mann–Whitney test). No age differences were observed for the DNAJC12 immunostaining status. There was no significant correlation between SPARC, SOHLH2, DNAJC12 and LIM1 staining status and tumor size, lymph nodal status, clinical Stage and histological. LIM1 was the only to present a correlation with nuclear grade (p = 0.018).
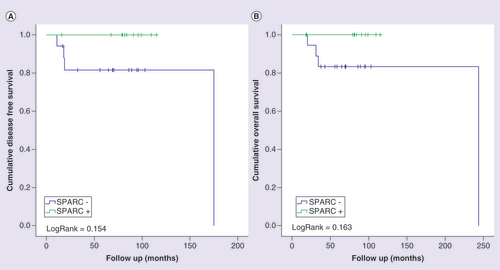
To access the individual prognostic value of the potential new biomarkers, we evaluated the association between the IHC expression and patient’s outcomes by Kaplan–Meier analysis for the validation cohort. The immunohistochemical expression of the SPARC protein was determined for the evaluation in combination with the expression of the potential new biomarkers. Although it did not reach statistical significance, the negative staining of the SPARC protein showed a tendency to be associated with worse prognosis. Patients with tumors with reduced expression of SPARC had a shorter DFS time and a shorter OS time when compared with patients with tumors with SPARC-positive staining (A, DFS; p = 0.154; B, OS; p = 0.163). Here, due to the limited number of recruited patients, multivariate analyses or binary logistic regression of gene expression status with all other clinical–pathological variables were not applicable.
Kaplan-Meier curves for disease-free (A) and overall (B) survival of triple-negative breast cancer patients, stratified according to SPARC protein expression. Patients were categorized as positive (moderate or intense) or negative (negative or weak) according to SPARC protein immunostaining. LogRank test was performed for curves comparison.
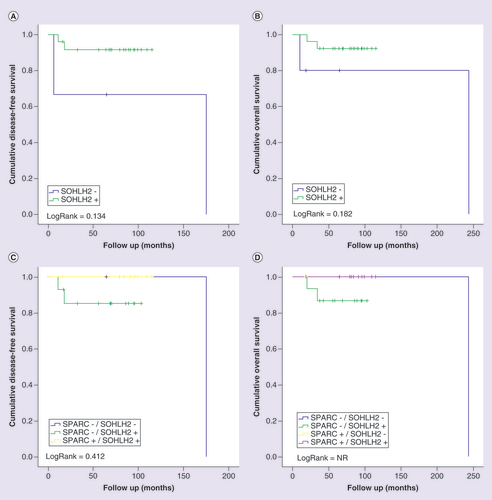
Negative SOHLH2 immunohistochemical expression showed a trend to be correlated with a poor prognosis for both DFS (A; p = 0.134) and OS (B; p = 0.182). The evaluation of the new potential biomarkers in association with the expression of SPARC was only possible in the analyzable cases for SPARC, which further limited our casuistic. Interestingly, when the cohort was split into four subgroups for the evaluation of SOHLH2 expression in combination with SPARC expression, only TBNC patients with tumors with SPARC-negative staining and SOHLH2-positive staining showed a trend to unfavorable prognosis (C, DFS; p = 0.412; D, OS; p = not reached).
Kaplan-Meier curves for disease-free (A and C) and overall (B and D) survival of triple-negative breast cancer patients stratified according to SOHLH2 protein expression. Patients were categorized as positive (moderate orintense) or negative (negative or weak) according to SOHLH2 protein immunostaining. In (C) and (D), patients were classified in four categories according to the protein immunostaining of SPARC and SOHLH2 status. LogRank test was performed for curves comparison.
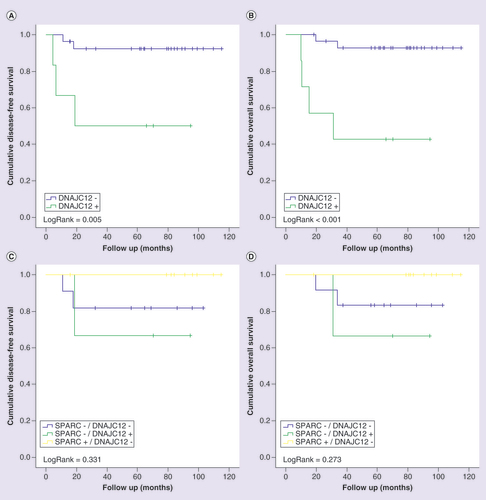
The DFS and OS curves for patients with TNBC stratified by the immunohistochemical expression of DNAJC12 alone and in combination with SPARC expression are shown in . Positive staining of DNAJC12 protein showed a significant association with a worse prognosis for both DFS (A; p = 0.005) and OS (B; p < 0.001) in patients with TNBC. In the evaluation of the expression of DNAJC12 in association with the expression of SPARC, we observed that the combination of positive expression of DNAJC12 and negative expression of SPARC confers increased tumor aggressiveness and confers the worse prognosis for patients with TNBC (C & D). Although not statistically significant, patients with tumors with negative expression of SPARC and positive expression of DNAJC12 (TNBC SPARC-/DNAJC12+) showed a trend to have the shorter time of DFS (C; p = 0.331) and OS (D; p = 0.273) compared with the other subgroups.
Kaplan-Meier curves for disease-free (A and C) and overall (B and D) survival of triple-negative breast cancer patients stratified according to DNAJC12 protein expression. Patients were categorized as positive (>10%) ornegative (<10%) according to the percentage of tumor cells positive to DNAJC12. In (C) and (D), patients were classified in four categories according to the protein immunostaining of SPARC and DNAJC12 status. LogRank test was performed for curves comparison.
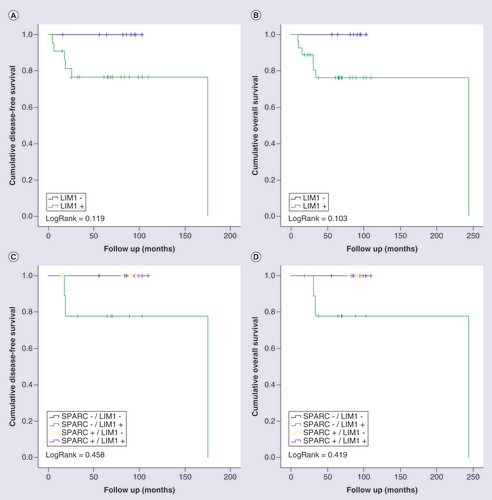
Although without statistical significance, positive staining of LIM1 was associated with unfavorable prognosis. Patients with tumors with positive immunostaining for LIM1 showed a shorter DFS (A; p = 0.119) and OS (B; p = 0.103) than patients with tumors with negative immunostaining. When stratifying patients for the combination of LIM1 and SPARC expression status, positive staining of LIM1 in the presence of negative staining for SPARC conferred the worse prognosis as compared with all other SPARC and LIM1 combinations (C & D).
Kaplan-Meier curves for disease-free (A and C) and overall (B and D) survival of triple-negative breast cancer patients stratified according to LIM1 protein expression. Patients were categorized as positive (>10%) or negative (<10%) according to the percentage of tumor cells positive to LIM1. In (C) and (D), patients were classified in four categories according to the protein immunostaining of SPARC and LIM1 status. LogRank test was performed for curves comparison.
Discussion
Triple-negative tumors represent a unique subtype of breast cancer and have been indicative of poorer prognosis since its onset [Citation10,Citation19,Citation39,Citation40]. We have previously shown that SPARC downregulation is associated with poor prognosis in TNBC patients [Citation33]. In the present study, we used a cDNA microarray to identify transcriptional changes that could better characterize differences in the clinical behavior of TNBC with negative SPARC expression and positive SPARC expression. Currently, we were able to identify a large number of up- and downregulated genes with the potential to be associated with the clinical behavior of TNBC. Furthermore, using an independent validation cohort, we examine the protein expression pattern of three of the differentially expressed genes, SOHLH2, DNAJC12 and LIM1, and their relationship with TNBC patients’ survival data.
Within this scenario, the gene SOHLH2 (spermatogenesis and oogenesis basic helix-loop-helix transcription factor 2) was highlighted as one of the top upregulated transcripts among the differentially expressed genes. SOHLH2 encodes for a protein that belongs to the BHLH superfamily of transcription factors that play critical roles in many physiological processes, including cell differentiation, cell cycle disruption and apoptosis [Citation41]. SOHLH2 is a transcriptional factor essential for spermatogenesis and oogenesis [Citation42]. There is evidence that SOHLH2 can act as homodimer or heterodimer with SOHLH1 to promote spermatogonial stem cells and spermatogonial cells differentiation by the transcriptional regulation of different target genes [Citation42–44]. Recent data show that high expression of SOHLH2 is observed in many normal tissues, especially in epithelial tissues, while a low level of expression of SOHLH2 has been detected in many cancer cell lines [Citation45]. SOHLH2 are considered a tumor-suppressor gene for ovarian epithelial tumors, where low levels of SOHLH2 expression were associated with increased cyclin D1 activity, and consequently with worse prognosis [Citation46]. We found similar results in TNBC, in which was possible to perceive that when there are low levels of SOHLH2 expression, there is a worse clinical evolution, whereas in tumors that expressed high levels of SOHLH2 were observed a better DFS and OS, respectively, indicating that SOHLH2 may also act as a tumor suppressor in breast cancer. In breast tumors, Ji et al. [Citation47] demonstrated that reduced expression of SOHLH2 in metastatic breast tumors. In the same study, these authors also found that ectopic expression of SOHLH2 in breast cancer cells reduced EMT and inhibited cell migration and invasion in vitro, and metastasis in vivo [Citation47]. Although not statistically significant, in our study, when analyzing SOHLH2 in combination with SPARC expression, it is possible to recognize an opposite trend of SOHLH2 expression regarding of prognostic in patients with TNBC. We found that positive expression of SOHLH2 was related to events of recurrence, compared with the group of patients with TNBC with negative expression. We are aware that the main limitation of our study is the small quantity of TNBC analyzed. However, our results provide new insights on the role played by SOHLH2 in TNBC that warranted further experimental and clinical studies and the potential role of SOHLH2 in breast cancer.
Here, the transcripts of DNAJC12 were found to be upregulated in TNBC with positive expression of SPARC (fold change = 3.5) in comparison with TNBC with negative expression of SPARC. The DNAJC12 gene (also named JDP1) encodes for the J-domain containing protein 1, a member of the small molecular size heat-shock proteins (DNAJ/HSP40) family [Citation48]. The DNAJ/HSP40 family is highly conserved through evolution and comprises 41 members with a molecular size of approximately 40 kDa that has essential cochaperone activity with other heat-shock proteins [Citation48,Citation49]. Experimental and clinical evidences have indicated the involvement of some of the DNAJ/HSP40 family members in different types of cancers [Citation50]. In previous studies, we have identified the transcripts of DNAJC12 as differentially expressed between ER-positive and ER-negative breast tumors [Citation51]. Furthermore, we provide evidence that DNAJC12 is an ER target gene highly expressed in ER-positive tumors [Citation37]. In the present study, the positive immunohistochemical expression of DNAJC12 was associated with poorer prognosis in TNBC patients. When analyzed in association with the SPARC expression, positive expression of DNAJC12 showed a tendency to confer the worst prognosis for patients with TNBC with negative expression of SPARC, indicating that DNAJC12 protein expression has potential to identify TNBC patients with worse prognosis in different contexts. In prostate cancer cells, DNAJC12 has been shown to act as a cofactor of the chaperone Hsc70 and to be upregulated by the stress-inducing drug A23187 and by the stress-regulated transcription factor AIbZIP/CREB3L4 [Citation52]. In cancer of the rectum, high immunohistochemical expression of DNAJC12 was found to be correlated with poor prognosis for both OS and DFS, and multivariate analysis showed DNAJC12 overexpression is an independent prognostic factor [Citation53]. Also, these authors identified that DNAJC12 overexpression acts as a negative predictive factor for the response to neoadjuvant concurrent chemoradiotherapy [Citation53]. Taken together, these findings indicate DNAJC12 as a potential prognostic and predictive factor in cancer and support the need for future research to elucidate the role of DNAJC12 in TNBC.
LIM family proteins (LMO 1–4) are emerging as key molecules in a wide variety of malignant tumors in humans. In particular, all members, which are required for various developmental processes, are involved in the initiation or progression of different types of neoplasms, including T-cell leukemia, breast cancer and neuroblastoma [Citation54]. There are indications that the gene acts on cell motility, but the mechanisms involved in inducing cell motility, tumor growth, angiogenesis and invasion are still poorly understood [Citation55]. However, the high expression of LIM in breast cancer cells appeared to be linked to angiogenesis and increased the presence of metastases, suggesting an oncogene behavior in this type of tumor [Citation56]. And this corroborates our results, showing that in TNBC with low SPARC expression, LIM overexpression correlated with worse clinical evolution and this seems to be supported by its right relation with processes of cell invasion and angiogenesis [Citation57]. Singh et al. [Citation58] demonstrated that the high expression of LIM family genes function as repressors of the ER-α as the genes are not only linked to this receptor but also to its corepressor, the tumor metastasis antigen 1. They showed that LIM silencing resulted in increased expression of the regulatory genes of ER-α. Consequently, since LIM is highly expressed in breast tumors, negative phenotypes for ER-α may be related to progression and increased tumor aggressiveness [Citation59]. This behavior is also observed in DFS, and OS curves are corroborating a trend to more aggressive biological behavior in TNBC with high expression of LIM, especially when related to tumors that also present low expression of SPARC. Regarding recurrence, the high expression of LIM correlated with a greater number of local and systemic events, although not reaching statistical significance, in comparison to the low expression of LIM. In addition, our results showed the worst OS of patients with a high level of LIM expression. Therefore, inhibition of LIM may be useful in the treatment of TNBC, which does not present specific therapeutic options, as in other breast cancer subtypes, especially those with SPARC+/LIM-.
The main limitations of this study rely on our single-institution retrospective study with the inclusion of a small number of TNBC. We are aware that more reliable studies for the validation of the differentially expressed genes identified in the present study with robust method validation using larger and independent cohorts are required. At present, we are conducting in silico data analysis using the TCGA [Citation60] and METRABIC [Citation18] breast cancer datasets to test the biologically relevant hypothesis with different sets of differentially expressed genes generated by our group. The complete list and analysis of these differentially expressed genes will be reported as part of another study. Also, we are recruiting new patients and beginning collaborative studies with researchers from other institutions to conduct a series of large-scale independent validation studies.
Conclusion
In the present study determining the expression profile of TNBC, with differences in the expression of SPARC and clinical behavior, we have identified SOHLH2, DNAJC12 and LIM1 as potential new biomarkers for TNBC prognosis. Moreover, by previous reports in the literature, our findings indicated that SPARC could regulate gene expression in breast tumors. This effect is possibly due to the ability of SPARC to act on extracellular matrix remodeling that modulates several cell-signaling pathways that impact on gene expression [Citation61–63]. Further clinical and experimental studies are required to determine the impact of the SPARC-modulated genes in breast cancer progression and their possible use in target therapy. Additionally, our findings illustrate the importance of studying specific subgroups of very well-characterized TNBC about clinical behavior. Importantly, our findings provide new informative data on the expression profiling potentially associated with TNBC that may serve as a potential tool for the identification and characterization of new candidate biomarkers with potential to be used as prognostic and predictive factors for patients with TNBC in the future.
Triple-negative breast cancer (TNBC) tumors represent a unique subtype of breast cancer and have been indicative of poorer prognosis since its onset.
cDNA microarray analysis allowed us to determine the expression signature of TNBC with differences of secreted protein acidic and rich in cysteine (SPARC) expression and clinical behavior.
We have identified transcriptional changes that could better characterize differences in the clinical behavior of TNBC with negative SPARC expression and positive SPARC expression.
Three of the genes identified as differentially expressed, SOHLH2, DNAJC12 and LIM1, were further validated using immunohistochemistry on tissue microarrays containing TNBC.
We found that positive expression of SOHLH2 was related to events of recurrence.
Positive immunohistochemical expression of DNAJC12 was associated with poorer prognosis in TNBC patients.
A more aggressive biological behavior was observed in TNBC with high expression of LIM1.
Our study provides valuable information on new biomarker candidates with potential for better classification and prognosis prediction of TNBC.
Financial & competing interests disclosure
This work was supported by Fundação de Amparo a Pesquisa do Estado de São Paulo (FAPESP; 2013/07035–4) and Conselho Nacional de Desenvolvimento Científico e Tecnológico (CNPq; 303134/2013–5). The authors have no other relevant affiliations or financial involvement with any organization or entity with a financial interest in or financial conflict with the subject matter or materials discussed in the manuscript apart from those disclosed.
No writing assistance was utilized in the production of this manuscript.
Ethical conduct of research
The authors state that for investigations involving human subjects, informed consent has been obtained from the participants involved.
Data deposition
The data generated in the present study have been deposited in NCBI’s gene Expression Omnibus [Citation36] and are accessible through GEO Series accession number GSE98931 (www.ncbi.nlm.nih.gov/geo/query/acc.cgi?acc=GSE98931).
suppl_table_1
Download TIFF Image (116.1 KB)suppl_table_2
Download TIFF Image (119.4 KB)suppl_fig_1
Download TIFF Image (120.8 KB)suppl_fig_2
Download MS Word (55.5 KB)suppl_fig_3
Download MS Word (61.8 KB)Acknowledgements
The authors gratefully acknowledge Yuri Moreira for microarray analysis support.
Supplementary data
To view the supplementary data that accompany this paper please visit the journal website at: www.tandfonline.com/doi/suppl/10.2217/bmt-2017-0019
Additional information
Funding
References
- Ferlay J , Soerjomataram I , Dikshit R et al. Cancer incidence and mortality worldwide: sources, methods and major patterns in GLOBOCAN 2012. Int. J. Cancer 136(5), E359–E386 (2015).
- Arvold ND , Taghian AG , Niemierko A et al. Age, breast cancer subtype approximation, and local recurrence after breast-conserving therapy. J. Clin. Oncol. 29(29), 3885–3891 (2011).
- Noh JM , Choi DH , Huh SJ et al. Patterns of recurrence after breast-conserving treatment for early Stage breast cancer by molecular subtype. J. Breast Cancer 14(1), 46–51 (2011).
- Ahn SG , Kim SJ , Kim C , Jeong J . Molecular classification of triple-negative breast cancer. J. Breast Cancer 19(3), 223–230 (2016).
- Partridge AH , Hughes ME , Warner ET et al. Subtype-dependent relationship between young age at diagnosis and breast cancer survival. J. Clin. Oncol. 34(27), 3308–3314 (2016).
- Cossetti RJ , Tyldesley SK , Speers CH , Zheng Y , Gelmon KA . Comparison of breast cancer recurrence and outcome patterns between patients treated from 1986 to 1992 and from 2004 to 2008. J. Clin. Oncol. 33(1), 65–73 (2015).
- Engebraaten O , Vollan HK , B⊘rresen-Dale AL . Triple-negative breast cancer and the need for new therapeutic targets. Am. J. Pathol. 183(4), 1064–1074 (2013).
- Foulkes WD , Smith IE , Reis-Filho JS . Triple-negative breast cancer. N. Engl. J. Med. 363(20), 1938–1948 (2010).
- Boyle P . Triple-negative breast cancer: epidemiological considerations and recommendations. Ann. Oncol. 23(Suppl. 6), vi7–12 (2012).
- Pareja F , Geyer FC , Marchiò C , Burke KA , Weigelt B , Reis-Filho JS . Triple-negative breast cancer: the importance of molecular and histologic subtyping, and recognition of low-Grade variants. NPJ Breast Cancer 2, 16036 (2016).
- Carey LA , Perou CM , Livasy CA et al. Race, breast cancer subtypes, and survival in the Carolina Breast Cancer Study. JAMA 295(21), 2492–2502 (2006).
- Kurebayashi J , Moriya T , Ishida T et al. The prevalence of intrinsic subtypes and prognosis in breast cancer patients of different races. Breast 16(Suppl. 2), S72–S77 (2007).
- Byrski T , Huzarski T , Dent R et al. Response to neoadjuvant therapy with cisplatin in BRCA1-positive breast cancer patients. Breast Cancer Res. Treat. 115(2), 359–363 (2009).
- Fostira F , Tsitlaidou M , Papadimitriou C et al. Prevalence of BRCA1 mutations among 403 women with triple-negative breast cancer: implications for genetic screening selection criteria: a Hellenic Cooperative Oncology Group Study. Breast Cancer Res. Treat. 134(1), 353–362 (2012).
- Greenup R , Buchanan A , Lorizio W et al. Prevalence of BRCA mutations among women with triple-negative breast cancer (TNBC) in a genetic counseling cohort. Ann. Surg. Oncol. 20(10), 3254–3258 (2013).
- Herschkowitz JI , He X , Fan C , Perou CM . The functional loss of the retinoblastoma tumour suppressor is a common event in basal-like and luminal B breast carcinomas. Breast Cancer Res. 10(5), R75 (2008).
- Ding L , Ellis MJ , Li S et al. Genome remodelling in a basal-like breast cancer metastasis and xenograft. Nature 464(7291), 999–1005 (2010).
- Curtis C , Shah SP , Chin SF et al. The genomic and transcriptomic architecture of 2,000 breast tumours reveals novel subgroups. Nature 486(7403), 346–352 (2012).
- Hudis CA , Gianni L . Triple-negative breast cancer: an unmet medical need. Oncologist 16(Suppl. 1), 1–11 (2011).
- Byrski T , Gronwald J , Huzarski T et al. Pathologic complete response rates in young women with BRCA1-positive breast cancers after neoadjuvant chemotherapy. J. Clin. Oncol. 28(3), 375–379 (2010).
- Colleoni M , Cole BF , Viale G et al. Classical cyclophosphamide, methotrexate, and fluorouracil chemotherapy is more effective in triple-negative, node-negative breast cancer: results from two randomized trials of adjuvant chemoendocrine therapy for node-negative breast cancer. J. Clin. Oncol. 28(18), 2966–2973 (2010).
- Silver DP , Richardson AL , Eklund AC et al. Efficacy of neoadjuvant Cisplatin in triple-negative breast cancer. J. Clin. Oncol. 28(7), 1145–1153 (2010).
- Brekken RA , Sage EH . SPARC, a matricellular protein: at the crossroads of cell-matrix communication. Matrix Biol. 19(8), 816–827 (2001).
- Framson PE , Sage EH . SPARC and tumor growth: where the seed meets the soil? J. Cell Biochem. 92(4), 679–690 (2004).
- Bradshaw AD . Diverse biological functions of the SPARC family of proteins. Int. J. Biochem. Cell Biol. 44(3), 480–488 (2012).
- Arnold SA , Brekken RA . SPARC: a matricellular regulator of tumorigenesis. J. Cell Commun. Signal 3(3–4), 255–273 (2009).
- Porte H , Chastre E , Prevot S et al. Neoplastic progression of human colorectal cancer is associated with overexpression of the stromelysin-3 and BM-40/SPARC genes. Int. J. Cancer 64(1), 70–75 (1995).
- Brown TJ , Shaw PA , Karp X , Huynh MH , Begley H , Ringuette MJ . Activation of SPARC expression in reactive stroma associated with human epithelial ovarian cancer. Gynecol. Oncol. 75(1), 25–33 (1999).
- Wang CS , Lin KH , Chen SL , Chan YF , Hsueh S . Overexpression of SPARC gene in human gastric carcinoma and its clinic-pathologic significance. Br. J. Cancer 91(11), 1924–1930 (2004).
- Chin D , Boyle GM , Williams RM et al. Novel markers for poor prognosis in head and neck cancer. Int. J. Cancer 113(5), 789–797 (2005).
- Tai IT , Dai M , Owen DA , Chen LB . Genome-wide expression analysis of therapy-resistant tumors reveals SPARC as a novel target for cancer therapy. J. Clin. Invest. 115(6), 1492–1502 (2005).
- Desai N , Trieu V , Damascelli B , Soon-Shiong P . SPARC expression correlates with tumor response to albumin-bound paclitaxel in head and neck cancer patients. Transl. Oncol. 2(2), 59–64 (2009).
- Nagai MA , Gerhard R , Fregnani JH et al. Prognostic value of NDRG1 and SPARC protein expression in breast cancer patients. Breast Cancer Res. Treat. 126(1), 1–14 (2011).
- Chomczynski P , Sacchi N . Single-step method of RNA isolation by acid guanidinium thiocyanate-phenol-chloroform extraction. Anal. Biochem. 162(1), 156–159 (1987).
- de Bessa Garcia SA , Pavanelli AC , Cruz E , Melo N , Nagai MA . Prostate apoptosis response 4 (PAR4) expression modulates WNT signaling pathways in MCF7 breast cancer cells: a possible mechanism underlying PAR4-mediated docetaxel chemosensitivity. Int. J. Mol. Med. 39(4), 809–818 (2017).
- Edgar R , Domrachev M , Lash AE . Gene expression omnibus: NCBI gene expression and hybridization array data repository. Nucleic Acids Res. 30(1), 207–210 (2002).
- De Bessa SA , Salaorni S , Patrão DF , Neto MM , Brentani MM , Nagai MA . JDP1 (DNAJC12/Hsp40) expression in breast cancer and its association with estrogen receptor status. Int. J. Mol. Med. 17(2), 363–367 (2006).
- Szász AM , Lánczky A , Nagy Á et al. Cross-validation of survival associated biomarkers in gastric cancer using transcriptomic data of 1,065 patients. Oncotarget 7(31), 49322–49333 (2016).
- Rakha EA , Ellis IO . Triple-negative/basal-like breast cancer: review. Pathology 41(1), 40–47 (2009).
- Ali AM , Ansari JAK , El-Aziz NMA et al. Triple negative breast cancer: a tale of two decades. Anticancer Agents Med. Chem. 17(4), 491–499 (2017).
- Sun H , Ghaffari S , Taneja R . bHLH-orange transcription factors in development and cancer. Transl. Oncogenomics 2, 107–120 (2007).
- Ballow DJ , Xin Y , Choi Y , Pangas SA , Rajkovic A . SOHLH2 is a germ cell-specific bHLH transcription factor. Gene Expr. Patterns 6(8), 1014–1018 (2006).
- Toyoda S , Miyazaki T , Miyazaki S et al. SOHLH2 affects differentiation of KIT positive oocytes and spermatogonia. Dev. Biol. 325(1), 238–248 (2009).
- Suzuki H , Ahn HW , Chu T et al. SOHLH1 and SOHLH2 coordinate spermatogonial differentiation. Dev. Biol. 361(2), 301–312 (2012).
- Lukk M , Kapushesky M , Nikkilä J et al. A global map of human gene expression. Nat. Biotechnol. 28(4), 322–324 (2010).
- Zhang H , Zhang X , Ji S et al. Sohlh2 inhibits ovarian cancer cell proliferation by upregulation of p21 and downregulation of cyclin D1. Carcinogenesis 35(8), 1863–1871 (2014).
- Ji S , Zhang W , Zhang X et al. Sohlh2 suppresses epithelial to mesenchymal transition in breast cancer via downregulation of IL-8. Oncotarget 7(31), 49411–49424 (2016).
- Lee J , Hahn Y , Yun JH , Mita K , Chung JH . Characterization of JDP genes, an evolutionarily conserved J domain-only protein family, from human and moths. Biochim. Biophys. Acta 1491(1–3), 355–363 (2000).
- Qiu XB , Shao YM , Miao S , Wang L . The diversity of the DnaJ/Hsp40 family, the crucial partners for Hsp70 chaperones. Cell. Mol. Life Sci. 63(22), 2560–2570 (2006).
- Mitra A , Shevde LA , Samant RS . Multi-faceted role of HSP40 in cancer. Clin. Exp. Metastasis 26(6), 559–567 (2009).
- Nagai MA , Da Rós N , Neto MM et al. Gene expression profiles in breast tumors regarding the presence or absence of estrogen and progesterone receptors. Int. J. Cancer 111(6), 892–899 (2004).
- Choi J , Djebbar S , Fournier A , Labrie C . The co-chaperone DNAJC12 binds to Hsc70 and is upregulated by endoplasmic reticulum stress. Cell Stress Chaperones 19(3), 439–446 (2014).
- He HL , Lee YE , Chen HP et al. Overexpression of DNAJC12 predicts poor response to neoadjuvant concurrent chemoradiotherapy in patients with rectal cancer. Exp. Mol. Pathol. 98(3), 338–345 (2015).
- Matthews JM , Lester K , Joseph S , Curtis DJ . LIM-domain-only proteins in cancer. Nat. Rev. Cancer 13(2), 111–122 (2013).
- Sum EY , Segara D , Duscio B et al. Overexpression of LMO4 induces mammary hyperplasia, promotes cell invasion, and is a predictor of poor outcome in breast cancer. Proc. Natl Acad. Sci. USA 102(21), 7659–7664 (2005).
- Bagheri-Yarmand R , Mazumdar A , Sahin AA , Kumar R . LIM kinase 1 increases tumor metastasis of human breast cancer cells via regulation of the urokinase-type plasminogen activator system. Int. J. Cancer 118(11), 2703–2710 (2006).
- Yoshioka K , Foletta V , Bernard O , Itoh K . A role for LIM kinase in cancer invasion. Proc. Natl Acad. Sci. USA 100(12), 7247–7252 (2003).
- Singh RR , Barnes CJ , Talukder AH , Fuqua SA , Kumar R . Negative regulation of estrogen receptor alpha transactivation functions by LIM domain only 4 protein. Cancer Res. 65(22), 10594–10601 (2005).
- Montañez-Wiscovich ME , Seachrist DD , Landis MD , Visvader J , Andersen B , Keri RA . LMO4 is an essential mediator of ErbB2/HER2/Neu-induced breast cancer cell cycle progression. Oncogene 28(41), 3608–3618 (2009).
- Weinstein JN , Collisson EA , Mills GB et al. The Cancer Genome Atlas Pan-Cancer analysis project. Nat. Genet. 45(10), 1113–1120 (2013).
- Lane TF , Iruela-Arispe ML , Sage EH . Regulation of gene expression by SPARC during angiogenesis in vitro. Changes in fibronectin, thrombospondin-1, and plasminogen activator inhibitor-1. J. Biol. Chem. 267(23), 16736–16745 (1992).
- Golembieski WA , Rempel SA . cDNA array analysis of SPARC-modulated changes in glioma gene expression. J. Neurooncol. 60(3), 213–226 (2002).
- Fujita T , Shiba H , Sakata M , Uchida Y , Nakamura S , Kurihara H . SPARC stimulates the synthesis of OPG/OCIF, MMP-2 and DNA in human periodontal ligament cells. J. Oral Pathol. Med. 31(6), 345–352 (2002).