
Abstract
Aims: We compared four common methods for measuring DNA methylation levels and recommended the most efficient method in terms of cost and coverage. Materials & methods: The DNA methylation status of liver and stomach tissues was profiled using four different methods, whole-genome bisulphite sequencing (WG-BS), targeted bisulphite sequencing (Targeted-BS), methylated DNA immunoprecipitation sequencing (MeDIP-seq) and methylated DNA immunoprecipitation bisulphite sequencing (MeDIP-BS). We calculated DNA methylation levels using each method and compared the results. Results: MeDIP-BS yielded the most similar DNA methylation profile to WG-BS, with 20 times less data, suggesting remarkable cost savings and coverage efficiency compared with the other methods. Conclusion: MeDIP-BS is a practical cost-effective method for analyzing whole-genome DNA methylation that is highly accurate at base-pair resolution.
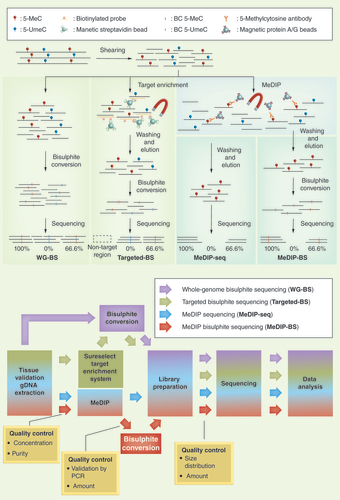
(A) Schemes of the four different NGS-based DNA methylation analysis methods included in the study. (B) Workflow of the four different methods. The quality of the MeDIP-BS library was evaluated at each step.
5-MeC: 5-methylcytosine; 5-UmeC: 5-unmethylcytosine; BC 5-MeC: Bisulphite-converted 5-methylcytosine; BC 5-UmeC: Bisulphite-converted 5-unmethylcytosine.
(A) The quality of the gDNA extracted from the L and S samples was verified and sheared to form DNA 100–500 bp fragments. (B) The MeDIP experiment was validated by PCR using four control primers. (C) The quality of the prepared libraries was determined to be acceptable for sequencing. Input: Input DNA; MeDIP’d: Methylated DNA immunoprecipitated DNA; MeDNA: Methylated DNA product; To[bp]: Upper limit of region; TSH2B: Histone cluster 1 H2ba product; unMeDNA: Unmethylated DNA product; GAPDH: Glyceraldehyde-3-phosphate dehydrogenase product.
Corr.Area: The area under the peak within the region; From[bp]: Lower limit of the region; % of Total: Percent of the total area that is defined by the start and end time markers.
![Figure 2. Quality verification of the MeDIP-BS libraries. (A) The quality of the gDNA extracted from the L and S samples was verified and sheared to form DNA 100–500 bp fragments. (B) The MeDIP experiment was validated by PCR using four control primers. (C) The quality of the prepared libraries was determined to be acceptable for sequencing. Input: Input DNA; MeDIP’d: Methylated DNA immunoprecipitated DNA; MeDNA: Methylated DNA product; To[bp]: Upper limit of region; TSH2B: Histone cluster 1 H2ba product; unMeDNA: Unmethylated DNA product; GAPDH: Glyceraldehyde-3-phosphate dehydrogenase product.Corr.Area: The area under the peak within the region; From[bp]: Lower limit of the region; % of Total: Percent of the total area that is defined by the start and end time markers.](/cms/asset/66b86ef3-2abd-4d57-88aa-1ef3d1120eaa/iepi_a_12325174_f0002.jpg)
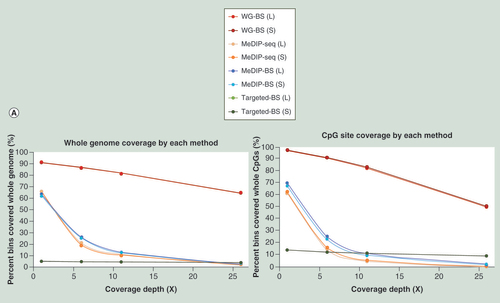
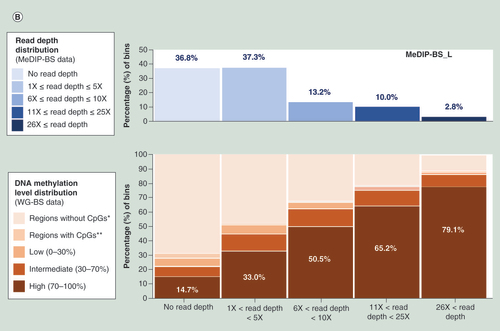
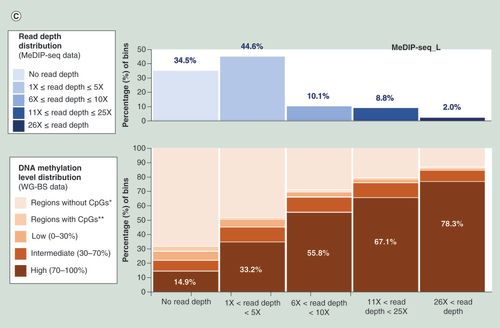
(A) Read depth distribution for each method in whole-genome bins or CpG site-containing bins. DNA methylation level distribution of WG-BS according to the read depth distribution of MeDIP-BS (B) and MeDIP-seq (C) in the L dataset.
*Regions (without CpGs) covered by WG-BS reads, but not by MeDIP-seq or MeDIP-BS reads.
**Regions (with CpGs) covered by WG-BS reads, but not by MeDIP-seq or MeDIP-BS reads.
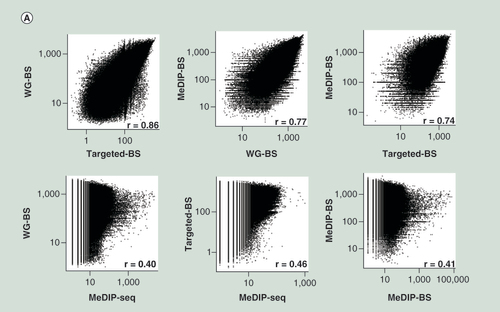
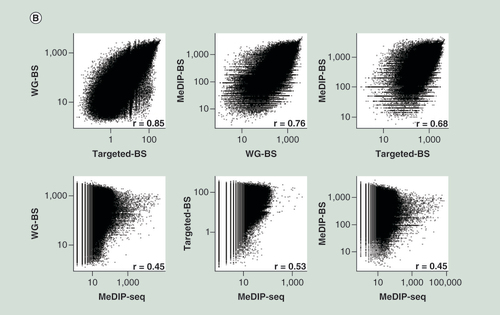
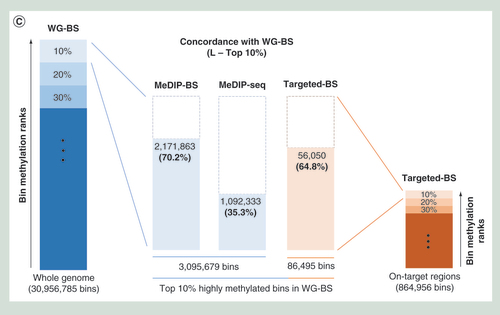
Spearman correlation analysis for L (A) and S (B) samples. The three bisulphite conversion-based methods showed relatively high correlations; however, MeDIP-seq showed very low correlation to the other methods. (C) Concordance with WG-BS. The top 10% most highly methylated bins in the L sample data for each method were compared. MeDIP-BS showed the highest concordance.
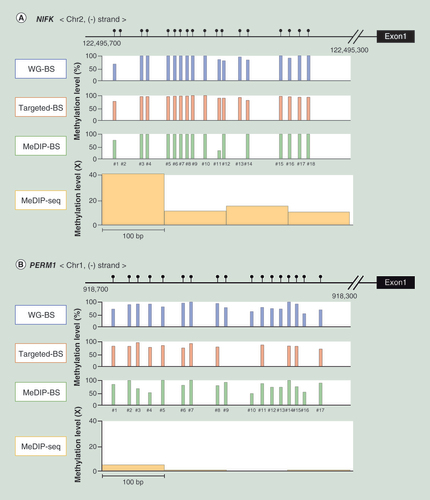
The methylation level of each CpG in these promoter regions in the L dataset was calculated for every bisulphite conversion-based method (WG-BS, targeted-BS and MeDIP-BS), and the read depth distribution was aligned at 100-bp intervals in MeDIP-seq.
First draft submitted: 9 April 2016; Accepted for publication: 24 May 2016; Published online: 8 June 2016
DNA methylation is a major epigenetic mechanism that plays important roles in various biological processes, including embryonic development, X-chromosome inactivation, transposable element repression and genomic imprinting [Citation1,Citation2]. DNA methylation is most frequently observed at the C5 position of cytosine followed by guanine (CpG site) in vertebrates, or non-CpG sites such as CHG and CHH in plants or mammalian embryonic stem cells [Citation3].
DNA methylation of promoter regions often downregulates gene expression [Citation4]. In addition, during embryogenesis and tissue differentiation, epigenetic mechanisms involving DNA methylation are crucial, and likely contribute to organ-specific gene expression [Citation4]. The genome-wide DNA methylation landscape undergoes dynamic changes during cellular differentiation, and the changes in regulatory regions are particularly remarkable [Citation5]. Thus, it is important to evaluate different DNA methylation patterns in various organs to understand diverse biologic processes such as embryogenesis, developmental processes and tissue-specific functions. Additionally, numerous studies have suggested that many diseases, including cancer, neural diseases and autoimmune diseases, could be caused by abnormal gene expression resulting from disrupted epigenetic regulation including epigenetic silencing and derepression [Citation4,Citation6,Citation7].
Several next-generation sequencing (NGS) methods have been developed to profile the DNA methylation landscape on a genome-wide scale. Bisulphite conversion and methylated region enrichment using 5-methyl cytosine antibodies or methyl-CpG binding domain (MBD) proteins are commonly used to measure genome-wide DNA methylation patterns. Whole-genome bisulphite sequencing (WG-BS) can be used to directly determine the whole-genome DNA methylation landscape through fragmentation and bisulphite conversion [Citation8]. Because WG-BS can detect 5-methyl cytosine at single-base resolution, it is considered the standard method for genome-wide DNA methylation analysis. However, WG-BS is not suitable for large-scale clinical applications, because of the huge amount of data generated. In contrast, targeted bisulphite sequencing (targeted-BS) analyzes only selected genomic regions (~84Mb for the SureSelect Human Methyl-Seq kit) where, for example, cancer tissue-specific differentially methylated regions, promoters, and CpG islands and shores are presumed to be found [Citation9]. Although this method has many advantages, including a high read depth, base-pair resolution and low cost, but never identifies any DNA methylation information from nontarget regions, which account for more than 97% of the genome and, most importantly, the vast majority of yet unknown regulatory regions. Reduced representation bisulphite sequencing (RRBS) is another widely used bisulphite sequencing method that uses MspI restriction endonuclease to enrich CpG islands and promoter regions. However, this method covers even fewer CpGs and regions than Targeted-BS [Citation10], therefore, we exclude it from our comparison study. Methylated DNA immunoprecipitation sequencing (MeDIP-seq) uses a 5-methyl cytosine antibody to capture methylated genomic DNA fragments; then, these enriched DNA fragments are sequenced and analyzed. Although this method can detect whole-genome DNA methylation levels at relatively low cost, its resolution is too low to precisely pinpoint the methylated CpG sites in the genome [Citation11,Citation12]. Recently, Weyrich et al. [Citation13] generated whole genome DNA methylation profiling data from wild guinea pig using methylated DNA-enrichment bisulphite sequencing (MEBS). This method, which combines MBD enrichment with bisulphite conversion, generated DNA methylation data with single base resolution at a reasonable cost.
In this study, we evaluated the cost and coverage efficiency of a methylated DNA immunoprecipitation bisulphite sequencing (MeDIP-BS) method that involves a combination of methylated region enrichment using 5-mC antibody and bisulphite conversion. By taking the advantage of the low cost of MeDIP-seq and the high resolution of WG-BS, this method not only remarkably improves cost–effectiveness, but also dramatically enhances analysis resolution, achieving base-pair resolution, as has been shown for MEBS. In addition, by comparing this method to WG-BS, MeDIP-Seq and Targeted-BS in analyses using human liver and stomach samples, we show that MeDIP-BS is applicable for clinical diagnostics, guaranteeing cost-effective high read depth and high-resolution genome-wide DNA methylation analysis. shows a brief outline (A) and workflow (B) for the four different NGS-based DNA methylation sequencing methods that were used in our study.
Materials & methods
Tissue sample preparation
With the approval of the Review Board Committee of Samsung Medical Center (SMC), Seoul, Korea, various tissue samples were collected from cancer patients. Among them, liver (L) and stomach (S) were collected sufficiently to perform the four different NGS-based DNA methylation sequencing methods. Therefore, we selected L and S in this study because of sample availability. For sampling of adjacent normal tissue, a minimal distance from the cancer margin to the area of the tissue from which the normal adjacent tissue was taken was 5 cm. The samples were snap frozen with liquid nitrogen, and stored at -80°C. The frozen sections for the samples were prepared and stained with hematoxylin and eosin (H&E) for validation by a pathologist (Y-L Choi) and were confirmed to satisfy the lesion criterion (Supplementary Data 1).
Genomic DNA extraction and shearing
Genomic DNA was extracted from frozen tissue samples using the DNeasy Blood & Tissue kit (QIAGEN, Hilden, Germany) and stored at -80°C. The purity and concentration of the extracted DNA were evaluated by spectrophotometry and were confirmed to meet the following criteria: concentration ≥100 ng/µl, 260/280 ratio ≥1.8 and 260/230 ratio ≥1.8 (A & Supplementary Data 2). Next, the DNA was fragmented using a CovarisTM S-series S2 Focused-ultrasonicator (Woburn, MA, USA) to the appropriate size for each method.
Target enrichment for Targeted-BS
Target regions were enriched using the SureSelect Human Methyl-Seq kit (Agilent Technologies, CA, USA) according to the manufacturer’s instructions. DNA was sheared to generate 150–200 bp fragments, hybridized to biotinylated RNA baits, which were designed to cover target regions, including CpG islands, cancer- or tissue-specific DMRs, Gencode promoters and other regulatory feature regions. Then the hybridized DNA fragments were captured by streptavidin beads, and the unhybridized DNA fragments were washed out.
Methylated DNA immunoprecipitation
Methylated DNA immunoprecipitation (MeDIP) was performed using the MagMeDIP kit (Diagenode, NJ, USA) according to the manufacturer’s instructions. First, gDNA was sheared to produce 200–500 bp fragments. Next, 1 µg of fragmented gDNA was mixed with Magbeads and 5mC antibody in IP solution. The mixture was incubated on a 4°C rotator for 16 h. The following day, the gDNA-bead-antibody complexes were washed three times with MagWash buffer. The immunopreciptated DNA fragments were eluted with 100 µl of DIB buffer containing 1 µl of proteinase K at 55°C for 15 min and then incubated at 100°C for 15 min. The concentration was determined using a Qubit fluorometer 2.0 with the Qubit ssDNA Assay kit (Invitrogen, CA, USA). Eight IPs were conducted for each sample to generate a sufficient amount of methylated DNA fragments, and the volume of the immunoprecipitated DNA was reduced to 20 µl by ethanol precipitation. The amount of captured DNA was greater than 50 ng.
Bisulphite conversion
Sheared genomic DNA (for WG-BS) or enriched DNA (for Targeted-BS and MeDIP-BS) was treated with sodium bisulphite to convert unmethylated cytosine to uracil. Bisulphite conversion was performed using the EZ DNA Methylation-Lightning kit (Zymo Research, CA, USA) according to the manufacturer’s instructions [Citation14]. Next, 20 µl of DNA obtained by each method was mixed with 130 µl of Lightning Conversion Reagent and incubated at 98°C for 8 min and then at 54°C for 60 min. After incubation, 600 µl of M-binding buffer was added to the mixture, and the mixture was transferred to a Zymo-Spin column. After centrifugation, the column was washed with 100 µl of M-wash Buffer and incubated with 200 µl of L-desulphonation buffer for 20 min. After two more wash steps, the bisulphite-converted DNA was eluted from the column using 11 µl of M-elution buffer.
Library preparation
Libraries were prepared using an EpiGnome Methyl-Seq Kit (Epicentre Biotechnologies, WI, USA) according to the manufacturer’s instructions [Citation15]. First, the DNA synthesis primer was annealed to the bisulphite-converted DNA, and the DNA was copied using epigenome polymerase. The primer was digested with Exonuclease I, and the 3′ end of the cDNA was continuously tagged with a Terminal-Tagging Oligo. After the di-tagged cDNA was purified using the Agencourt AMPure XP system (Beckman Coulter, CA, USA), it was amplified by polymerase chain reaction (PCR). Finally, the amplified di-tagged cDNA was purified and the quality of the library was analyzed using a 2100 Bioanalyzer (Agilent).
Quality analysis of the MeDIP-BS library
The quality of the extracted DNA was evaluated, and the DNA was sheared into 100–500-bp fragments (A). For WG-BS, the sheared DNA was directly treated with sodium bisulphite, and for Targeted-BS, the DNA underwent a target enrichment step before bisulphite conversion. For MeDIP-seq and MeDIP-BS, we performed a methylated DNA region enrichment step, and then verified the accuracy of the MeDIP experiment. Methyl-cytosine-enriched DNA fragments were confirmed by PCR using four control primer pairs (two positive control primers, MeDNA and TSH2B, and two negative control primers, unMeDNA and GAPDH). The results indicated that immunoprecipitated DNA fragments were amplified in the positive control PCR, which targets highly methylated regions, but not in the negative control PCR, which targets unmethylated regions (B). After confirmation, the MeDIP-seq library was directly prepared using the enriched DNA samples. However, for MeDIP-BS, the bisulphite conversion step was conducted before the library preparation in order to convert unmethylated cytosine to uracil. Finally, we confirmed that in the two MeDIP-BS libraries, the DNA fragment size distribution was suitable (150–500 bp) and the amount of DNA was sufficient to perform massively parallel sequencing (C).
Sequencing
Sequencing was performed using the Illumina HiSeq 2000 platform.
Data analysis
All cleaned raw data were mapped to the hg19 reference genome. For bisulphite-converted data, Bismark aligner [Citation16] was used, and for MeDIP-seq data, Bowtie2 aligner [Citation17] was used. To estimate the coverages generated by the different methods, the mapping results from the three methods (except Targeted-BS) within each 100-bp binning window of the hg19 reference genome were compared using BEDTools [Citation18]. Reads generated by Targeted-BS were mapped to the targeted region.
To compare the methods, we calculated the methylation levels within each 100-bp bin because of the low resolution of MeDIP-seq. In order to measure 100bp bin-wise methylation level from the MeDIP-seq data, we performed CpG-density normalization process. Since MeDIP-seq utilizes affinity-based methylated read capturing method, the possibility of capturing methylated reads is increase when the number of CpG sites increase. We counted number of CpG site within each 100bp bins and based on the measured CpG density count, each bin wise read counts is normalized to obtain CpG density normalized methylation levels. For bisulphite-treated data, each CpG site methylation level was measured using the methylation extractor embedded in Bismark and was assigned to 100-bp bins. Since read depths generated by the enrichment-based MeDIP-seq method represented methylation intensities, methylation levels were directly calculated from the read counts of the 100-bp bins. First, Spearman’s rank correlation coefficient was used to compare the whole 100-bp bin methylation level of each pair of methods. Next, for the purpose of comparison among the four methods, we sorted all bins by ordering them according to methylation level in decreasing order. Because MeDIP-seq favors capturing highly methylated regions, the four methods should be compared using bins with equivalent or similar average methylation levels. Therefore, matched bins with equivalent or similar average methylation levels used for comparison between different methods may occupy the same genomic region or different genomic regions. The concordance rate was calculated as follows: (the number of highly methylated bins in WG-BS and the other method together/the number of highly methylated bins in WG-BS) × 100 (%). A comparison of methods was performed for the top 10, 20 and 30% of the highly methylated bins.
Results
Comparison of mapping rates & read depth distributions
The sequencing reads generated by all four methods (WG-BS, Targeted-BS, MeDIP-seq and MeDIP-BS) were mapped to the human reference sequence (hg19). As expected, WG-BS produced the highest number (1.5–1.6 billion) of raw reads, while MeDIP-BS produced the lowest number (60–80 million) of raw reads. This gap in data amount between two methods leads to a very big difference in the costs of performing NGS and analyzing the data. However, the mapping rates of the WG-BS and MeDIP-BS reads were similar, ranging from approximately 60–70%. Due to uncertainty whether sequenced thymine is originated from existing thymine or unmethylated cytosine, the MeDIP-BS mapping rate seemed to be slightly lower than the MeDIP-seq mapping rate () [Citation19]. On the other hand, Targeted-BS showed a relatively high unique mapping rate (over 80%), which appeared to be attributable to reads being mapped only to targeted regions.
The coverages of the four methods were calculated within windows binned over the whole genome, all CpG sites and target regions (in this case, only for Targeted-BS). The results showed that WG-BS reads covered more than 90% of the whole genome, and 64% of the whole genome was mapped with over 26-fold read depth. The MeDIP-seq and MeDIP-BS results showed lower coverage ranges than WG-BS, and the overall read depth distribution of MeDIP-BS was similar to that of MeDIP-seq, suggesting that the methylated DNA immunoprecipitation was properly performed and that these two methods sequenced only methylated DNA regions ( & A).
Using the DNA methylation level distribution data from the bins in WG-BS and calculating the methylation level distribution among bins belonging to each interval (no read depth, 1–5-fold read depth, 6–10-fold read depth, 11–25-fold read depth and over 25-fold read depth, respectively) of the read depth distribution for sample L by MeDIP-BS, we found that MeDIP-BS did not capture 14.7% of the high methylation-level bins (methylation level: 70–100%), approximately 8% of intermediate methylation-level bins (methylation level: 30–70%) and ~6% of low methylation-level bins (methylation level: 0–30%; B). The tendency was also observed for the results of MeDIP-seq (C) and the S sample (Supplementary Data 3). This deficiency may be fixed by developing new antibodies with better affinity to 5-methyl cytosine and thereby improving the efficiency of the immunoprecipitation step in this research field in the future. Despite this deficiency, the percentage of high methylation-level bins captured for each read depth interval gradually increased according to read depth. Thus, the high methylation-level bins constituted a major portion of the bins for the high read depth intervals (11- to 25-fold and over 26-fold; B & C, & Supplementary Data 4). This indicates that the MeDIP method worked well in this study.
Comparison of the genome-wide DNA methylation levels measured by different methods
It is difficult to directly compare the DNA methylation level measured by MeDIP-seq with the levels measured by other bisulphite conversion-based methods which analyze the DNA methylation level at each CpG site, because the MeDIP-seq method cannot analyze the DNA methylation level at a single CpG site. To overcome this, we divided the whole human genome sequence into 100-bp bins and calculated the DNA methylation level within each bin. For MeDIP-seq, the read depth of each bin directly reflects its DNA methylation level. In this study, 5-methyl CpGs containing bins analyzed by WG-BS, Targeted-BS and MeDIP-BS covered approximately 50, approximately 2.8 and over 30% of the whole genome, respectively (Supplementary Data 4). In addition, we ranked each bin based on the methylation level measured by each method, and compared the top 10% most highly methylated bins among the four methods. In doing so, we used the WG-BS result as a standard for assessing the other three methods.
Spearman correlation analysis of the methylation levels of all bins measured by different methods showed that among WG-BS, MeDIP-BS and Targeted-BS, the correlations were significantly high (r = 0.86 in L and r = 0.85 in S between WG-BS and Targeted-BS, r = 0.77 in L and r = 0.76 in S between MeDIP-BS and WG-BS, and r = 0.74 in L and r = 0.68 in S between MeDIP-BS and Targeted-BS; A & B). In contrast, the correlations between MeDIP-seq and the other three methods were lower (r = 0.40–0.53).
In order to gain deeper insights into the low correlations between MeDIP-seq and the other three methods, we compared the bins with highest methylation levels among the four methods (Supplementary Data 5). In our analysis of concordance for the top 10% most highly methylated bins from each of the three methods (the L sample) compared with WG-BS, the method showing the best match was MeDIP-BS (70.2%). The concordance rate for Targeted-BS was 64.8%, and the concordance rate for MeDIP-seq was 35.3% (C). We also compared the top 10, 20 and 30% most highly methylated bins from each method (L and S samples) and found that this tendency was maintained, and the concordance rates for MeDIP-BS and Targeted-BS were similar for the top 20 and 30% bins (Supplementary Data 5C). These results showed that the addition of a bisulphite conversion step to the MeDIP-seq method dramatically improved the quality of the genome-wide DNA methylation analysis and explained why the correlations (A) between the methylation levels measured by MeDIP-seq and those measured by the other three methods are very low.
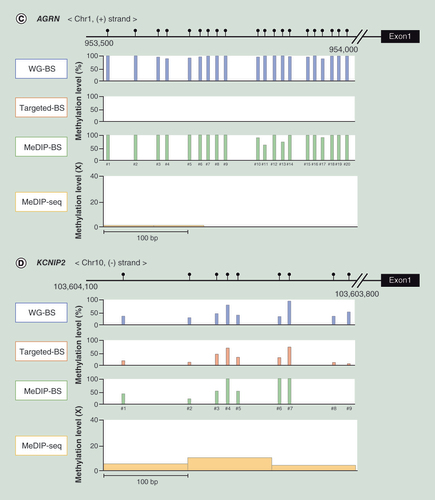
To visualize the methylation analysis resolution measured by the four methods, we analyzed the methylation levels at CpG sites in the densely methylated promoter regions of NIFK (A), PERM1 (B) and AGRN (C), and in the less densely methylated promoter region of KCNIP2 (D). As shown in , the methylation levels at the CpG sites in the highly and less densely methylated promoter regions were very similar in WG-BS, Targeted-BS and MeDIP-BS, whereas the methylation levels measured by MeDIP-seq were dissimilar, and the resolution was low. In addition, Targeted-BS could not measure the methylation level in the promoter region of AGRN, as it is a nontargeted region, demonstrating its limitations for methylation analysis compared with the nonregionally limited analyses of WG-BS, MeDIP-seq and MeDIP-BS.
Discussion
Epigenetic mechanisms regulate the expression of essential genes involved in diverse biological processes such as cell development, differentiation and tissue-specific phenotyping. In particular, DNA methylation is closely associated with gene expression regulation, and it is well-known that aberrant DNA methylation may contribute to the occurrence of various diseases such as heart disease [Citation20], Alzheimer’s disease [Citation21] and cancer [Citation22,Citation23]. The development of NGS technology has accelerated genetics and epigenetics research, concomitantly advancing the development of diverse DNA methylation analysis technologies. There are various DNA methylation analysis methods based on NGS, which can be generally categorized into two styles, depending on whether they contain bisulphite conversion or DNA methylation enrichment. Each method has its pros and cons, which should be carefully considered by researchers in selecting the optimal methylation analysis method for their research purposes.
Even though several studies have compared diverse NGS-based DNA methylation analysis methods [Citation8,Citation11,Citation24–26], none have compared the MeDIP-BS with other methods. In this study, we demonstrated that MeDIP-BS reduces cost and coverage, and improves analysis resolution by combining MeDIP with a bisulphite conversion step. Although MBD is also widely used for methylated DNA enrichment, it was reported that both MeDIP and MBD successfully enrich methylated regions showing more than 99% concordance [Citation11,Citation25]. However, MeDIP is more sensitive to the low dense CpG regions and exhibits a slightly more uniform read distribution than MBD [Citation11,Citation27]. We think that an even read distribution is more suitable for calculating CpG site methylation level, so we selected MeDIP for this study. For Targeted-BS method, two kits are generally used, the SureSelect Human Methyl-Seq kit and SeqCap Epi Enrichment kit. Although the SeqCap Enrichment kit covers more CpGs than the SureSelect Human Methyl-Seq kit [Citation10], we selected SureSelect Human Methyl-Seq kit because of its similarity to MeDIP-BS in terms of the experimental procedure. For both MeDIP-BS and the SureSelect Human Methyl-Seq kit, bisulphite conversion is performed after enrichment; therefore, we concluded that the SureSelect Human Methyl-Seq kit is more suitable for comparison to MeDIP-BS. The main features of the four methods in this study are summarized in . MeDIP and MeDIP-BS require more DNA than the others, but this amount can be decreased by using a recently released library preparation kit, which requires only a small amount of DNA.
In our sequencing effort, we generated over 960 million of WG-BS mapped reads: a sufficient quantity to guarantee the reliability of the WG-BS results, which require more than 800 million aligned reads [Citation28]. However, the number of MeDIP-BS mapped reads was approximately 50 million, which was nearly twenty times fewer than the number of WG-BS mapped reads (), and the cost for library preparation and sequencing were approximately three times cheaper than that for WG-BS (). As the cost of data storage and analysis increases drastically as the amount of sequencing data increases [Citation29], the overall cost of performing MeDIP-BS and analyzing the data is significantly cheaper than the cost of WG-BS. MeDIP-seq has reduced number of required reads and is free from the weaknesses of bisulphite conversion, such as DNA damage or incomplete conversion. Moreover, the lower mapping rate of MeDIP-BS compared with the MeDIP-seq is attributable to the bisulphite conversion step. Although the lower mapping rate is an issue not only for MeDIP-BS but also for all methylation analysis methods with a bisulphite conversion step, the DNA methylation-level concordance rate between MeDIP-BS and WG-BS was significantly higher than that of MeDIP-seq and WG-BS ( & Supplementary Data 5). This suggests that bisulphite conversion after enrichment of methylated DNA fragments with 5-methylcytosine antibodies could dramatically improve the accuracy of DNA methylation-level analysis.
Although Targeted-BS is the most suitable method in terms of cost and accuracy to meet the requirements of researchers for analyzing targeted genomic regions such as promoter regions, it cannot be applied to providing insight into the methylation landscape of nontargeted genomic regions [Citation30–32]. In contrast, MeDIP-BS analyses methylated DNA regions across the whole genome, consequently improving cost–effectiveness and guaranteeing accurate genome-wide methylation analysis at base-pair resolution. Although some methylated regions are missing from the MeDIP-BS and MeDIP-seq data, showing that it is not a perfect method (B & C), the concordance rate of the DNA methylation levels of the bins from MeDIP-BS and WG-BS was significantly higher than that from MeDIP-seq and WG-BS, especially for the top 10, 20 and 30% most highly methylated bins ( & Supplementary Data 5). The lower concordance rate for MeDIP-seq is mainly attributable to its low resolution for analyzing DNA methylation levels.
Discovering novel biomarkers for diagnosis or therapy in refractory cancers is an urgent issue in cancer therapy, and it requires genomic/epigenomic alteration data from numerous cancer patients. Furthermore, clinical validation of candidate marker requires even more data than the discovery step. Many global projects for establishing cancer genomic/epigenomic database are ongoing; however, much of the DNA methylation data were generated by reduced representation methods, such as RRBS or Targeted-BS. For this reason, we strongly recommend the MeDIP-BS method to clinical researchers attempting to analyze genome-wide DNA methylation status with deep read depth at base-pair resolution for numerous clinical samples in a cost-efficient way.
Conclusion
Both epigenomics and NGS are the latest fields that have rapidly advanced in recent years, and numerous NGS-based genome-wide DNA methylation studies will likely be performed in the future. However, despite the dramatic decrease in the cost of genome-wide variation analyses as a result of the development of NGS technologies, large-scale, genome-wide DNA methylation analyses are still challenging due to the high cost of WG-BS. In this study, we demonstrated that MeDIP-BS is a cost and coverage-effective method for analyzing genome-wide DNA methylation, yielding results with single-base resolution and high concordance with WG-BS DNA methylation results, efficiently overcoming the liabilities of MeDIP-seq.
In conclusion, we suggest MeDIP-BS as a practical method for researchers who bear the burden of the high cost of WG-BS for determining the genome-wide DNA methylation status of large quantities of samples at base-pair resolution.
Table 1. Summary of the mapping results and read depth distributions for the four different methods.
Table 2. The features of the four NGS based DNA methylation sequencing methods.
DNA methylation is a key epigenetic mechanism involved in the regulation of various biological processes and the causation of diverse diseases. NGS-based analysis is the latest technology for profiling genome-wide DNA methylation.
Traditionally, there were various NGS-based methylation analysis methods, which are divided into two main types. One type includes a bisulphite conversion step (e.g., WG-BS and Targeted-BS) and the other includes methylated region enrichment step (e.g., MeDIP-seq).
Because each method has its merits and faults, it is necessary to choose the proper method for each research purpose. Although WG-BS has been considered the standard method until now, its cost is still prohibitive. Therefore, it is necessary to find an alternative new method for cost-effective analysis of the whole-genome DNA methylation patterns of a large cohort of clinical samples at base-pair resolution.
In this study, we evaluated the effectiveness of MeDIP-BS in terms of cost and coverage by comparing it to other generally used methods (WG-BS, Targeted-BS and MeDIP-seq).
The results generated by MeDIP-BS and MeDIP-seq showed similar read depth distribution patterns, and for both methods, the portion of highly methylated regions gradually increased according to read depth. Moreover, most of the unmapped regions in both methods contained no CpG and nonmethylated CpG sites, suggesting that MeDIP successfully enriched the methylated regions.
Compared to MeDIP-seq, the genome-wide DNA methylation level pattern results generated by MeDIP-BS showed a much stronger correlation with the pattern results generated by WG-BS.
We suggest MeDIP-BS as a practical, cost-effective, alternative method for analyzing the whole-genome DNA methylation of large numbers of clinical tissue samples with high accuracy at base-pair resolution.
Ethical conduct of research
The authors state that they have obtained appropriate institutional review board approval or have followed the principles outlined in the Declaration of Helsinki for all human or animal experimental investigations. In addition, for investigations involving human subjects, informed consent has been obtained from the participants involved.
Supplemental Figure 1
Download TIFF Image (2.6 MB)Supplemental Figure 2
Download TIFF Image (1.4 MB)Supplemental Figure 3
Download TIFF Image (1.6 MB)Supplemental Figure 4
Download TIFF Image (1.6 MB)Supplemental Figure 5
Download MS Excel (15.4 KB)Supplemental Figure 6
Download TIFF Image (2.1 MB)Acknowledgements
The authors thank Seong Beom Cho for his support and discussion of the data.
Supplementary data
To view the supplementary data that accompany this paper please visit the journal website at:www.tandfonline.com/doi/full/10.2217/epi-2016-0038
Financial & competing interests disclosure
This research was supported by a fund (2014-E72002–00 [Yoon-La Choi]) by Research of Korea Centers for Disease Control and Prevention, and the Bio & Medical Technology Development Program of the National Research Foundation (NRF) (2012M3A9D1054622 [S Kim]), R&D Program for Society of the NRF (2013M3C8A1079312 [YK Shin]) funded by the Ministry of Science, ICT & Future Planning. The authors have no other relevant affiliations or financial involvement with any organization or entity with a financial interest in or financial conflict with the subject matter or materials discussed in the manuscript apart from those disclosed.
Writing and editing assistance were provided by Editage (https://www.editage.com).
Additional information
Funding
References
- Jones PA . Functions of DNA methylation: islands, start sites, gene bodies and beyond . Nat. Rev. Genet.13 ( 7 ), 484 – 492 ( 2012 ).
- Day JJ , SweattJD . Epigenetic mechanisms in cognition . Neuron70 ( 5 ), 813 – 829 ( 2011 ).
- Pinney SE . Mammalian non-CpG methylation: stem cells and beyond . Biology3 ( 4 ), 739 – 751 ( 2014 ).
- Jeong HM , KwonMJ , ShinYK . Overexpression of cancer-associated genes via epigenetic derepression mechanisms in gynecologic cancer . Front. Oncol.4 , 12 ( 2014 ).
- Slieker RC , RoostMS , Van IperenLet al. DNA methylation landscapes of human fetal development . PLoS Genet.11 ( 10 ), e1005583 ( 2015 ).
- Jakovcevski M , AkbarianS . Epigenetic mechanisms in neurological disease . Nat. Med.18 ( 8 ), 1194 – 1204 ( 2012 ).
- Zhang Z , ZhangR . Epigenetics in autoimmune diseases: pathogenesis and prospects for therapy . Autoimmunity Rev.14 ( 10 ), 854 – 863 ( 2015 ).
- Li N , YeM , LiYet al. Whole genome DNA methylation analysis based on high throughput sequencing technology . Methods (San Diego, Calif.)52 ( 3 ), 203 – 212 ( 2010 ).
- Lee EJ , LuoJ , WilsonJM , ShiH . Analyzing the cancer methylome through targeted bisulfite sequencing . Cancer Lett.340 ( 2 ), 171 – 178 ( 2013 ).
- Sun Z , CunninghamJ , SlagerS , KocherJP . Base resolution methylome profiling: considerations in platform selection, data preprocessing and analysis . Epigenomics7 ( 5 ), 813 – 828 ( 2015 ).
- Harris RA , WangT , CoarfaCet al. Comparison of sequencing-based methods to profile DNA methylation and identification of monoallelic epigenetic modifications . Nat. Biotechnol.28 ( 10 ), 1097 – 1105 ( 2010 ).
- Clark C , PaltaP , JoyceCJet al. A comparison of the whole genome approach of MeDIP-Seq to the targeted approach of the Infinium HumanMethylation450 BeadChip(®) for methylome profiling . PLoS ONE7 ( 11 ), e50233 ( 2012 ).
- Weyrich A , SchullermannT , HeegerFet al. Whole genome sequencing and methylome analysis of the wild guinea pig . BMC Genomics15 , 1036 ( 2014 ).
- Holmes EE , JungM , MellerSet al. Performance evaluation of kits for bisulfite-conversion of DNA from tissues, cell lines, FFPE tissues, aspirates, lavages, effusions, plasma, serum, and urine . PLoS ONE9 ( 4 ), e93933 ( 2014 ).
- Khanna A , CzyzA , SyedF . EpiGnome[trade] Methyl-Seq Kit: a novel post-bisulfite conversion library prep method for methylation analysis . Nat. Methods10 ( 10 ), ( 2013 ).
- Krueger F , AndrewsSR . Bismark: a flexible aligner and methylation caller for Bisulfite-Seq applications . Bioinformatics (Oxford, England)27 ( 11 ), 1571 – 1572 ( 2011 ).
- Langmead B , SalzbergSL . Fast gapped-read alignment with Bowtie 2 . Nat. Methods9 ( 4 ), 357 – 359 ( 2012 ).
- Quinlan AR , HallIM . BEDTools: a flexible suite of utilities for comparing genomic features . Bioinformatics (Oxford, England)26 ( 6 ), 841 – 842 ( 2010 ).
- Kurdyukov S , BullockM . DNA methylation analysis: choosing the right method . Biology5 ( 1 ), pii: E3 ( 2016 ).
- Serra-Juhe C , CuscoI , HomsA , FloresR , ToranN , Perez-JuradoLA . DNA methylation abnormalities in congenital heart disease . Epigenetics10 ( 2 ), 167 – 177 ( 2015 ).
- De Jager PL , SrivastavaG , LunnonKet al. Alzheimer’s disease: early alterations in brain DNA methylation at ANK1, BIN1, RHBDF2 and other loci . Nature Neurosci.17 ( 9 ), 1156 – 1163 ( 2014 ).
- Paska AV , HudlerP . Aberrant methylation patterns in cancer: a clinical view . Biochem. Med.25 ( 2 ), 161 – 176 ( 2015 ).
- Gyorffy B , BottaiG , FleischerTet al. Aberrant DNA methylation impacts gene expression and prognosis in breast cancer subtypes . Int. J. Cancer138 ( 1 ), 87 – 97 ( 2016 ).
- Walker DL , BhagwateAV , BahetiSet al. DNA methylation profiling: comparison of genome-wide sequencing methods and the InfiniumHuman Methylation 450 Bead Chip . Epigenomics7 ( 8 ), 1287 – 1302 ( 2015 ).
- Bock C , TomazouEM , BrinkmanABet al. Quantitative comparison of genome-wide DNA methylation mapping technologies . Nat. Biotechnol.28 ( 10 ), 1106 – 1114 ( 2010 ).
- Robinson MD , StathamAL , SpeedTP , ClarkSJ . Protocol matters: which methylome are you actually studying?Epigenomics2 ( 4 ), 587 – 598 ( 2010 ).
- Robinson MD , StirzakerC , StathamALet al. Evaluation of affinity-based genome-wide DNA methylation data: effects of CpG density, amplification bias, and copy number variation . Genome Res.20 ( 12 ), 1719 – 1729 ( 2010 ).
- Ziller MJ , HansenKD , MeissnerA , AryeeMJ . Coverage recommendations for methylation analysis by whole-genome bisulfite sequencing . Nat. Methods12 ( 3 ), 230 – 232 , 231 p following 232 ( 2015 ).
- Muir P , LiS , LouSet al. The real cost of sequencing: scaling computation to keep pace with data generation . Genome Biol.17 ( 1 ), 53 ( 2016 ).
- Rauscher GH , KresovichJK , PoulinMet al. Exploring DNA methylation changes in promoter, intragenic, and intergenic regions as early and late events in breast cancer formation . BMC Cancer15 , 816 ( 2015 ).
- Lev Maor G , YearimA , AstG . The alternative role of DNA methylation in splicing regulation . Trends Genet.31 ( 5 ), 274 – 280 ( 2015 ).
- Liyanage VR , JarmaszJS , MurugeshanN , Del BigioMR , RastegarM , DavieJR . DNA modifications: function and applications in normal and disease states . Biology3 ( 4 ), 670 – 723 ( 2014 ).