
Abstract
Aim: Exposure to opioids has been associated with epigenetic effects. Studies in rodents suggested a role of varying degrees of DNA methylation in the differential regulation of μ-opioid receptor expression across the brain. Methods: In a translational investigation, using tissue acquired postmortem from 21 brain regions of former opiate addicts, representing a human cohort with chronic opioid exposure, μ-opioid receptor expression was analyzed at the level of DNA methylation, mRNA and protein. Results & conclusion: While high or low μ-opioid receptor expression significantly correlated with local OPRM1 mRNA levels, there was no corresponding association with OPRM1 methylation status. Additional experiments in human cell lines showed that changes in DNA methylation associated with changes in μ-opioid expression were an order of magnitude greater than differences in brain. Hence, different degrees of DNA methylation associated with chronic opioid exposure are unlikely to exert a major role in the region-specificity of μ-opioid receptor expression in the human brain.
First draft submitted: 21 June 2016; Accepted for publication: 16 September 2016; Published online: 28 September 2016
(A) [3H]-DAMGO saturation binding at the three selected brain areas (framed in the matrix plot below) thalamus medialis, basolateral amygdala and nucleus pontis (means and SDs). The number of μ-opioid receptors (Bmax) was calculated by fitting a nonlinear model (lines) to the data as: B([3H]DAMGO) = (Bmax([3H]DAMGO) · F([3H]DAMGO))/(KD([3H]DAMGO) + F([3H]DAMGO)), where B([3H]DAMGO) denotes the concentration of μ-opioid receptor bound [3H]DAMGO (specific binding), F([3H]DAMGO) the concentration of the free [3H]DAMGO, Bmax([3H]DAMGO) the maximum number of [3H]DAMGO binding sites (μ-opioid receptor density) and KD([3H]DAMGO) the equilibrium dissociation constant of [3H]DAMGO. (B) Matrix plot of the Bmax values indicating μ-opioid receptor expression observed in the 21 brain areas of 27 subjects. Cells are color coded from red to yellow according to opioid receptor expression, with red indicating lowest and yellow indicating highest expression and white cells indicate missing data.
([3H]DAMGO): 3H-[D-Ala2,N-MePhe4,Gly-ol5]-enkephalin; B([3H]-DAMGO): The concentration of μ-opioid receptor bound [3H]-DAMGO (specific binding); Bmax([3H]-DAMGO): The maximum number of [3H]-DAMGO binding sites (μ-opioid receptor density); F([3H]-DAMGO): The concentration of the free [3H]-DAMGO; KD([3H]-DAMGO): The equilibrium dissociation constant of [3H]-DAMGO; Bmax: The number of μ-opioid receptors.
![Figure 1. Expression of μ-opioid receptors across 21 different human brain regions, analyzed from tissue acquired postmortem from 27 former heroin addicts. (A) [3H]-DAMGO saturation binding at the three selected brain areas (framed in the matrix plot below) thalamus medialis, basolateral amygdala and nucleus pontis (means and SDs). The number of μ-opioid receptors (Bmax) was calculated by fitting a nonlinear model (lines) to the data as: B([3H]DAMGO) = (Bmax([3H]DAMGO) · F([3H]DAMGO))/(KD([3H]DAMGO) + F([3H]DAMGO)), where B([3H]DAMGO) denotes the concentration of μ-opioid receptor bound [3H]DAMGO (specific binding), F([3H]DAMGO) the concentration of the free [3H]DAMGO, Bmax([3H]DAMGO) the maximum number of [3H]DAMGO binding sites (μ-opioid receptor density) and KD([3H]DAMGO) the equilibrium dissociation constant of [3H]DAMGO. (B) Matrix plot of the Bmax values indicating μ-opioid receptor expression observed in the 21 brain areas of 27 subjects. Cells are color coded from red to yellow according to opioid receptor expression, with red indicating lowest and yellow indicating highest expression and white cells indicate missing data.([3H]DAMGO): 3H-[D-Ala2,N-MePhe4,Gly-ol5]-enkephalin; B([3H]-DAMGO): The concentration of μ-opioid receptor bound [3H]-DAMGO (specific binding); Bmax([3H]-DAMGO): The maximum number of [3H]-DAMGO binding sites (μ-opioid receptor density); F([3H]-DAMGO): The concentration of the free [3H]-DAMGO; KD([3H]-DAMGO): The equilibrium dissociation constant of [3H]-DAMGO; Bmax: The number of μ-opioid receptors.](/cms/asset/31929301-ff23-4a0c-9619-bf27716c791e/iepi_a_12325092_f0001.jpg)
(A) Shows a projection of the log-transformed 21 × 27 Bmax matrix onto a toroid neuronal grid where opposite edges are connected and using large numbers of nodes (4100). The dots indicate the so-called ‘best matching units’ of the self-organizing map, which are those neurons whose weight vector is most similar to the input. Neurons of the original 50 × 82 grid that do not match any input respectively brain regions are omitted. To the BMUs, the brain regions represented by them are annotated. The BMUs are colored according to the obtained classification respectively clustering of the data space. This cluster structure emerged from visualization of the distances between neurons in the high-dimensional space by means of a U-Matrix [Citation22]. The U-Matrix was cut from a tiled display of the emergent self-organizing map to remove duplicate representation of the data. It was colored as a geographical map with brown or snow-covered heights and green valleys. Thus, valleys indicate clusters of similar brain regions. The watersheds of the U-Matrix indicate borderlines of clusters, which can be seen on the 3D-display of U-matrix shown below the (A) and which can be used as a haptic presentation of high-dimensional data by means of 3D-printing [Citation43]. Between (A) and 3D views of the U*-matrix (B), the cluster differences with respect to the Bmax values are shown as box and whisker plot constructed using the minimum, quartiles, median (solid horizontal line within the box) and maximum of the data, with the notches displaying a confidence interval around the median. The boxes are colored according to the BMUs cluster coloring in the self-organizing map.
BMU: Best matching unit.
![Figure 2. Pattern of μ-opioid receptor expression across 21 pain and addiction relevant areas of the human brain, analyzed from tissue acquired postmortem from 27 former heroin addicts. (A) Shows a projection of the log-transformed 21 × 27 Bmax matrix onto a toroid neuronal grid where opposite edges are connected and using large numbers of nodes (4100). The dots indicate the so-called ‘best matching units’ of the self-organizing map, which are those neurons whose weight vector is most similar to the input. Neurons of the original 50 × 82 grid that do not match any input respectively brain regions are omitted. To the BMUs, the brain regions represented by them are annotated. The BMUs are colored according to the obtained classification respectively clustering of the data space. This cluster structure emerged from visualization of the distances between neurons in the high-dimensional space by means of a U-Matrix [Citation22]. The U-Matrix was cut from a tiled display of the emergent self-organizing map to remove duplicate representation of the data. It was colored as a geographical map with brown or snow-covered heights and green valleys. Thus, valleys indicate clusters of similar brain regions. The watersheds of the U-Matrix indicate borderlines of clusters, which can be seen on the 3D-display of U-matrix shown below the (A) and which can be used as a haptic presentation of high-dimensional data by means of 3D-printing [Citation43]. Between (A) and 3D views of the U*-matrix (B), the cluster differences with respect to the Bmax values are shown as box and whisker plot constructed using the minimum, quartiles, median (solid horizontal line within the box) and maximum of the data, with the notches displaying a confidence interval around the median. The boxes are colored according to the BMUs cluster coloring in the self-organizing map.BMU: Best matching unit.](/cms/asset/32c143fc-1f3e-47d5-a9fa-2d0c284df256/iepi_a_12325092_f0002.jpg)
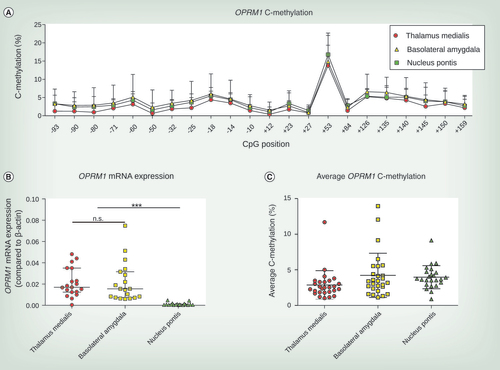
(A) C-methylation profile across OPRM1 gene from CpG position -93 to +159. Mean and SD from 24 to 27 brain tissue samples are shown. (B) OPRM1 mRNA expression compared with β-actin differed in brain tissue of thalamus medialis, basolateral amygdala and nucleus pontis (Kruskal–Wallis χ2 = 34.81, df = 2, p < 2.8 × 10⁻⁸). Whereas thalamus medialis and basolateral amygdala showed no differences in OPRM1 mRNA expression, both regions significantly showed significantly higher OPRM1 mRNA expression levels than those found in nucleus pontis (Dunn’s tests: ***p < 0.001, n.s.). Experiments were conducted from 19 brain tissue samples and median and interquartile ranges are shown. (C) Average OPRM1 C-methylation of thalamus medialis, basolateral amygdala and nucleus pontis. Median and interquartile ranges are shown conducted from 24 to 27 brain tissue samples for each brain region.
n.s.: Not significant.
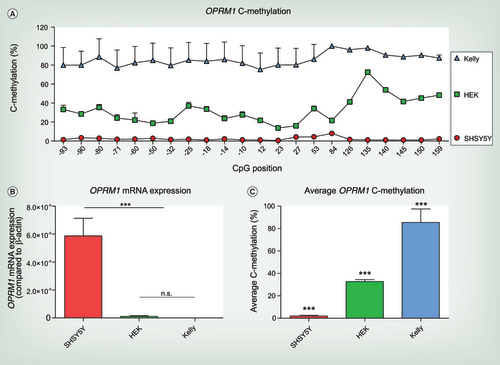
(A) C-methylation profile across OPRM1 gene from CpG position -93 to +159. Significant differences between different cell lines were assessed using rm-ANOVA with ‘CpG position’ as within-subject factor and cell type as between-subjects factor (main effect ‘cell line’ df = 2, F = 192.2, p = 2.04 × 10⁻¹¹ and ‘CpG position’ df = 20, F = 28.015, p = 1.4 × 10⁻⁵ and a significant interaction ‘cell line’ by ‘CpG position’ df = 40, F = 13.455, p = 9.5 × 10⁻⁵). (B) OPRM1 mRNA expression of the untreated cell lines SHSY5Y, HEK-293 and Kelly. OPRM1 mRNA expression is significantly higher in SHSY5Y cells compared with HEK-293 and Kelly cells, that do not express μ-opioid receptors (one-way ANOVA df = 2, F = 63.72, p < 0.0001; n.s. no significant difference between HEK-293 and Kelly cells, ***p < 0.001 for both HEK-293 and Kelly vs SHSY5Y). OPRM1 mRNA expression compared with β-actin from three independent samples are shown as mean ± SD. (C) Average OPRM1 C-methylation of SHSY5Y, HEK-293 and Kelly cells. Significant differences between the cell lines were assessed using one-way ANOVA (df = 2, F = 216.7, p < 0.001) and post hoc t-test with Bonferroni α correction (all p < 0.001). Experiments were performed from six independent cell samples and are shown as mean + SD.
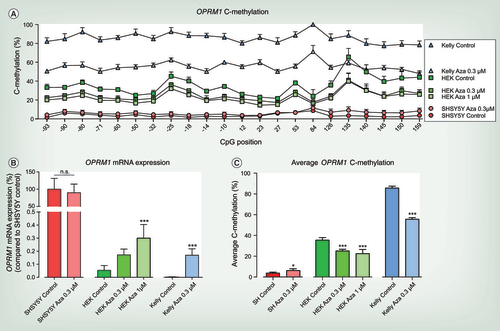
(A) C-methylation profile across OPRM1 gene from CpG position -93 to +159 of 5-Aza-2-desoxy-cytidine (5-Aza-CdR) treated and untreated SHSY5Y, HEK-293 and Kelly cells. Significant differences for each condition (cell line and treatment condition) were assessed using rm-ANOVA with ‘CpG position’ as within-subject factor and ‘condition’ as between-subjects factor (main effect ‘condition’ df = 6, F = 754.02, p = 1.32 × 10⁻²⁹ and ‘CpG position’ df = 21, F = 58.123, p = 5.2 × 10⁻¹⁶ and interaction ‘condition’ by ‘CpG position’ df = 126, F = 18.416, p = 4.76 × 10⁻¹⁷) and post hoc t-Test with Bonferroni α correction (Kelly Control vs Kelly Aza) 0.3 μM (p = 6.55 × 10⁻¹⁷), HEK-293 Control versus HEK-293 Aza 0.3 μM (p = 2.1 × 10⁻⁵) and versus HEK-293 Aza 1 μM (p = 6.6 × 10⁻⁹), SHSY5Y Control versus SHSY5Y Aza 0.3 μM (n.s.)). (B) OPRM1 mRNA expression of 5-Aza-CdR treated and untreated SHSY5Y, HEK-293 and Kelly cells. OPRM1 mRNA expression is compared with SHSY5Y cells under control condition that were set as 100% to display different OPRM1 mRNA expression levels between cell lines. OPRM1 mRNA expression of 5-Aza-CdR treated HEK-293 and Kelly cells cannot reach OPRM1 expression levels of μ-opioid receptor positive SHSY5Y cells. To display the influence of 5-Aza-CdR treatment on OPRM1 mRNA expression for each cell line, 5-Aza-CdR treatment was compared with the respective control condition of the particular cell line. No significant differences were observed in OPRM1 mRNA expression in SHSY5Y cells following 5-Aza-CdR treatment (unpaired t-test p = 0.58). OPRM1 mRNA expression is significantly upregulated in HEK-293 cells following treatment with 1 μM 5-Aza-CdR (one-way ANOVA df = 2, F = 16.8, p = 0.0003; post hoc t-test ***p < 0.001). OPRM1 expression is significantly upregulated in Kelly cells following treatment with 0.3 μM 5-Aza-CdR (unpaired t-test ***p < 0.001). (A–C) At least three to six experiments were performed for each condition and are shown as mean plus SD. (C) Average OPRM1 C-methylation of 5-Aza-CdR treated and untreated SHSY5Y, HEK-293 and Kelly cells. Significant differences were assessed by comparing the 5-Aza-CdR treatment with the respective control condition of the particular cell line. Average OPRM1 methylation was significantly decreased following 5-Aza-CdR treatment in Kelly (unpaired t-test ***p < 0.001) and HEK-293 cells (one-way ANOVA df = 2, F = 28.17, p < 0.0001; post hoc t-test ***p < 0.001). In SHSY5Y cells 5-Aza-CdR treatment slightly increases the average OPRM1 methylation (unpaired t-test p = 0.0245) which was not significant when all CpG positions were considered (rm-ANOVA).
Chronic exposure to exogenous opioids has been shown to trigger epigenetic changes, including increased methylation of the μ-opioid receptor gene OPRM1 in chronic opioid-treated pain patients and opiate addicts [Citation1] and changes in global DNA methylation following opioid treatment of human cell lines [Citation2]. These pharmacoepigenetic effects are likely to impact on brain opioid receptor expression. However, most evidence for this has been gathered in rodents, suggesting contributions of changes in DNA methylation, alterations in the methyl-CpG-binding protein 2 (MeCP2) mediated chromatin structure and modifications of histone acetylation to different opioid receptor expression [Citation3,Citation4]. For example, neuronal differentiation of P19 mouse embryonal carcinoma cells and the consequent increased μ-opioid receptor expression was accompanied by a decrease in DNA methylation [Citation4], and μ-opioid receptor expression was also induced by exposure to the demethylating agent 5′-aza-2′-deoxycytidine or to histone deacetylase inhibitors in P19 cells. In addition, in mouse brain, μ-opioid receptor expression was correlated with reduced levels of OPRM1 DNA methylation [Citation4]. Moreover, MeCP2 (methyl binding protein) and DNA methylation were found to mediate the remodeling of the OPRM1 promoter via chromatin remodeling factors (Brg1 and BAF155) during neuronal differentiation [Citation5].
Understanding of the role of opioid-triggered epigenetic mechanisms in regulating μ-opioid receptor expression in humans, in particular in a pharmacoepigenetic context, has resulted in the identification of an increasing number of epigenetic effects of common drugs [Citation6]. In the present study, we investigated a possible association between differential μ-opioid receptor expression across several brain areas and varying degrees of OPRM1 DNA methylation. Since active manipulation by opioid exposure of brain opioid receptor expression is impossible in living subjects, brain tissue was collected postmortem from heroin addicts as a cohort with long-term exposure to opioids. As a mechanistic control, the possible association of μ-opioid receptor expression with OPRM1 DNA methylation was assessed in human-derived cell lines.
Materials & methods
Analysis of the μ-opioid receptor expression pattern across pain or addiction relevant human brain areas
Study cohort & tissue sample acquisition
The protocol was approved by the Ethics Committee of the Medical Faculty of the Goethe – University, Frankfurt am Main, Germany. Brain tissue was gathered from n = 27 Caucasian fatalities (for demographic details, see ) during forensic examination. Subjects were examined for whom drug intoxication was the probable cause of death. After evaluating the circumstances of death, autopsy results, police reports, medical records (if available) and toxicological data related to opioids (blood or urine concentrations of 6-monoacetylmorphine, morphine/codeine blood concentration ratio >1 [Citation7]), the deaths of 24 of the 27 subjects were verifiably linked to illicit drug consumption; the three additional subjects were also included in order to accommodate a wide range of possible opioid exposure. Average opioid concentrations (±SD) were 324.03 ng/g (±281.02) morphine (n = 19), 191.59 ng/g (±244.30) 6-monoacetylmorphine (n = 15), 82.14 ng/g (±82.67) codeine (n = 17), 1815.67 ng/g (±1151.71) methadone (n = 6) and 18.95 ng/g (±2.84) fentanyl (n = 1).
During the postmortem examination, a forensic pathologist removed tissue samples from n = 21 brain regions () that can be regarded, on the basis of published evidence, as being relevant to either pain/analgesia [Citation8–10] or opioid addiction [Citation11,Citation12], representing relevant clinical settings of chronic opioid exposure. These areas involved in pain and/or addiction are known to be associated with the expression of μ-opioid receptors [Citation9,Citation13–16]. To increase the range of μ-opioid receptor expression in the tested samples, brain areas were also sampled in which μ-opioid receptors are reportedly absent, such as the occipital cortex or the cerebellum [Citation16,Citation17].
Opioid receptor tissue expression assessment
Membrane protein extraction from human brain tissue samples
Membrane preparations were obtained as described previously [Citation18]. In brief, tissue (1–1.5 g) was homogenized with a fast rotating Ultra-Turrax (Janke & Kunkel GmbH, Staufen i. Breisgau, Germany) in 10–15 volumes of homogenization buffer (10 mM Tris-HCl, pH 7.4, 290 mM D(+)-saccharose). The crude tissue homogenate was immediately centrifuged at 1000 × g at 4°C for 15 min, and the supernatant again at 45,000 × g, at 4°C for 45 min. The pellet was resuspended in ice-cold isolation buffer (50 mM Tris-HCl, pH 7.4) and stored at -80°C pending further analysis. Protein concentrations were measured according to the method of Bradford [Citation19].
Opioid agonist saturation binding
The μ-opioid receptor expression (Bmax) was assessed by incubating membrane proteins (30 μg) with ten different concentrations, ranging from 0.06 to 13.1 nM, of the μ-opioid receptor-specific radioligand 3H-[D-Ala2,N-MePhe4,Gly-ol5]-enkephalin ([3H]-DAMGO) (Perkin Elmer, MA, USA) in the presence and absence of 10 μM naloxone. Experiments were performed at room temperature in 96-well MultiScreenHTS-FB Plates (Millipore, MA, USA) containing a final volume of 200 μl assay buffer (50 mM Tris–HCl, pH 7.4). After an incubation period of 60 min, membrane bound and unbound [3H]-DAMGO was separated by rapid filtration through the glass fiber filters at the bottom of the wells using a MultiScreenHTS-Vacuum Manifold (Millipore). Subsequently, the filters were washed six-times with 200 μl of ice-cold assay buffer, dried and covered with 30 μl liquid scintillation cocktail (Quicksafew A, Zinsser Analytic GmbH, Frankfurt, Germany). The decay per minute of the filter-bound [3H]-DAMGO was measured using a MicroBeta2 Microplate Counter (Perkin Elmer). The number of μ-opioid receptors (Bmax) was calculated by fitting a nonlinear model to the data: B([3H]-DAMGO) = (Bmax([3H]-DAMGO) · F([3H]-DAMGO))/(KD([3H]-DAMGO) + F([3H]-DAMGO)) where B([3H]-DAMGO) denotes the concentration of μ-opioid receptor bound [3H]-DAMGO (specific binding), F([3H]-DAMGO) the concentration of the free [3H]-DAMGO, Bmax([3H]-DAMGO) the maximum number of [3H]-DAMGO binding sites (μ-opioid receptor density) and KD([3H]-DAMGO) the equilibrium dissociation constant of [3H]-DAMGO. Calculations were done using the GraphPad Prism software (version 5.03 for Windows®, GraphPad Inc., CA, USA).
Analysis of the regulation of μ-opioid receptor expression in prototypic brain areas
The regulation of μ-opioid receptor expression was assessed at three areas selected on the basis of the following criteria: prototypic representation of the brain regions with the most pronounced differences in expression, availability of sufficient tissue volume and acceptable quality for the necessary analysis. This resulted in the selection of two regions form the largest cluster that also displayed the highest μ-opioid receptor expression, namely, the thalamus medialis and the basolateral amygdala, as well as one region that displayed the lowest OPRM1 expression, namely, the nucleus pontis. In these areas, regulation of μ-opioid receptor expression was assessed. In these experiments, the hypothesis that DNA methylation plays a role in the regulation of μ-opioid receptor expression was investigated by mRNA quantification and DNA methylation analysis. In addition, experiments that could not be carried out on the tissue samples were performed in human cell lines as described below.
Quantification of OPRM1 mRNA expression
The μ-opioid receptor gene mRNA expression was analyzed using a validated TaqMan gene expression assay (Applied Biosystems, Darmstadt, Germany), as described previously with slight modifications [Citation20]. In brief, RNA was isolated from tissue samples stored at -80°C of thalamus medialis, basolateral amygdala and nucleus pontis or cell pellets stored at -80°C by means of the RNeasy Mini Kit (Qiagen). To avoid the degradation of contained mRNA during thawing, samples were defrosted in appropriate lysis buffer included in the kit. Isolation of mRNA was done as recommended by the manufacturer including DNase digestion to eliminate genomic DNA contamination. Finally, mRNA was eluted with RNase-free water and stored at -80°C until further use. RNA extraction was done promptly prior cDNA synthesis to avoid degradation during storage at -80°C. The quality and quantity of the extracted RNA was verified using the NanoQuant technology of the Tecan infinite F200 PRO (Tecan Trading AG, Switzerland). Subsequently, a reverse transcription into DNA was performed using 500 ng of extracted RNA and random primers included in the First Strand cDNA Synthesis Kit (Thermo Scientific™, Schwerte, Germany) according to the manufacturer’s protocol. Real-time polymerase chain reaction (PCR) analyses were done with 1 μl cDNA template in triplicates using the 2× TaqMan Gene Expression Mastermix and the validated TaqMan gene expression assay for the OPRM1 gene (Hs01053957_m1, Applied Biosystems) and the TaqMan endogenous control assays for human β-actin (Hs99999903_m1) and for human glyceraldehyde-3-phosphate dehydrogenase (GAPDH; Hs03929097_g1). For cell samples, previously published primers for the endogenous controls were used: human β-actin: for 5′−TGACCCAGATCATGTTTGAG−3′, rev 5′−TTAATGTCACGCACGATTTCC−3′ and human GAPDH: for 5′−GATTCCACCCATGGCAAATTC−3′ rev 5′−TGGGATTTCCATTGATGACAAG3′ [Citation21]. Realtime-PCR for baseline determination of endogenous OPRM1 expression in SHSY5Y, Kelly and HEK-293 cells were done with 1 μl cDNA template using the 2× ABsolute Blue QPCR Mix, SYBR Green, ROX (Thermo Scientific™, Schwerte, Germany) for β-actin and GAPDH and with 2× TaqMan Gene Expression Mastermix for the OPRM1 gene. To increase quantification of OPRM1 expression in Kelly and HEK-293 cells following 5-Aza-2-desoxy-cytidine (5-Aza-CdR) treatment 2 μl of cDNA template were used. Quantification of mRNA was conducted on a 7500 Fast-Real-Time PCR System (Applied Biosystems). Using the implemented 7500 software v.2.0.1. Relative OPRM1 mRNA expression was determined by the comparative Ct method. OPRM1 mRNA transcripts were normalized to GAPDH and finally related to β-actin when expression levels were compared between different cell types or brain regions. In case of comparisons between untreated cells and 5-Aza-CdR treated cells OPRM1 mRNA transcripts were normalized to GAPDH and finally related to the control condition of the SHSY5Y cell line.
Quantification of OPRM1 DNA methylation
To analyze possible regulation of the μ-opioid receptor brain expression byDNA methylation, the degree of DNA methylation at CpG islands in the OPRM1 gene region was measured using a validated Pyrosequencing™ assay as described previously [Citation1]. This agrees with contemporary laboratory assays in the present context [Citation20,Citation22–23]. A total of 22 CpG positions (from position 93 to +159) within a CpG−island reaching from position -382 to +561 relative to the start codon was analyzed. In brief, genomic DNA was extracted from tissue preparations or cell pellets, which were stored at -80°C using the DNeasy blood and tissue Kit (Qiagen, Hilden, Germany) according to manufacturer’s protocol. Bisulphite treatment was then performed with 500 ng DNA using the EZ DNA Methylation-Gold Kit (Zymo Research, CA, USA) according to manufacturer’s instructions and eluted in 30 μl elution buffer. PCRs were run on a Mastercycler nexus gradient flexlid device (Eppendorf, Hamburg, Germany) a 25 μl reaction volume including 2.5 μl bisulphite-treated DNA, mixed with 0.25 μl MyTaq™ HS DNA Polymerase (5 U/μl) (Bioline, Luckenwalde, Germany), 5 μl 5× MyTaq Reaction Buffer, 0.1 μl of each PCR primer (100 μM) and 17.05 μl HPLC-purified water. Nested PCR provided a final PCR product of 316 bp (for primer sequences see Supplementary methods). However, due to the known susceptibility to contamination, the assay was subsequently modified toward a non-nested PCR. This modification resulted in two PCR products covering the CpG positions from -93 to +53 (sequence 1, 227 bp) and from +84 to +159 (sequence 2, 153 bp). PCR was performed with an initial denaturation step for 3 min at 92°C, and 40 cycles with a 15 s denaturation step at 92°C, an 15 s annealing step (temperature Supplementary methods) and an 15 s elongation step at 72°C, with final elongation at 72°C for 5 min. Analysis of the OPRM1 methylation was done by means of Pyrosquencing™ (Qiagen, Hilden, Germany) as described previously [Citation1,Citation24–25]. In brief, 25 μl of the PCR templates were processed and purified with the PyroMark Vacuum Prep Worktable (Biotage, Uppsala Sweden) and subsequently annealed to the sequencing primer (see Supplementary methods) at 80°C for 2 min as instructed by the manufacturer.
Sequence analysis took place on a PSQ 96 MA System using the PyroMark Gold Q96 Reagents (Qiagen, Hilden, Germany) with the Pyro Q-CpG methylation software (version 1.0.9) which was used to determine the nucleotide dispensation order. The software also automatically analyzed the methylation results for each single CpG site in the analyzed sequence. Each brain sample was analyzed in triplicate within one batch and two independent measurements with separate PCR amplification were conducted. For assay validation, each run included control DNA samples obtained from the EpiTect PCR Control DNA Set (Qiagen) that contained both bisulphite converted completely methylated as well as unmethylated DNA, as positive controls, and unconverted unmethylated DNA, as negative control. In the measurements using nested PCR, the average methylation over all 22 CpG sites of the unmethylated control was 3.07 ± 0.39% and the methylated control reached 88.34 ± 0.59%. Corresponding results were validated for four CpG sites (+12 to +53) by using alternative primer pairs without nested PCR to exclude amplification bias (40 cycles instead of 65 cycles with nested PCR). To this end, samples from different brain regions were randomly composed on each 96-well plate to minimize batch effects. The same EpiTect PCR Control DAN Set was used as internal control and verified the unmethylated control as 4.60 ± 0.27% and the methylated control as 85.45 ± 1.43 %, indicating that the cycle amount of PCR amplification did not affect obtained results. In the human brain samples, comparable results were obtained for CpG sites +12 to +53 using either nested PCR or the alternative primers without nested PCR (unmethylated DNA: 7.06 ± 3.25%, methylated DNA: 87.26 ± 5.76).
Cell line based assessment of the regulatory importance of DNA methylation for OPRM1 expression
The possibility of epigenetic regulation in humans was assessed using available human cell lines that differed in μ-opioid receptor expression. Specifically, SHSY5Y and Kelly cells are both neuroblastoma cell lines that differ in the extent of their μ-opioid expression. SHSY5Y cells express μ-opioid receptors endogenously [Citation26], whereas Kelly cells do not express μ-opioid receptors. The non-neuronal cell line, HEK-293 (human embryonal kidney cells), that does not express μ-opioid receptors was also studied [Citation26]. SHSY5Y and Kelly cells were selected because of their neuronal character, thereby representing a model cell system for neuronal cells. HEK-293 cells, in contrast, were chosen because of their different tissue of origin and the existing evidence for the differential regulatory impact of DNA methylation on μ-opioid receptor expression in neuronal and non-neuronal tissue [Citation26]. Alterations in OPRM1 mRNA expression were investigated following exposure of human cell lines to the demethylating agent, 5-Aza-CdR. Since HEK-293 cells show a decreased response to the cell cycle dependent 5-Aza-CdR treatment, due to increased division rate and their reduced vulnerability compared with SHSY5Y cells and Kelly cells, 5-Aza-CdR treatment in HEK-293 cells was carried out at a higher concentration (1 μM) to achieve a comparable decrease in DNA methylation. SHSY5Y and Kelly cells, in turn, are more vulnerable and die when treated with the cytotoxic concentration of 1 μM 5-Aza-CdR.
HEK-293 cells were cultured in Dulbecco’s modified Eagle’s Medium (DMEM) + GlutaMax™ (Gibco, Darmstadt, Germany) supplemented with 10% (v/v) fetal calf serum (FCS) and 1% penicillin/streptomycin (PAA Laboratories GmbH, Cölbe, Germany). Kelly cells were cultured in Roswell Park Memorial Institute medium (RPMI) (Gibco), supplemented with 10% (v/v) FCS and 1% penicillin/streptomycin (PAA Laboratories GmbH). SHSY5Y cells were obtained from the DZMS-Collection of Microorganisms and Cell Cultures (DSMZ, Braunschweig, Germany) and were grown in 1:1 mixed Ham F12 and Minimum Essential Medium (Gibco) supplemented with 15% (v/v) FCS, 1 % Minimum Essential Medium Non-Essential Amino Acids (Gibco), 2 mM l-glutamine (Gibco) and 1% penicillin/streptomycin (PAA Laboratories GmbH). All cells were grown at 37°C in humidified atmosphere containing 5% CO2. Prior to drug treatment, cells were seeded at an appropriate density in 10 cm2 cell culture dishes and allowed to settle for 24 h in complete media. Subsequently, cells were incubated for 72 h in the presence of 0.3 or 1 μM 5-Aza-CdR. DMSO served as vehicle control.
Data analysis
Digital pattern analysis of μ-opioid receptor expression among human brain areas
Unsupervised computer learning using a probabilistic approach [Citation27] was employed to identify patterns of μ-opioid brain expression. This aimed at identifying structures within the data space D described by features X Є R21, which presently consisted of the quantitative receptor expressions observed in 21 different brain regions. Following visual inspection of the distribution of the Bmax values displayed as probability density function, estimated by means of the pareto density estimation [Citation28], data were log-transformed (zero invariant) to LogBmax = ln(Bmax+1) [Citation29]. An outlier was eliminated based on a significant Grubbs test (p < 2.2 × 10⁻¹⁶). Missing data (n = 79 items from the 21 × 27 brain regions vs tissue matrix equaling 13% of this matrix) were calculated using a k nearest neighbor algorithm with k = 3 [Citation30]. To identify a μ-opioid receptor expression pattern across the brain-regions, the 21 × 27 sized input space D, comprising the LogBmax values, was projected onto a 2D toroid grid [Citation31] of so-called neurons with 50 rows and 82 columns (n = 4100 units). Each neuron holds, in addition to the input vector from the 21D space (brain regions), a further vector carrying ‘weights’ of the same dimensions as the input dimensions. The weights were initially drawn randomly from the range of the data variables. Subsequently, they were adapted to the data (learning phase, 20 epochs).
After learning was complete, data from the trained emergent self-organizing map (ESOM) were presented on the 2D toroid map. On this map, the localizations of the so-called ‘best-matching units’ were used to detect cluster structures on top of the neuron grid using a so-called U-Matrix, which displays the distances in the high-dimensional space as heights [Citation32,Citation33]. This was enhanced by calculating in addition a P-matrix [Citation31] that displays the point density p(x) = |{data points xi| d(xi,x) < = r}| estimated as the number of data points in a sphere with radius r around x at each grid point on the ESOM’s output grid. The U*-matrix combines distance structures (U-matrix) and density structures (P-matrix) into a single matrix (U*-matrix) [Citation31]. On the U*-matrix, a geographical map analogy using watersheds was used to enhance visual detection of borders of data clusters. This approach represents a topology-preserving mapping of high-dimensional data points onto a 2D grid of neurons which was therefore favored in comparison to more common clustering algorithms such as k-means, Ward, complete and average linkage [Citation33]. Computer learning was performed using our R library Umatrix (M Thrun, F Lerch, Marburg, Germany [Citation34,Citation35]) with the freely available R software package (version 3.2.3 for Linux [Citation36,Citation37]) running on Ubuntu Linux 14.04.4 64-bit. The clusters obtained were compared with respect to μ-opioid receptor expression using Kruskal–Wallis tests [Citation38] followed by Dunn’s post hoc pairwise multiple comparisons tests [Citation39].
Inference statistics
In brain tissue derived data, group comparisons were performed using Kruskal–Wallis tests [Citation38] followed by Dunn’s post hoc pairwise multiple comparisons tests [Citation39], or using Mann–Whitney U tests in the case of only two groups. In cell culture derived data, OPRM1 DNA methylation was compared among cell lines and treatments by means of analysis of variance for repeated measures, with ‘CpG position’ as within-subject factor and ‘treatment’ and ‘cell line’ as between-subject factors. Post hoc comparisons were done using Student’s t-tests [Citation40] or one-way ANOVA in case of more groups. Further statistical calculations included rank correlation analyses (Spearman’s ρ [Citation41]). The α-level was set at 0.05 and corrected for multiple testing using according to Bonferroni [Citation42]. These analyses were performed using the SPSS software package (version 23 for Windows, IBM SPSS Statistics, IL, USA).
Results
Expression pattern of μ-opioid receptors
Opioid receptor expression differed across brain regions (). ESOM projection of the regional μ-opioid receptor expression, in other words, of the log-transformed Bmax-values, assessed by determining the saturation binding of [3H]-DAMGO to membrane preparations (), and subsequent visualization of the cluster distances, provided a U*-matrix () on which regions that were located close together and which shared similar degrees of μ-opioid receptor expression were identifiable. The result was the identification of four clusters that differed significantly (insert of ) with respect to μ-opioid receptor expression (Kruskal–Wallis χ2 = 113.21, df = 3, p < 2.2 × 10⁻¹⁶).
The thalamus medialis and the basolateral amygdala were contained in the cluster with the highest μ-opioid receptor expression (), and which comprised the largest number of brain regions. At the opposite extreme, a small cluster was also identified comprising only the nucleus pontis and the occipital cortex. Two regions with high μ-opioid receptor expression (thalamus medialis, basolateral amygdala) were selected from the largest cluster and one region with low μ-opioid receptor expression (nucleus pontis) was selected from the smallest cluster for further analyses. These regions met the predefined criteria of prototypic representation of extremely differing clusters together with the availability of sufficient tissue volume of acceptable quality. The expression of μ-opioid receptors differed statistically significantly (A) as expected from the cluster membership (Kruskal–Wallis χ2 = 34.99, df = 2, p < 2.5 × 10⁻⁸), in other words, the thalamus medialis and the basolateral amygdala did not differ from each other but both differed significantly from the nucleus pontis (Dunn’s tests: p < 0.0001).
Epigenetic regulation of μ-opioid receptor expression
Assessments in human brain tissue
In the three brain areas selected for the assessments of an association between OPRM1 DNA methylation and μ-opioid receptor expression, statistically significant differences in the amount of OPRM1 mRNA were observed (Kruskal–Wallis χ2 = 34.81, df = 2, p < 2.8 × 10⁻⁸). The direction of the differences between brain regions agreed with the expectation, in other words, regions with high μ-opioid receptor protein expression (thalamus medialis, basolateral amygdala) contained higher OPRM1 mRNA levels than the region with low μ-opioid receptor protein expression (nucleus pontis; B; Dunn’s tests: p < 0.001).
However, subsequent analyses of OPRM1 DNA methylation failed to provide support for a biologically plausible epigenetic regulation of μ-opioid receptor expression. The average OPRM1 DNA methylation ranged from 2.87 ± 2.01 in the thalamus medialis to 4.22 ± 3.11% in the basolateral amygdala (C). Although the statistical analysis of the interregional differences produced a significant result (Kruskal–Wallis χ2 = 11.13, df = 2, p = 0.0037), the most pronounced difference was observed within the cluster of high receptor expression (Dunn’s tests: p = 0.004 for thalamus medialis vs nucleus pontis, other pairwise comparisons not significant). As OPRM1 mRNA expression or μ-opioid receptor expression were also not significantly correlated with OPRM1 methylation (Spearman’s correlation analysis: p > 0.05), the hypothesis of epigenetic regulation had to be rejected.
Analysis in human cell lines
The possibility of epigenetic regulation of human μ-opioid receptor expression was additionally analyzed in human cell lines selected for their differences in μ-opioid receptor expression, comprising the μ-opioid receptor expressing neuronal-derived SHSY5Y cell line, the neuronal μ-opioid receptor nonexpressing Kelly cell line and the non-neuronal μ-opioid receptor nonexpressing HEK-293 cell line.
The amounts of OPRM1 mRNA differed significantly among the three cell lines (B) in agreement with known patterns [Citation26] of endogenous μ-opioid receptor expression (one-way ANOVA df =2, F = 63.72, p = 0.91 × 10⁻⁴; post hoc t-test with Bonferroni α correction: p < 0.001 for SHSY5Y vs Kelly and SHSY5Y vs HEK-293).
Consistent with the cell-line specific mRNA expression levels, the methylation status of the OPRM1 gene differed among the cell lines. Specifically, the analyzed CpG island including 22 CpG positions was methylated in the μ-opioid receptor nonexpressing neuronal Kelly and non-neuronal HEK-293 cells, whereas OPRM1 methylation was almost absent in the μ-opioid receptor expressing neuronal SHSY5Y cells (A & C). These differences were statistically significant (rm-ANOVA main effect ‘cell line,’ df = 2, F = 192.2, p = 2.04 × 10⁻¹¹ and ‘CpG position,’ df = 20, F = 28.015, p = 1.4 × 10⁻⁵, interaction ‘cell line’ by ‘CpG position,’ df = 40, F = 13.455, p = 9.5 × 10⁻⁵).
To establish a causal relationship between OPRM1 methylation and mRNA expression, cell lines were treated for 3 days with the demethylating agent 5-Aza-CdR. This induced the desired decrease in the average OPRM1 methylation (C), in other words, in Kelly cells by 30.1% following treatment with 0.3 μM 5-Aza-CdR (p = 4.01 × 10⁻⁹ vs control) and in HEK-293 cells by 10.4 % or 12.9 % following treatment with 0.3 μM or 1 μM 5-Aza-CdR, respectively (p = 0.001 and p = 3.1 × 10⁻⁵ vs control). In contrast, 5-Aza-CdR treatment slightly increased the already weak OPRM1 methylation in the SHSY5Y cells (p = 0.0245 vs control), which was not significant when assessed by an rm-ANOVA which included each single CpG position. In addition, the weak methylation had no impact on OPRM1 mRNA expression (B & C). Following these treatments, OPRM1 mRNA expression in Kelly (unpaired t-test p < 0.001) and HEK-293 cells (one-way ANOVA df = 2, F = 16.8, p = 0.0003; post hoc t-test with Bonferroni α correction: p < 0.001 for 1 μM 5-Aza-CdR) was found to be significantly upregulated (B).
Discussion
The present observations in human brain tissue, acquired postmortem from former heroin addicts, do not support a major role of DNA methylation in the differential expression of the μ-opioid receptor across human brain regions. Over a wide range of μ-opioid receptor expression across human brain regions, the associated methylation of the OPRM1 gene displayed only a small variability. Brain areas at the extreme ends of the receptor expression range differed only by 1–2% with respect to the OPRM1 methylation, which in addition was not significantly correlated with the receptor expression. In contrast, human cell lines with different μ-opioid receptor expression differed by 30–80% with respect to the OPRM1 methylation, suggesting the possibility that OPRM1 expression in humans can be regulated via DNA methylation. However, changes in DNA methylation exceeded those observed in human brain tissue by an order of magnitude. The present data, though, do not rule out a major role of DNA methylation on μ-opioid expression in different human tissue at all.
The activation of μ-opioid receptor expression following demethylation treatment [Citation3,Citation4] could nevertheless, be translated to human cells in an in vitro setting. The μ-opioid receptor positive human neuronal cell lines are hypomethylated at a CpG island located close to the OPRM1 start codon. In contrast, μ-opioid receptor negative human cell lines are hypermethylated at this gene location. These observations are in line with recent published evidence [Citation26,Citation44] supporting a regulatory activity of the selected CpG island at positions -93 to +159 of the OPRM1 gene. Furthermore, the initiation of μ-opioid receptor expression following DNA demethylation with 5-Aza-CdR in Kelly and HEK-293 cells supports a possible role of DNA methylation in the expression of human μ-opioid receptors. However, even pronounced OPRM1 demethylation in formerly μ-opioid receptor negative human cell lines was unable to raise the expression level to that observed in μ-opioid receptor positive cell lines. This suggests the involvement of other mechanisms of regulation of μ-opioid receptor expression. This possibility was also suggested by an observation in μ-opioid receptor negative Jurkat cell line where receptor upregulation following demethylation (5-Aza-CdR) combined with histone deacetylase inhibition (TSA) could not reach expression levels seen in μ-opioid receptor positive cells [Citation44].
In contrast to the experiments in cell lines, the regulatory role of DNA methylation in μ-opioid receptor expression could not be translated from mice [Citation3] to humans. The present results on human brain samples are in contrast to data from laboratory animals that suggested a role of μ-opioid receptor gene methylation in regulation of gene expression [Citation3,Citation4]. In μ-opioid receptor negative P19 mouse embryonal carcinoma cells, the expression of μ-opioid receptors could be increased by neuronal differentiation, while the proximal promoter of the OPRM1 gene reverted from a highly methylated state in undifferentiated cells to hypomethylation in differentiated cells. In contrast, the methylation of other regions was not changed, and μ-opioid receptor expression could also be induced by a demethylating agent (5-Aza-CdR) and by histone deacetylase inhibitors (trichostatin A, valproic acid), suggesting the involvement of DNA methylation or histone deacetylation in μ-opioid receptor silencing. Differentiation of P19 cells reduced an interaction of the MeCP2 with the promoter region, which is relevant for transcription. This further supports the possibility that DNA methylation is linked to the MeCP2-mediated chromatin structure of the OPRM1 gene [Citation4]. Further studies in different mice brain regions showed that μ-opioid receptor expression in microdissected mouse brain regions was negatively correlated with DNA methylation. In the cerebellum, which lacks μ-opioid receptors in the mouse brain, increased interaction with MeCP2 and a hypermethylated OPRM1 promoter was observed. Moreover, a functional role of MeCP2 in association with the chromatin-remodeling factor Brg1 and with the DNA methyl transferase DNMT1 was established, suggesting that μ-opioid receptor expression can be epigenetically programmed in various mouse brain regions by MeCP2 [Citation3]. Furthermore, the μ-opioid receptor upregulation observed during neuronal differentiation coincided with altered chromatin structure, an effect that occurred via recruitment of the transcriptional activator SP1 and by dissociation of repressors, such as MeCP2 and HDACs [Citation5].
Assessments in postmortem brain tissue have been shown to be effective for the study of regulatory molecular mechanisms in the human brain [Citation20,Citation45]. While this approach allows direct investigations in the tissue of interest, the material raises several technical problems in contrast controlled in vitro assessments in cell cultures. The experimental conditions elude the strict control possible in cell cultures and are influenced by several confounding factors arising before the subject’s death. Processes occurring after death may also influence the quality of the biological material. DNA methylation, nevertheless, is a stable modification because of its covalent character and it is probably better conserved than are proteins and RNA. However, the collected brain material consists of approximately 70% glial cells (astrocytes, oligodendrocytes and microglia) [Citation46] and therefore, the observed OPRM1 methylation cannot be attributed solely to neurons. The consequences of this confounder, however, are probably ameliorated by the expression of opioid receptors in glial cells [Citation47,Citation48].
A further potential confounding factor is the previously reported influence of the OPRM1 118A>G polymorphism on μ-opioid receptor expression in the human brain [Citation20]. Carriers of the variant G allele were also included in the present cohort and exploration of an effect of this variant on μ-opioid receptor expression was negative (details not shown). This agrees with our previous finding [Citation18]. However, it contrasts with a later observation that the G allele reduces opioid receptor expression via a genetic–epigenetic interaction [Citation20]. The latter result was only evident when a nonaddicted control group was available for comparison, which was not included in our mainly pharmacoepigenetic focused experiments.
A further limitation of the present analyses is the restriction to OPRM1 DNA positions -93 to +159. When considering reports that the promoter spans positions from -445 to -10, with particularly important promoter activity between positions -256 and -10 [Citation26], the possibility exists that epigenetic regulation could have been found at other locations than those presently analyzed. The consequence of this limitation may be weakened when considering that a regulatory role of the presently analyzed OPRM1 positions has been shown for a genetic–epigenetic interaction of the 118G allele [Citation20]. Moreover, the analyzed region obviously sufficed to explain OPRM1 expression differences between the human cell lines. It should also be noted that the bisulphite-based pyrosequencing method used might have masked the occurrence of hydroxymethylcytosine as both modifications, in other words, hydroxymethyl- and methylcytosine, are recognized as DNA methylation. Hydroxymethylcytosine is markedly increased from the fetal to the adult brain with a strong enrichment in genic regions and distal regulatory elements. Furthermore, it occurs predominantly at the 5′ splicing sites at exon–intron boundaries, suggesting novel roles in regulating splicing and gene expression. Hydroxymethylation is also an important modification of CpG sites at actively transcribed regions and may contribute to the epigenetic tuning at these regions [Citation49].
The absence of differences in OPRM1 DNA methylation corresponding to differences in μ-opioid receptor expression in brain areas at the extreme ends of the opioid receptor expression range suggests that key regulatory mechanisms underlying these interregional differences target other mechanisms between gene transcription, post-transcriptional processes and protein assembly [Citation50]. Due to the significant correlation between μ-opioid receptor protein and mRNA expression levels, our results narrow this window to posttranscriptional mechanisms acting before mRNA formation. The investigation of these mechanisms may require determinations during neuronal differentiation since the involvement of epigenetic mechanisms has previously been observed during neuronal differentiation of undifferentiated P19 cells [Citation5]. In already differentiated cells, the gene locus is remodeled toward a transcriptionally active state, focusing the search on binding loci of transcription factors reported to be involved in the regulation of the human OPRM1 gene, such as activator protein 1 (AP1) [Citation51], NF-κB [Citation52], signal transducers and activators of transcription [Citation53], GATA binding-protein (GATA) [Citation54] and PARP [Citation55], or several further negative transcription factors [Citation56]. For example, different combinations of transcription factors could lead to a different expression pattern among brain regions, although validated ‘cell specific’ transcription factors have not been identified yet [Citation50]. Gene expression is finally the result of the sum of several interacting epigenetic mechanisms, like histone modification, DNA methylation and miRNA that influence the transcriptional state of a gene. Epigenetic effects occurring concomitantly might mask other epigenetic mechanisms such as DNA methylation.
Conclusion
Following observations that exposure to opioids triggers epigenetic modifications [Citation1,Citation22–23,Citation57], we analyzed whether such effects contribute to the differential expression of μ-opioid receptors across the human brain. Epigenetic regulation of the μ-opioid receptor via changes in DNA methylation was supported by several lines of evidence including in vitro assessments and analyses in brain tissue from rodents. Our present results support the possibility that OPRM1 expression may be regulated via DNA methylation. However, they also indicate that in brain regions obtained postmortem from former opiate addicts, with a high degree of chronic opiate exposure, the changes in DNA methylation associated in vitro with a wide range of μ-opioid receptor expression levels greatly exceed the measured differences in OPRM1 methylation.
Future perspective
Taking into account the fact that observations in laboratory animals could not be translated to the human setting, the field of epigenetic research still lacks evidence gathered from relevant human tissue [Citation58]. However, the present study does not exclude that μ-opioid receptor expression is subject to epigenetic regulation also in humans. A broader analysis of all regulatory parts of the human OPRM1 gene and a regard for other epigenetic mechanisms such as histone acetylation, which has also been shown to influence the μ-opioid receptor expression in rodents [Citation44], needs still to be explored in human brain tissue to further refine the understanding of the mutual interactions between genetics, epigenetics and drugs in both, pain and addiction.
Table 1. Demographic and addiction-related data of the study cohort.
Table 2. Brain regions, 3H-[D-Ala2,N-MePhe4,Gly-ol5]-enkephalin BMax as a measure of μ-opioid binding sites and cluster membership of the investigated brain membrane preparations, sorted for decreasing median μ-opioid receptor expression level (compare B).
Accumulating evidence suggests that opioids may trigger DNA hypermethylation at global and possible single gen levels, in particular under chronic exposure. These epigenetic changes can be expected to alter the expression of genes.
Of particular interest in this context is an effect of DNA methylation on μ-opioid receptor expression in the brain as the main site of clinical opioid action. A modulation of brain opioid receptor expression is supported by findings in rodents that have suggested a role of varying degrees of DNA methylation in the differential regulation of μ-opioid receptor expression across the brain.
The role of μ-opioid receptor gene methylation for its expression in the human brain following chronic opioid exposure can be studied in postmortem acquired brain tissue from former heroin addicts. In the present study, this was done for 21 different brain regions selected for their involvement in pain, addiction or as control areas, sampled from 27 fatalities of Caucasian ethnicity.
As the result of DNA methylation and μ-opioid receptor expression analysis, we observed that high versus low μ-opioid receptor expression, both observed at the functional proteomic (Bmax) and the mRNA levels, were not associated with a similarly directed difference in the OPRM1 methylation status.
Subsequent in vitro experiments in human cell lines, however, indicated that different expression of μ-opioid receptors is indeed associated with similarly directed differences in OPRM1 DNA methylation, however, the DNA methylation differed by a magnitude more than the difference observed between high and low OPRM1 expression human brain areas.
These results suggest that the pharmacoepigenetic effects of chronic opioid exposure are in principle possible but by their small effect sizes unlikely on brain μ-opioid receptor expression are unlikely to exert a major role in the region-specificity of μ-opioid receptor expression in the human brain.
Ethical conduct of research
The authors state that they have obtained appropriate institutional review board approval or have followed the principles outlined in the Declaration of Helsinki for all human or animal experimental investigations. In addition, for investigations involving human subjects, informed consent has been obtained from the participants involved.
Supplemental Table 1
Download MS Word (18 KB)Acknowledgements
The HEK-293 cell line was kindly provided by I Tegeder, Institute of Clinical Pharmacology, Goethe – University, Frankfurt am Main, Germany. The authors thank M Parnham, Fraunhofer Project Group Translational Medicine and Pharmacology TMP, Frankfurt am Main, Germany, for language editing.
Financial & competing interests disclosure
The work has been supported by the Else Kröner-Fresenius Foundation (EKFS), Research Training Group Translational Research Innovation – Pharma (TRIP, G Geisslinger, J Lötsch) and the Landesoffensive zur Entwicklung wissenschaftlich-ökonomischer Exzellenz (LOEWE), LOEWE-Zentrum für Translationale Medizin und Pharmakologie (G Geisslinger, J Lötsch). Additional support of the analytical environment was gained form the European Union Seventh Framework Programme (FP7/2007–2013) under grant agreement no. 602919 (GLORIA, J Lötsch). The funders had no role in method design, data selection and analysis, decision to publish or preparation of the manuscript. The authors have no other relevant affiliations or financial involvement with any organization or entity with a financial interest in or financial conflict with the subject matter or materials discussed in the manuscript apart from those disclosed.
No funded writing assistance was utilized in the production of this manuscript.
Additional information
Funding
References
- Doehring A , OertelBG , SittlR , LötschJ . Chronic opioid use is associated with increased DNA methylation correlating with increased clinical pain . Pain154 ( 1 ), 15 – 23 ( 2013 ).
- Knothe C , DoehringA , UltschA , LötschJ . Methadone induces hypermethylation of human DNA . Epigenomics8 ( 2 ), 167 – 179 ( 2015 ).
- Hwang CK , SongKY , KimCSet al. Epigenetic programming of mu opioid receptor gene in mouse brain is regulated by MeCP2 and Brg1 chromatin remodeling factor . J. Cell. Mol. Med.13 ( 9B ), 3591 – 3615 ( 2009 ).
- Hwang CK , SongKY , KimCSet al. Evidence of endogenous mu opioid receptor regulation by epigenetic control of the promoters . Mol. Cell. Biol.27 ( 13 ), 4720 – 4736 ( 2007 ).
- Hwang CK , KimCS , KimDK , LawPY , WeiLN , LohHH . Up-regulation of the mu-opioid receptor gene is mediated through chromatin remodeling and transcriptional factors in differentiated neuronal cells . Mol. Pharmacol.78 ( 1 ), 58 – 68 ( 2010 ).
- Lötsch J , SchneiderG , RekerDet al. Common non-epigenetic drugs as epigenetic modulators . Trends Mol. Med.19 ( 12 ), 742 – 753 ( 2013 ).
- Stefanidou M , AthanaselisS , SpiliopoulouC , DonaA , MaraveliasC . Biomarkers of opiate use . Int. J. Clin. Pract.64 ( 12 ), 1712 – 1718 ( 2010 ).
- Brodersen KH , WiechK , LomakinaEIet al. Decoding the perception of pain from fMRI using multivariate pattern analysis . Neuroimage63 ( 3 ), 1162 – 1170 ( 2012 ).
- Apkarian AV , BushnellMC , TreedeRD , ZubietaJK . Human brain mechanisms of pain perception and regulation in health and disease . Eur J. Pain9 ( 4 ), 463 – 484 ( 2005 ).
- Treede RD , ApkarianAV , BrommB , GreenspanJD , LenzFA . Cortical representation of pain: functional characterization of nociceptive areas near the lateral sulcus . Pain87 ( 2 ), 113 – 119 ( 2000 ).
- Ma N , LiuY , LiNet al. Addiction related alteration in resting-state brain connectivity . Neuroimage49 ( 1 ), 738 – 744 ( 2010 ).
- Miquel M , Vazquez-SanromanD , Carbo-GasMet al. Have we been ignoring the elephant in the room? Seven arguments for considering the cerebellum as part of addiction circuitry . Neurosci. Biobehav. Rev.60 , 1 – 11 ( 2016 ).
- Zubieta JK , SmithYR , BuellerJAet al. Regional mu opioid receptor regulation of sensory and affective dimensions of pain . Science293 ( 5528 ), 311 – 315 ( 2001 ).
- Firestone LL , GyulaiF , MintunM , AdlerLJ , UrsoK , WinterPM . Human brain activity response to fentanyl imaged by positron emission tomography . Anesth. Analg.82 ( 6 ), 1247 – 1251 ( 1996 ).
- Schlaepfer TE , StrainEC , GreenbergBDet al. Site of opioid action in the human brain: mu and kappa agonists’ subjective and cerebral blood flow effects . Am. J. Psychiatry155 ( 4 ), 470 – 473 ( 1998 ).
- Jones AK , QiLY , FujirawaTet al. In vivo distribution of opioid receptors in man in relation to the cortical projections of the medial and lateral pain systems measured with positron emission tomography . Neurosci. Lett.126 ( 1 ), 25 – 28 ( 1991 ).
- Frost JJ , WagnerHNJr , DannalsRFet al. Imaging opiate receptors in the human brain by positron tomography . J. Comput. Assist. Tomogr.9 , 231 – 236 ( 1985 ).
- Oertel BG , KettnerM , ScholichKet al. A common human micro-opioid receptor genetic variant diminishes the receptor signaling efficacy in brain regions processing the sensory information of pain . J. Biol. Chem.284 ( 10 ), 6530 – 6535 ( 2009 ).
- Bradford MM . A rapid and sensitive method for the quantitation of microgram quantities of protein utilizing the principle of protein-dye binding . Anal. Biochem.72 , 248 – 254 ( 1976 ).
- Oertel BG , DoehringA , RoskamBet al. Genetic–epigenetic interaction modulates mu-opioid receptor regulation . Hum. Mol. Genet.21 ( 21 ), 4751 – 4760 ( 2012 ).
- Di Francesco A , ArosioB , FalconiAet al. Global changes in DNA methylation in Alzheimer’s disease peripheral blood mononuclear cells . Brain Behav. Immun.45 , 139 – 144 ( 2015 ).
- Chorbov VM , TodorovAA , LynskeyMT , CiceroTJ . Elevated levels of DNA methylation at the OPRM1 promoter in blood and sperm from male opioid addicts . J. Opioid Manag.7 ( 4 ), 258 – 264 ( 2011 ).
- Nielsen DA , YuferovV , HamonSet al. Increased OPRM1 DNA methylation in lymphocytes of methadone-maintained former heroin addicts . Neuropsychopharmacology34 ( 4 ), 867 – 873 ( 2009 ).
- Bollati V , BaccarelliA , HouLet al. Changes in DNA methylation patterns in subjects exposed to low-dose benzene . Cancer Res.67 ( 3 ), 876 – 880 ( 2007 ).
- Kile ML , BaccarelliA , TarantiniL , HoffmanE , WrightRO , ChristianiDC . Correlation of global and gene-specific DNA methylation in maternal–infant pairs . PLoS ONE5 ( 10 ), e13730 ( 2010 ).
- Andria ML , SimonEJ . Localization of promoter elements in the human mu-opioid receptor gene and regulation by DNA methylation . Brain Res. Mol. Brain Res.70 ( 1 ), 54 – 65 ( 1999 ).
- Murphy KP . Machine Learning: A Probabilistic Perspective.The MIT Press , London, UK ( 2012 ).
- Ultsch A . Pareto density estimation: a density estimation for knowledge discovery . In : Innovations in Classification, Data Science, and Information Systems - Proceedings 27th Annual Conference of the German Classification Society (GfKL).BaierD , WerrneckeKD ( Eds ). Springer , Berlin, Germany ( 2003 ).
- Lachin JM , McGeePL , GreenbaumCJet al. Sample size requirements for studies of treatment effects on beta-cell function in newly diagnosed type 1 diabetes . PLoS ONE6 ( 11 ), e26471 ( 2011 ).
- Altman NS . An Introduction to Kernel and Nearest-Neighbor Nonparametric Regression . Am. Stat.46 ( 3 ), 175 – 185 ( 1992 ).
- Ultsch A . Maps for visualization of high-dimensional data spaces . In : Proceedings of the 4th Workshop on SelfOrganizing Maps (WSOM).Information and Software Engineering Group , Kyushu, Japan , 225 – 230 ( 2003 ).
- Ultsch A , SiemanHP . Kohonen’s self organizing feature maps for exploratory data analysis . In : INNC’90, Int. Neural Network Conference.Kluwer , Dordrecht, The Netherlands , 305 – 308 ( 1990 ).
- Lötsch J , UltschA . Exploiting the structures of the U-matrix . In : Advances in Intelligent Systems and Computing.VillmannT , SchleifF-M , KadenM , LangeM ( Eds. ) Springer , Heidelberg, Germany , 248 – 257 ( 2014 ).
- Thrun MC , LerchF , LötschJ , UltschA . Visualization and 3D printing of multivariate data of biomarkers . In : Proceedings of International Conference in Central Europe on Computer Graphics, Visualization and Computer Vision.Computer Science Research Notes , Plzen, Czech Republic ( 2016 ).
- Phillips Universitat Marburg. Software . www.uni-marburg.de/fb12/datenbionik/software
- R Development Core Team . R: A Language and Environment for Statistical Computing . Vienna , Austria ( 2008 ). https://cran.r-project.org/doc/manuals/r-release/fullrefman.pdf
- The Comprehensive R Archive Network . http://CRAN.R-project.org/
- Kruskal WH , WallisWA . Use of ranks in one-criterion variance anaylsis . J. Am. Stat. Assoc.47 ( 260 ), 583 – 621 ( 1952 ).
- Dunn OJ . Multiple comparisons using rank sums . Technometrics6 ( 3 ), 241 – 252 ( 1964 ).
- Student . The probable error of a mean . Biometrika6 ( 1 ), 1 – 25 ( 1908 ). www.aliquote.org/cours/2012_biomed/biblio/Student1908.pdf
- Spearman C . The proof and measurement of association between two things . Am. J. Psychol.15 , 72 – 101 ( 1904 ).
- Hochberg Y . A sharper Bonferroni procedure for multiple tests of significance . Biometrika75 ( 4 ), 800 – 802 ( 1988 ).
- Ultsch A , WeingartM , LötschJ . 3-D printing as a tool for knowledge discovery in high dimensional data spaces . In : Statistical Computing.FürstbergerA , LausserL , KrausJM , SchmidM , KestlerHA ( Eds. ) Universität Ulm, Fakultät für Ingenieurwissenschaften und Informatik, Schloss Reisensburg , Günzburg , 12 – 13 ( 2015 ).
- Börner C , MartellaE , HölltV , KrausJ . Regulation of opioid and cannabinoid receptor genes in human neuroblastoma and T cells by the epigenetic modifiers trichostatin A and 5-aza-2’-deoxycytidine . Neuroimmunomodulation19 ( 3 ), 180 – 186 ( 2012 ).
- Oertel BG , KettnerM , ScholichKet al. A common human mu-opioid receptor genetic variant diminishes the receptor signaling efficacy in brain regions processing the sensory information of pain . J. Biol. Chem.284 ( 10 ), 6530 – 6535 ( 2009 ).
- Hameed H , HameedM , ChristoPJ . The effect of morphine on glial cells as a potential therapeutic target for pharmacological development of analgesic drugs . Curr. Pain Headache Rep.14 ( 2 ), 96 – 104 ( 2010 ).
- Ruzicka BB , FoxCA , ThompsonRC , MengF , WatsonSJ , AkilH . Primary astroglial cultures derived from several rat brain regions differentially express mu, delta and kappa opioid receptor mRNA . Brain Res. Mol. Brain Res.34 ( 2 ), 209 – 220 ( 1995 ).
- Stiene-Martin A , ZhouR , HauserKF . Regional, developmental, and cell cycle-dependent differences in μ, and δ, and κ-opioid receptor expression among cultured mouse astrocytes . Glia22 ( 3 ), 249 ( 1998 ).
- Wen L , LiX , YanLet al. Whole-genome analysis of 5-hydroxymethylcytosine and 5-methylcytosine at base resolution in the human brain . Genome Biol.15 ( 3 ), 1 ( 2014 ).
- Wei LN , LohHH . Transcriptional and epigenetic regulation of opioid receptor genes: present and future . Annu. Rev. Pharmacol. Toxicol.51 , 75 – 97 ( 2011 ).
- Börner C , HölltV , KrausJ . Involvement of activator protein-1 in transcriptional regulation of the human mu-opioid receptor gene . Mol. Pharmacol.61 ( 4 ), 800 – 805 ( 2002 ).
- Kraus J , BornerC , GianniniE , HölltV . The role of nuclear factor kappaB in tumor necrosis factor-regulated transcription of the human mu-opioid receptor gene . Mol. Pharmacol.64 ( 4 ), 876 – 884 ( 2003 ).
- Borner C , WoltjeM , HolltV , KrausJ . STAT6 transcription factor binding sites with mismatches within the canonical 5′-TTC…GAA-3′ motif involved in regulation of delta- and mu-opioid receptors . J. Neurochem.91 ( 6 ), 1493 – 1500 ( 2004 ).
- Borner C , HolltV , KrausJ . Cannabinoid receptor type 2 agonists induce transcription of the mu-opioid receptor gene in Jurkat T cells . Mol. Phamracol.69 ( 4 ), 1486 – 1491 ( 2006 ).
- Ono T , KanedaT , MutoA , YoshidaT . Positive transcriptional regulation of the human micro opioid receptor gene by poly(ADP-ribose) polymerase-1 and increase of its DNA binding affinity based on polymorphism of G-172 -> T . J. Biol. Chem.284 ( 30 ), 20175 – 20183 ( 2009 ).
- Andria ML , SimonEJ . Identification of a neurorestrictive suppressor element (NRSE) in the human mu-opioid receptor gene . Brain Res. Mol. Brain Res.91 ( 1–2 ), 73 – 80 ( 2001 ).
- Trivedi M , ShahJ , HodgsonN , ByunHM , DethR . Morphine induces redox-based changes in global DNA methylation and retrotransposon transcription by inhibition of excitatory amino acid transporter type 3-mediated cysteine uptake . Mol. Pharmacol.85 ( 5 ), 747 – 757 ( 2014 ).
- Denk F , McMahonSB . Chronic pain: emerging evidence for the involvement of epigenetics . Neuron73 ( 3 ), 435 – 444 ( 2012 ).