
Abstract
Aim: To study the impact of aging on DNA methylation and mRNA expression in human liver. Experimental procedures: We analysed genome-wide DNA methylation and gene expression in human liver samples using Illumina 450K and HumanHT12 expression BeadChip arrays. Results: DNA methylation analysis of ∼455,000 CpG sites in human liver revealed that age was significantly associated with altered DNA methylation of 20,396 CpG sites. Comparison of liver methylation data with published methylation data in other tissues showed that vast majority of the age-associated significant CpG sites overlapped between liver and blood, whereas a smaller overlap was found between liver and pancreatic islets or adipose tissue, respectively. We identified 151 genes whose liver expression also correlated with age. Conclusions: We identified age-associated DNA methylation and expression changes in human liver that are partly reflected by epigenetic alterations in blood.
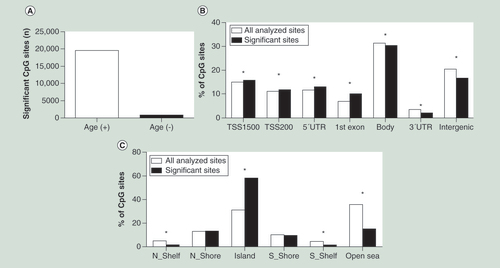
(A) Number of positive and negative correlations of CpG sites significantly associated with age in human liver. (B) Distribution of significant CpG sites compared with all analyzed CpG sites in relation to gene regions, in other words, TSS1500 (200–1500 bp upstream of TSS), TSS200 (200 bp immediate upstream of TSS), 5′UTR, first exon, 3′UTR and intergenic regions (not annotated to any of the regions). (C) Distribution of significant CpG sites compared with all analyzed CpG sites in relation to CpG islands, in other words, N_shore/S_shore (2 kb immediate upstream/downstream of CpG island), N_shelf/S_shelf (2 kb immediate downstream/upstream of shore regions), CpG island and open sea (not annotated to any of these regions).
*p < 0.05. p-values were corrected using Bonferroni correction.
+: Positive association; -: Negative association; N_Shelf: Northern shelf; N_Shore: Northern shore; S_Shelf: Southern shelf; S_Shore: Southern shore; TSS: Transcription start site; UTR: Untranslated region.
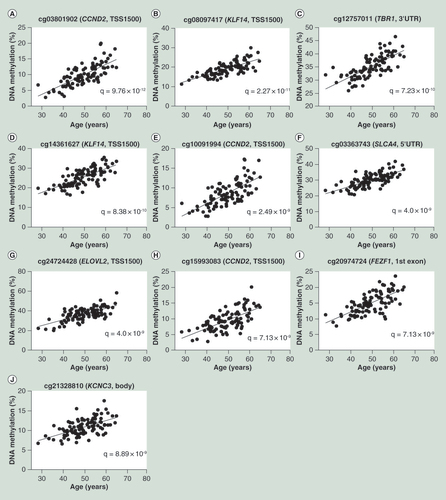
(A) Correlation of top most significant CpG site, cg03801902 of CCND2 and age. (B–J) Correlations of the remaining nine top CpG sites.
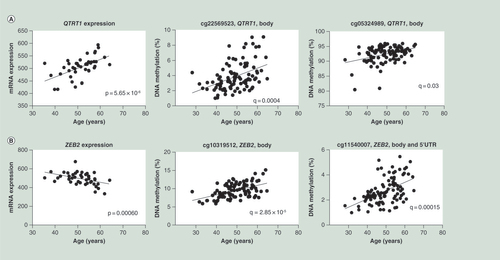
(A) Correlations between age and mRNA expression as well as DNA methylation of QTRT1. (B) Correlations between age and ZEB2 mRNA expression as well as DNA methylation of two CpG sites annotated to ZEB2.
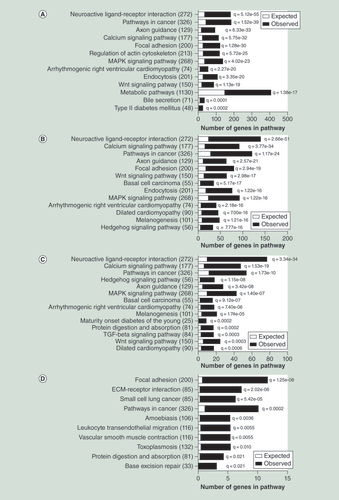
(A) Selected significantly enriched KEGG pathways of the genes with age-associated methylation changes in human liver (Bonferroni adjusted q < 0.05); complete list is presented in Supplementary Table 9). (B) Significant KEGG pathways of the genes with age-associated methylation changes of CpG sites located in CpG islands. (C) Significant KEGG pathways of genes with age-associated methylation changes of shared CpG sites for human liver, blood and adipose tissue. (D) Significant KEGG pathways of the genes with age-associated expression and methylation changes in human liver.
ECM: Extracellular matrix.
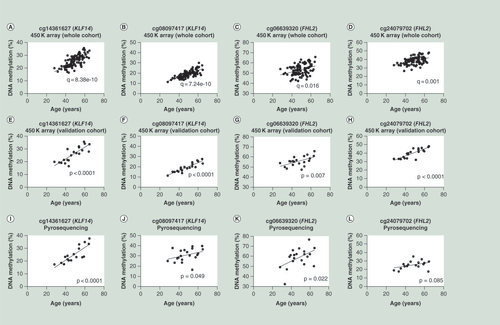
(A–D) Correlations between age and DNA methylation of CpG sites cg14361627, cg08097417, cg06639320 and cg24079702 generated by 450K array for the whole cohort (n = 95). (E–H) Correlations between age and DNA methylation of CpG sites cg14361627, cg08097417, cg06639320 and cg24079702 generated by 450K array for the validation cohort (n = 20). (I–L) Correlations between age and DNA methylation of CpG sites cg14361627, cg08097417, cg06639320 and cg24079702 generated by pyrosequencing assay. The data in the figures (E–L) were analyzed by Spearman r (two tailed).
First draft submitted: 22 July 2016; Accepted for publication: 15 November 2016; Published online: 2 December 2016
The liver is one of the largest organs in the human body and is involved in several functions such as detoxification, metabolism of protein, fat and glucose, glycogen storage and decomposition of red blood cells [Citation1]. Abnormal liver functions may lead to several complications and diseases. A recent study identified changes in DNA methylation and gene expression in the liver from individuals with Type 2 diabetes (T2D), along with reduced folate levels [Citation2], supporting that epigenetic modifications may contribute to liver dysfunction.
Aging is a major risk factor for many diseases, including cancer, cardiovascular diseases and T2D [Citation3]. Some studies report that morphological changes occur in the liver along with aging, in other words, altered size of hepatocytes, decreased blood flow, increased accumulation of lipids and decreased hepatic cell regeneration [Citation1,Citation4]. Additionally, several chronic liver diseases, such as alcoholic liver disease, nonalcoholic fatty liver disease and autoimmune hepatitis, occur more frequently in elderly populations [Citation5]. However, current knowledge of the underlying molecular mechanisms of liver disorders in elderly populations remains limited.
DNA methylation at cytosines of CpG dinucleotides is the most commonly studied epigenetic mark, and numerous environmental factors are found to alter the epigenome [Citation3,Citation6–7]. As DNA methylation investigations can easily be performed in the laboratory, it can be used for epigenome-wide association studies and may also be used as epigenetic biomarkers for prediction of complex diseases [Citation8,Citation9]. Age-related DNA methylation changes have been observed in several human tissues such as the brain, skeletal muscle, adipose tissue and pancreatic islets, as well as in blood [Citation9–14]. Moreover, a recent study showed that obesity accelerates epigenetic aging in human liver [Citation15]. However, the impact of aging on DNA methylation of individual CpG sites in the human liver has not been examined by epigenome-wide association studies.
In this study, our main aim was therefore to investigate the impact of aging on an epigenetic modification, in other words, DNA methylation, in human liver using the Infinium HumanMethylation 450 BeadChip (Illumina) that covers approximately 485,000 CpG sites and 99% of the RefSeq genes [Citation16,Citation17]. We further tested if the age-related DNA methylation changes observed in liver were associated with changes in gene expression and if they reflect previously shown methylation changes in other human tissues and blood.
Experimental procedures
Liver biopsies
Liver biopsies from 95 individuals obtained during a Roux-en-Y gastric bypass surgery were included in this study. The liver biopsies were immediately frozen in liquid nitrogen after the surgery and then stored at -80°C. These biopsies were collected as part of the Kuopio Obesity Surgery Study [Citation2,Citation18–19]. The study was performed in accordance with the Helsinki declaration. Written informed consent was obtained from all participants and the study was approved by the Northern Savo Hospital District ethics committee (54/2005, 104/2008 and 27/2010).
Genome-wide DNA methylation analysis in human liver
DNA was extracted from the human liver biopsies with DNeasy Blood and Tissue kit (Qiagen, Hilden, Germany). The concentration and purity of DNA were determined by a NanoDrop 1000 spectrophotometer (NanoDrop Technologies, DE, USA). Bisulfite treatment was performed with EZ DNA methylation kit (Zymo Research, CA, USA) using 500 ng of DNA. We used Illumina Infinium HumanMethylation450 BeadChip array (Illumina, San Diego, CA, USA) for the methylation analysis. This chip contains 485,577 probes that cover 21,231 (99%) RefSeq genes [Citation16]. The BeadChip images were captured by using the Illumina iScan. All samples showed high quality based on built in control probes for staining, hybridization, extension and specificity, and good bisulfite conversion efficiency (intensity signal >4000). The unprocessed raw data were exported from GenomeStudio and then analyzed using Bioconductor and lumi/methylumi packages. β-values were converted to M-values (M = log2[β/(1 - β)]) [Citation20,Citation21]. Then we removed the 14,548 cross-reactive probes as described in Chen et al. [Citation22], 65 SNP probes (rs-probes), 10,817 X-chromosome and 50 Y-chromosome probes, and 973 non-CpG probes. We also removed the probes with a mean detection p-value of > 0.01 from further analyses. The data were background-corrected and normalized using quantile normalization and the β-mixture quantile normalization method [Citation23]. ComBat [Citation24] was used to correct for batch effects of DNA methylation data. For easier description and interpretation of the data, these were converted back to β-values after the analyses.
Genome-wide gene expression analysis of human liver
Total RNA from human liver biopsies was extracted by using miRNeasy mini kit (Qiagen). The purity and RNA concentration were measured by NanoDrop 1000 spectrophotometer (NanoDrop Technologies). An Agilent 2100 bioanalyzer (Agilent technologies, CA, USA) was used to determine the quality of RNA. Expression analysis was performed in liver from a subset of the individuals included in the DNA methylation analysis (n = 42). The characteristics of these individuals are presented in Supplementary Table 1. HumanHT-12 Expression BeadChip arrays (Illumina, CA, USA) were used for the expression analysis. This chip covers 28,688 transcripts in the human genome.
Statistical analysis
Age, gender, BMI, degree of steatosis, T2D and non-alcoholic steatohepatitis (NASH) were included as covariates in the DNA methylation and RNA expression analysis of human liver biopsies, since of the 95 studied individuals, 35 had a normal liver phenotype, 34 diagnosed as simple steatosis and 26 diagnosed as NASH, while 35 of these individuals were also diagnosed with T2D. Variance inflation factors (VIFs) for multicollinearity of studied phenotypes were calculated as previously described [Citation25]. For the DNA methylation analysis, false discovery rate analysis (FDR) was performed to adjust the p-values for multiple testing, and q < 0.05 was considered significant. For RNA expression analysis, only genes with age-associated methylation changes were analyzed, and p < 0.05 was considered significant. The Chi2 test was used to compare the genomic distribution of significant CpG sites.
Pathway analysis
The KEGG pathway analysis of genes annotated to age-associated CpG sites was performed by WebGestalt [Citation26]. For these analyses, we used either all genes annotated to age-associated CpG sites in liver, genes annotated to the age-associated CpG sites in CpG islands, genes annotated to overlapping age-associated CpG sites of liver, blood and adipose tissue, or the genes that showed both age-associated DNA methylation and gene expression changes in human liver.
Pyrosequencing
To validate the DNA methylation array data, DNA from the liver of a subset of 20 individuals was bisulfite converted using the EpiTect Bisulfite kit (Qiagen) and subject to pyrosequencing using the Pyromark Q96 ID (Qiagen) according to the manufacturer’s instructions. Primers for custom assays were designed using the PyroMark Assay design Software 2.0 and data were analyzed with the PyroMark Q96 2.5.7 software program. The following primer sequences were used for pyrosequencing of KLF14 (covering cg14361627 and cg08097417): F-primer 5′-GGTTTTTAGGTTAAGTTATGTTTAATAGT-3′, R-primer 5′Biotin-AAACTACTACAACCCAAAAATTCC-3′, sequencing primer 5′-ATAGTTTTAGAAATTATTTTGTTT-3′ and FHL2 (covering cg06639320 and cg24079702): F-primer 5′-GGGTTTTGGGAGTATAGTAGT-3′, R-primer 5′Biotin-ACACCTCCTAAAACTTCTCCAATCTCC-3′, sequencing primer 5′-GTTTTGGGAGTATAGTAGTTA-3′.
Images
The images were generated by using GraphPad prism software. The Venn diagram was generated with Venny 2.1 tool [Citation27].
Results
Characteristics of liver donors
To map the epigenome in human liver in relation to age, we analyzed DNA methylation of 455,526 CpG sites in liver biopsies of 95 individuals aged 28–64 years. These individuals are part of the Kuopio Obesity Surgery Study [Citation2,Citation18–19] and their characteristics are described in .
DNA methylation & age in human liver
A linear regression model was used to examine the association between age and DNA methylation of individual CpG sites in human liver. In order to estimate the multicollinearity of the different phenotypes (age, BMI, gender, degree of steatosis, NASH diagnosis and T2D) included in the linear regression model, we first calculated the VIFs for all these phenotypes. All calculated VIFs were close to 1 for the studied phenotypes (age: 1.11, BMI: 1.06, gender: 1.07, degree of steatosis: 1.38, NASH: 1.40 and T2D: 1.13), suggesting that the results obtained for age are independent of disease status and there are minor issues of multicollinearity among these phenotypes which are not of major concern [Citation2]. Next, based on the linear regression model and after correction for multiple testing using a FDR test (FDR < 5%), we found that methylation of 20,396 CpG sites significantly associated with age (Supplementary Table 2). These 20,396 CpG sites are annotated to 6021 unique genes and intergenic regions, of which 3852 genes harbors significant CpG sites annotated to CpG islands. The DNA methylation level of the vast majority of the significant CpG sites in liver, in other words, 19,548 sites (96%), increased and only 848 sites (4%) decreased with age (A).
We next looked at the genomic distribution of the significant age-associated CpG methylation sites in liver either based on the nearest annotated gene or CpG island regions compared with all analyzed CpG sites. We found significant enrichment of age-associated DNA methylation at transcription start site (TSS) 200 or 1500 bp (TSS200 or TSS1500 bp, respectively), 5′untranslated region (UTR) and first exon, whereas at the gene body, 3′UTR and intergenic regions, we observed an under-representation of significant CpG sites when compared with all analyzed CpG sites (B). When we compared the distribution of the age-associated DNA methylation changes in relation to the CpG islands, there was a significant enrichment observed at CpG islands, whereas an under-representation of significant CpG sites was observed at northern shelf, southern shelf and open sea when compared with all analyzed CpG sites. No significant difference was observed at northern shore and southern shore (C).
The most significant correlation between DNA methylation and age was observed at the CpG site cg03801902 in TSS1500 of CCND2, encoding the protein cyclin D2 (q = 9.76 × 10⁻¹²) (A). In total, methylation of 16 age-associated CpG sites annotated to CCND2 was significantly and positively correlated with age (q < 0.05) in human liver supporting an epigenetic regulation of this gene (Supplementary Table 2). provides the top ten significant correlations between age and DNA methylation in human liver.
DNA methylation changes in blood, adipose tissue & pancreatic islets reflect epigenetic aging in human liver
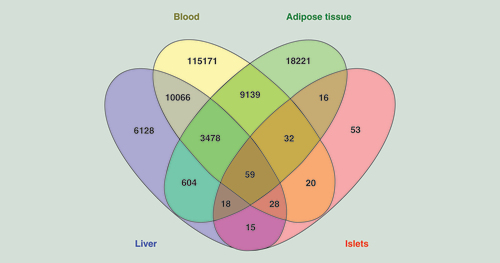
Blood is more easily accessible than many other tissues in the human body and hence useful for analysis of clinical biomarkers. We proceeded to test if age-associated methylation changes in blood cells from published datasets may mirror the methylation changes identified in human liver tissue. We first compared our significant liver DNA methylation results presented in Supplementary Table 2 with previously published age-associated DNA methylation data in white blood cells from 421 donors with an age range of 14–94 years [Citation12]. Interestingly, the vast majority of the significant age-associated methylation sites in liver, in other words, 13,631 sites (67.8%), were also significantly associated with age in white blood cells (), of which 13,022 CpG sites were associated in the same direction in the white blood cells (Supplementary Table 3). For example, the most significant age-associated CpG sites in white blood cells, cg16867657 in the promoter of ELOVL2, encoding fatty acid elongase 2 [Citation12], also strongly correlated with age in human liver (q = 9.72 × 10⁻⁷).
Additionally, Florath et al. have shown that methylation of 162 CpG sites was significantly associated with aging in whole blood [Citation13]. The comparison of these 162 age-associated CpG sites in whole blood with the significant age-associated CpG sites in liver revealed that 100 out of 162 age-associated CpG sites in blood were shared between liver and whole blood [Citation13] and 98 CpG sites between liver, whole blood and white blood cells (Supplementary Table 4). Interestingly, methylation of all shared CpG sites between these tissues showed a positive correlation with age.
Moreover, Steegenga et al. have summarized DNA methylation data from several studies and found 14 genes that have age-related DNA methylation changes in whole blood or different purified blood cells [Citation28]. In a previous study, we also found age-related DNA methylation changes in all these 14 genes in human adipose tissue [Citation10]. Strikingly, also in this study, DNA methylation of all these 14 genes (i.e. ATP8A2 [five CpG sites], DLX5 [ten CpG sites], ELOVL2 [three CpG sites], FOXE3 [nine CpG sites], FHL2 [eight CpG sites], GATA4 [five CpG sites], GLRA1 [six CpG sites], KLF14 [13 CpG sites], NEFM [15 CpG sites], PENK [11 CpG sites], SST [five CpG sites], THRB [seven CpG sites], TMEM179 [four CpG sites] and TP73 [12 CpG sites]) showed positive correlation with age in human liver ().
We also wanted to test if the age-associated DNA methylation changes in liver mirror the age-associated DNA methylation changes previously found in adipose tissue [Citation10]. Interestingly, 4159 (20%) of the sites identified in adipose tissue were also significantly associated with aging in human liver (). The methylation level of 4082 (98.1%) of these shared CpG sites correlated with age in the same direction in both liver and adipose tissue (Supplementary Table 5). We next compared the age-associated CpG sites shared between liver and adipose tissue [Citation10] with sites found in white blood cells [Citation12], and found that 3537 sites are shared between these three tissues (). Importantly, 3470 sites (98.1%) correlated with age in the same direction in all three tissues (Supplementary Table 6).
Another recent study identified 241 sites where the methylation level was significantly associated with aging in human pancreatic islets [Citation9]. When we compared the age-associated methylation data in pancreatic islets with the liver data, 120 sites were shared between the two tissues ( & Supplementary Table 7). These include CpG sites annotated to the genes ELOVL2, KLF14 and FHL2. Interestingly, DNA methylation of all the shared CpG sites between liver and pancreatic islets showed a positive correlation with aging. We further intersected these 120 overlapped CpG sites with the shared CpG sites of liver, adipose tissue and white blood cells, and found 59 CpG sites overlapped between these tissues ( & Supplementary Table 6). Again, methylation of all the CpG sites positively correlated with age in all tissues, which include CpG sites annotated to ELOVL2, KLF14 and FHL2.
Age-associated expression changes of genes with alterations in DNA methylation in human liver
DNA methylation is known to impact the transcriptional activity of nearby genes [Citation2,Citation9–10,Citation29]. We therefore proceeded to test if age is associated with altered expression of any of the genes with age-associated methylation changes presented in Supplementary Table 2. It should be noted that microarray expression data were only available from a subset (n = 42) of the same liver cohort used for DNA methylation analysis and their characteristics are presented in Supplementary Table 1. Here, 151 genes were identified to have both age-associated expression and methylation changes in human liver (Supplementary Table 8). These 151 genes were represented by age-associated methylation changes of 351 CpG sites. The most significant correlation between gene expression and age was observed for QTRT1 (positive correlation; p = 5.65 × 10⁻⁶) (), which encodes Queunine tRNA ribosyl transferase 1. shows the top positive and negative correlations between age and gene expression in human liver together with respective age-associated methylation changes.
Biological pathways of genes with age-associated methylation changes in human liver
We next performed KEGG pathway analysis to identify the biological pathways with the genes whose DNA methylation is significantly associated with aging. A total of 6021 genes were analyzed by WebGestalt, which resulted in 70 significant pathways (Supplementary Table 9). Some of the most enriched pathways for the associations of age and DNA methylation in liver are neuroactive ligand–receptor interaction, cancer pathways, axon guidance, calcium signaling pathways, focal adhesion, regulation of actin cytoskeleton, WNT and MAPK signaling pathways, arrhythmogenic right ventricular cardiomyopathy, endocytosis, metabolic pathways, T2D and bile secretion (A & Supplementary Table 9). We further performed KEGG pathway analysis only with the genes annotated to age-associated CpG sites located at CpG islands (11,883 sites annotated to 3852 genes), and observed similar enriched pathways as we have seen for all annotated age-associated genes (B). Moreover, pathway analysis of genes annotated to age-associated CpG sites shared by liver, blood and adipose tissue found enrichments of neuroactive ligand interaction, calcium signaling pathways, cancer pathways, mature onset diabetes on young, among others (C). Finally, we performed pathway analysis with the genes with both age-associated methylation and expression changes in liver, highlighting pathways such as focal adhesion, extracellular matrix (ECM) receptor interaction and cancer pathways (D).
Age-associated DNA methylation changes in human liver in gene regulatory regions
DNA methylation at transcription factor (TF) binding sites may alter the gene expression [Citation29]. Given this, we wanted to test if the age-associated CpG sites identified in this study are located at gene regulatory regions. Interestingly, approximately 25% of the age-associated significant CpG sites in liver are located at Illumina annotated enhancer (5200 CpG sites, 25.4%) or DNase1 hypersensitive (5373 CpG sites, 26.3%) regions (Supplementary Table 2), which was more than expected by chance (Pchi2 < 0.05), suggesting that methylation of age-associated CpG sites in liver may play a role in gene regulation. Given the large number of CpG sites that were located at enhancers or DNase1 sites, we further wanted to test if any TF recognition sequences were enriched near the genes annotated to CpG sites with age-associated methylation changes in liver. For this, we searched the TRANSFAC and JASPAR databases using Enrichr [Citation30] to find motifs for TFs within -2000 to +500 bp of the TSS of the genes with age-associated methylation changes in liver. The most enriched TF motifs retrieved at these genes were E2F1, FOXC1 and TFAP2A. The significantly enriched top 100 TFs at these genes based on p-value are listed in Supplementary Table 10. Some of these TFs, such as E2F1, TFAP2A NFKB1, HNF4a, HNF1a and SREBF1, are known to play important roles in liver function, liver development and liver-specific activities [Citation31–33]. Moreover, when we looked at our mRNA expression data of the genes encoding these TFs, two genes, in other words, TCF4 and ETS1 showed decreased expression and increased methylation along with increased age.
Age-associated methylation sites annotated to genes in genome-wide association studies
Recent genome-wide association studies (GWAS) have identified numerous candidate genes associated with complex diseases [Citation34]. We have previously shown that some of these candidate genes are also differentially methylated in human tissues [Citation10,Citation35–38]. Additionally, since aging increases the risk for several complex diseases, we proceeded to test if genes with age-related methylation changes in liver have also been identified in GWAS studies. For this, we selected candidate genes associated with diseases or traits where liver function may be important such as BMI, obesity, T2D, diabetes (gestational), diabetes-related insulin traits, fasting glucose, fasting insulin, fasting plasma glucose, high-density lipoprotein cholesterol, low-density lipoprotein cholesterol, lipid metabolism phenotypes, lipid traits, triglycerides, nonalcoholic fatty liver disease, liver enzyme levels, obesity and lipid metabolism phenotypes in the GWAS catalog (p < 9 × 10⁻⁶) ([Citation39], downloaded on 6 May 2016). The search in GWAS catalog retrieved 1722 unique candidate genes associated with the above-mentioned diseases or traits and among these, 594 genes showed age-associated methylation changes in human liver (Supplementary Table 11).
Validation of DNA methylation changes by pyrosequencing
For validation of the Illumina 450K array data in liver, we performed pyrosequencing targeting four CpG sites of the genes KLF14 (cg14361627 and cg08097417) and FHL2 (cg06639320 and cg24079702), with significant age-associated methylation changes in human liver (Supplementary Table 2 & A–D). About 20 subjects with available liver DNA were included in the validation analysis. The pyrosequencing data validated the array data and age-association for three of the selected CpG sites (p < 0.05; E–K), while a nominal positive correlation with age was found for cg24079702 (L).
Discussion
In this study, we present age-associated changes in the methylome of 95 human liver biopsies. Aging also correlated with changes in gene expression in human liver. Based on pathway analysis and examining publically available GWAS data, we found that genes with age-associated methylation changes in liver have functions in liver development and metabolism, as well as age-related and obesity-related disorders such as T2D, cardiovascular diseases and cancer.
The number of studies dissecting epigenetic variation in humans has increased in recent years. Many of these studies have been performed in blood rather than in the primary target tissues due to difficulties accessing human tissues [Citation40]. However, for many clinical phenotypes it may not be relevant to study epigenetic changes in blood. We therefore addressed if altered DNA methylation in blood mirrors the epigenetic aging in human liver. Interestingly, 67.8% of our age-associated DNA methylation changes in liver overlapped with the epigenetic changes in white blood cells in the same direction [Citation12], suggesting that DNA methylation in blood may reflect methylation changes in liver. For example, methylation of CpG sites annotated to the gene ELOVL2 that, in our study, strongly correlated with age in human liver has previously been shown to display the widest methylation range along with age in whole blood [Citation41] and white blood cells [Citation12], suggesting that ELOVL2 could be a possible biomarker for epigenetic aging in human liver. Moreover, the age-associated methylation biomarkers identified in blood in several studies summarized by Steegenga et al. [Citation28] overlapped with our methylation results in liver. These results further support the hypothesis that blood-based epigenetic markers mirror altered DNA methylation patterns in human liver.
DNA methylation patterns are not static and frequently change by many factors such as age and lifestyle [Citation7,Citation9–10,Citation37,Citation42]. Moreover, tissue-specific dynamic DNA methylation has been observed previously. Blood and liver include completely different cell types with different functions. Therefore, it is not surprising to have different epigenetic patterns in the two tissues. However, the tissue specificity of the epigenome is still not fully understood, and it is important to test if epigenetic modifications in more accessible cell types such as blood can be used as biomarkers to mimic epigenetic signatures in target tissues for disease. Our study, as well as previous studies, [Citation9,Citation10] supports both shared and tissue-specific epigenetic alterations with age. In the present study, and our previous studies in adipose tissue and pancreatic islets [Citation9,Citation10], similar methods were used but we still observed a relatively small overlap in age-associated CpG sites suggesting that the differences could be more biology related than algorithm related. Despite the increase in methylation with age in liver and the decreased methylation of the majority of significant sites in blood, 96% of the overlapping sites changed their methylation pattern in the same direction in liver and blood. We have also observed increased methylation with age for the vast majority of significant CpG sites in adipose tissue and pancreatic islets. Interestingly, the top epigenetic markers of aging in blood, including ELOVL2, KLF14 and FHL2, are also among the most significant genes with association between methylation and age in human liver in this study, and in adipose tissue and pancreatic islets in previous studies [Citation9,Citation10].
Defects in multiple organs are known to contribute to complex diseases such as T2D and obesity. For example, there is a close cross talk between hormones secreted from pancreatic islets, and adipose tissue and liver function. Nevertheless, there is limited knowledge whether overlapping epigenetic changes take place in these organs and potentially contribute to disease. We have previously studied the impact of age on DNA methylation in pancreatic islets and adipose tissue [Citation9,Citation10]. In the present study, we found that several of these epigenetic modifications also occur in liver with aging. Interestingly, these include previously reported age-associated genes in blood such as ELOVL2, KLF14 and FHL2. The epigenetic similarities between blood, liver, pancreatic islets and adipose tissue further support that methylation of these CpG sites may be suitable markers for epigenetic aging in multiple target tissues for complex metabolic diseases. Future studies should also aim to dissect the functional role of these genes in liver, islets and adipose tissue. Interestingly, we also observed pathways for age-related diseases such as T2D and cancer. We identified 141 genes in cancer pathways and many of these genes, for example, CDKN2A, RASSF1, APC and TP53, have previously shown altered DNA methylation in hepatocellular carcinoma [Citation43–45], which further support a link between age-associated methylation changes and cancer.
SNPs have been reported to be associated with increased risk of various diseases [Citation34]. These SNPs may alter gene function through differential DNA methylation and subsequently contribute to the disease [Citation35]. Additionally, interactions between epigenetic and genetic factors may predispose to disease [Citation46]. Here, we found an overlap between candidate genes associated with complex diseases in GWAS and genes showing age-associated methylation changes in liver. One example is KLF14, which is one of the ‘well-known’ genes with age-associated methylation changes, and SNPs in this gene are associated with T2D [Citation47]. Interestingly, KLF14 showed increased methylation with aging at 13 CpG sites in our liver cohort and, as mentioned earlier, KLF14 methylation also increases in blood, pancreatic islets and adipose tissue with age [Citation9–10,Citation12], supporting the importance of this gene in age-associated diseases. Importantly, we recently showed that increased methylation of KLF14 in blood from healthy people is associated with decreased future risk of T2D [Citation9], supporting that epigenetic biomarkers may be used to diagnose age-related diseases like T2D.
The most significant association between age and DNA methylation in liver was seen for a CpG site upstream of CCND2. This gene encodes a cycline, which is known to be involved in the cell cycle and in diseases like diabetes. Interestingly, a low-frequency SNP at CCND2 reduces the risk of T2D [Citation48]. All 16 age-associated significant CpG sites annotated to CCND2 showed positive correlation with age, and there was a negative correlation between age and gene expression suggesting that increased methylation in elderly populations may decrease the cell cycle or other processes related to this gene.
A large number of the age-associated CpG sites in liver are located at Illumina annotated DNase1 hypersensitive sites or at enhancer regions that include important regulatory regions and hence could play a role in gene regulation. TFs bind to DNA in a sequence-specific manner and control the gene expression tissue specifically [Citation49]. To further address which TFs may bind at the genes with age-associated methylation changes in liver, we performed Enrichr analysis [Citation30] and found several TF-binding motifs. For example, we have identified that the binding of E2F1, which is one of the crucial TFs involved in cell cycle control [Citation50], has binding motifs at 1520 of the age-associated genes.
We also observed changes in liver gene expression associated with age. Some of the identified genes have previously been found to change with age, for example, our most significant age-associated genes, QTRT1, in human liver showed increased expression also in aging skin cells [Citation51]. We also observed altered liver expression and methylation of TCF4 with age, including a CpG site annotated to the first exon of TCF4. Similarly, increased methylation at the first exon of TCF4 and decreased expression with age were previously reported in gastric mucosa [Citation52]. Additionally, we observed increased expression and decreased DNA methylation of NFKB1B [Citation53] and PTK6 with age. Increased expression of these genes may contribute to age-related liver disease. DNA methylation was initially thought to be a silencing mark, where increased methylation would correlate negatively with gene expression. However, more recent studies support that the function of DNA methylation is dependent on the genomic location where methylation in the gene body has been associated with transcriptional elongation, while methylation in intronic regions may affect alternative splicing events [Citation29]. Accordingly, we observed both negative and positive correlations between DNA methylation and gene expression in this study.
It should be noted that the liver samples used for this study are from people diagnosed with obesity and some with T2D or NASH, and may thereby not reflect DNA methylation and gene expression pattern of the general population. However, we only found a small overlap between previous T2D-associated CpG sites [Citation2] and age-associated CpG sites in liver (eight sites), suggesting that the disease status of these liver samples does not affect the DNA methylation of most of the significant CpG sites in this study.
Conclusion
In summary, a large number of epigenetic changes take place in the human liver along with aging. Some of these epigenetic changes are also associated with differential liver gene expression. Age-related DNA methylation changes in liver also mirror changes in blood, adipose tissue and pancreatic islets. These data suggest that blood-based epigenetic marks should be explored for potential prediction and diagnoses of liver diseases and altered metabolic function and they may have a role in future medicine.
Table 1. Characteristics of liver donors.
Table 2. Previously reported age-associated genes by Steegenga et al. and CpG sites with DNA methylation changes (q < 0.05) in human liver based on age.
Epigenetic mechanisms such as DNA methylation are known to be involved in gene regulation and consequently in the development of disease.
In this study, we analyzed DNA methylation and gene expression in relation to age in human liver using Illumina 450K and HumanHT12 expression BeadChip arrays.
Age was significantly associated with altered DNA methylation of 20,396 CpG sites and expression of 151 genes in human liver.
Age-associated DNA methylation in human liver mirrors numerous epigenetic alterations in blood, adipose tissue and pancreatic islets.
Genes associated with age in previous studies performed in other tissues, such as ELOVL2, KLF14 and FHL2, also showed altered DNA methylation in human liver with age.
There is an enrichment of age-associated CpG sites located in enhancer or open chromatin regions.
In conclusion, our study identified age-associated DNA methylation and expression changes in human liver and these were reflected by blood-based epigenetic alterations.
M Bysani researched data and wrote the manuscript; A Perfilyev analyzed data; VD de Mello analyzed the data, T Rönn performed the pyrosequencing experiments; E Nilsson analyzed the data; J Pihlajamäki designed the study, collected the clinical data; and C Ling designed the study and wrote the manuscript. All authors read the current version of manuscript and approved it.
Ethical conduct of research
The authors state that they have obtained appropriate institutional review board approval or have followed the principles outlined in the Declaration of Helsinki for all human or animal experimental investigations. In addition, for investigations involving human subjects, informed consent has been obtained from the participants involved.
Supplemental Table 1
Download MS Word (12.3 KB)Supplemental Table 2
Download MS Excel (15.2 KB)Supplemental Information 3
Download MS Excel (137.1 KB)Supplemental Table 4
Download MS Excel (2 MB)Supplemental Table 5
Download MS Excel (1.8 MB)Supplemental Table 6
Download MS Excel (30 KB)Supplemental Table 7
Download MS Excel (697 KB)Supplemental Table 8
Download MS Excel (822.4 KB)Supplemental Information 9
Download MS Excel (27.7 KB)Supplemental Table 10
Download MS Excel (75.6 KB)Supplemental Table 11
Download MS Excel (25.5 KB)Acknowledgements
The authors thank P Turunnen, T Sistonen and M Laitinen for their technical assistance in the KOBS study.
Supplementary data
To view the supplementary data that accompany this paper please visit the journal website at: www.tandfonline.com/doi/full/10.2217/epi-2016-0087
Financial & competing interests disclosure
This study has been supported by grants from Academy of Finland (Contract numbers 120,979, 138,006 and 131,593), the Finnish Diabetes Research Foundation, the Finnish Cultural Foundation and the Kuopio University Hospital EVO and VTR funding. The authors thank SCIBLU Genomics facility for microarray analysis. This work was financially supported by grants from the Swedish Research Council, Region Skåne (ALF), Knut and Alice Wallenberg Foundation, Novonordisk Foundation, EFSD/Lilly Fellowship, Söderberg Foundation, The Swedish Diabetes Foundation, Påhlsson Foundation, EXODIAB and Linne grant. The authors have no other relevant affiliations or financial involvement with any organization or entity with a financial interest in or financial conflict with the subject matter or materials discussed in the manuscript apart from those disclosed.
No writing assistance was utilized in the production of this manuscript.
Additional information
Funding
References
- Sheedfar F , BiaseSD , KoonenD , VinciguerraM . Liver diseases and aging: friends or foes?Aging Cell12 ( 6 ), 950 – 954 ( 2013 ).
- Nilsson E , MatteA , PerfilyevAet al. Epigenetic alterations in human liver from subjects with Type 2 diabetes in parallel with reduced folate levels . J. Clin. Endocrinol. Metab.100 ( 11 ), E1491 – E1501 ( 2015 ).
- Ling C , GroopL . Epigenetics: a molecular link between environmental factors and Type 2 diabetes . Diabetes58 ( 12 ), 2718 – 2725 ( 2009 ).
- Anantharaju A , FellerA , ChedidA . Aging liver . Gerontology48 ( 6 ), 343 – 353 ( 2002 ).
- Frith J , JonesD , NewtonJL . Chronic liver disease in an ageing population . Age Ageing38 ( 1 ), 11 – 18 ( 2009 ).
- Skinner MK . Metabolic disorders: fathers’ nutritional legacy . Nature467 ( 7318 ), 922 – 923 ( 2010 ).
- Gillberg L , PerfilyevA , Br⊘nsCet al. Adipose tissue transcriptomics and epigenomics in low birthweight men and controls: role of high-fat overfeeding . Diabetologia59 ( 4 ), 799 – 812 ( 2016 ).
- Rönn T , LingC . DNA methylation as a diagnostic and therapeutic target in the battle against Type 2 diabetes . Epigenomics7 ( 3 ), 451 – 460 ( 2015 ).
- Bacos K , GillbergL , VolkovPet al. Blood-based biomarkers of age-associated epigenetic changes in human islets associate with insulin secretion and diabetes . Nat. Commun.7 , 11089 ( 2016 ).
- Rönn T , VolkovP , GillbergLet al. Impact of age, BMI and HbA1c levels on the genome-wide DNA methylation and mRNA expression patterns in human adipose tissue and identification of epigenetic biomarkers in blood . Hum. Mol. Genet.24 ( 13 ), 3792 – 3813 ( 2015 ).
- Reinius LE , AcevedoN , JoerinkMet al. Differential DNA methylation in purified human blood cells: implications for cell lineage and studies on disease susceptibility . PLoS ONE7 ( 7 ), e41361 ( 2012 ).
- Johansson A , EnrothS , GyllenstenU . Continuous aging of the human DNA methylome throughout the human lifespan . PLoS ONE8 ( 6 ), e67378 ( 2013 ).
- Florath I , ButterbachK , MullerH , Bewerunge-HudlerM , BrennerH . Cross-sectional and longitudinal changes in DNA methylation with age: an epigenome-wide analysis revealing over 60 novel age-associated CpG sites . Hum. Mol. Genet.23 ( 5 ), 1186 – 1201 ( 2014 ).
- Horvath S . DNA methylation age of human tissues and cell types . Genome Biol.14 , R115 ( 2013 ).
- Horvath S , ErhartW , BroschMet al. Obesity accelerates epigenetic aging of human liver . Proc. Natl Acad. Sci. USA111 ( 43 ), 15538 – 15543 ( 2014 ).
- Bibikova M , BarnesB , TsanCet al. High density DNA methylation array with single CpG site resolution . Genomics98 ( 4 ), 288 – 295 ( 2011 ).
- Dedeurwaerder S , DefranceM , CalonneE , DenisH , SotiriouC , FuksF . Evaluation of the infinium methylation 450K technology . Epigenomics3 ( 6 ), 771 – 784 ( 2011 ).
- Pihlajamäki J , KuulasmaaT , KaminskaDet al. Serum interleukin 1 receptor antagonist as an independent marker of non-alcoholic steatohepatitis in humans . J. Hepatol.56 ( 3 ), 663 – 670 ( 2012 ).
- Mannisto VT , SimonenM , SoininenPet al. Lipoprotein subclass metabolism in nonalcoholic steatohepatitis . J. Lipid Res.55 ( 12 ), 2676 – 2684 ( 2014 ).
- Du P , ZhangX , HuangCCet al. Comparison of beta-value and M-value methods for quantifying methylation levels by microarray analysis . BMC Bioinformatics11 ( 1 ), 587 ( 2010 ).
- Du P , KibbeWA , LinSM . lumi: a pipeline for processing Illumina microarray . Bioinformatics24 ( 13 ), 1547 – 1548 ( 2008 ).
- Chen YA , LemireM , ChoufaniSet al. Discovery of cross-reactive probes and polymorphic CpGs in the Illumina Infinium HumanMethylation450 microarray . Epigenetics8 , 203 – 209 ( 2013 ).
- Teschendorff AE , MarabitaF , LechnerMet al. A beta-mixture quantile normalization method for correcting probe design bias in Illumina Infinium 450 k DNA methylation data . Bioinformatics29 ( 2 ), 189 – 196 ( 2013 ).
- Johnson WE , LiC , RabinovicA . Adjusting batch effects in microarray expression data using empirical Bayes methods . Biostatistics8 ( 1 ), 118 – 127 ( 2007 ).
- Fox J , MonetteG . Generalized collinearity diagnostics . J. Am. Stat. Ass.87 ( 417 ), 178 – 183 ( 1992 ).
- WEB-based GEne SeT AnaLysis Toolkit . http://bioinfo.vanderbilt.edu/webgestalt/analysis.php .
- Venny 2.1 . http://bioinfogp.cnb.csic.es/tools/venny/ .
- Steegenga W , BoekschotenM , LuteCet al. Genome-wide age-related changes in DNA methylation and gene expression in human PBMCs . Age (Dordr).36 ( 3 ), 1523 – 1540 ( 2014 ).
- Jones PA . Functions of DNA methylation: islands, start sites, gene bodies and beyond . Nat. Rev. Genet.13 ( 7 ), 484 – 492 ( 2012 ).
- Chen EY , TanCM , KouYet al. Enrichr: interactive and collaborative HTML5 gene list enrichment analysis tool . BMC Bioinformatics14 , 128 ( 2013 ).
- Jump DB , TripathyS , DepnerCM . Fatty acid-regulated transcription factors in the liver . Annu. Rev. Nutr.33 , 249 – 269 ( 2013 ).
- Costa RH , KalinichenkoVV , HoltermanAXL , WangX . Transcription factors in liver development, differentiation, and regeneration . Hepatology38 ( 6 ), 1331 – 1347 ( 2003 ).
- Li Q , LuoC , LöhrCV , DashwoodRH . Activator protein-2α functions as a master regulator of multiple transcription factors in the mouse liver . Hepatol. Res.41 ( 8 ), 776 – 783 ( 2011 ).
- Solovieff N , CotsapasC , LeePH , PurcellSM , SmollerJW . Pleiotropy in complex traits: challenges and strategies . Nat. Rev. Genet.14 ( 7 ), 483 – 495 ( 2013 ).
- Dayeh TA , OlssonAH , VolkovP , AlmgrenP , RönnT , LingC . Identification of CpG-SNPs associated with Type 2 diabetes and differential DNA methylation in human pancreatic islets . Diabetologia56 ( 5 ), 1036 – 1046 ( 2013 ).
- Olsson AH , VolkovP , BacosKet al. Genome-wide associations between genetic and epigenetic variation influence mRNA expression and insulin secretion in human pancreatic islets . PLoS Genet.10 ( 11 ), e1004735 ( 2014 ).
- Ronn T , VolkovP , DavegardhCet al. A six months exercise intervention influences the genome-wide DNA methylation pattern in human adipose tissue . PLoS Genet.9 ( 6 ), e1003572 ( 2013 ).
- Dayeh T , VolkovP , SaloSet al. Genome-wide DNA methylation analysis of human pancreatic islets from Type 2 diabetic and non-diabetic donors identifies candidate genes that influence insulin secretion . PLoS Genet.10 ( 3 ), e1004160 ( 2014 ).
- GWAS Catalog . www.ebi.ac.uk/gwas/home .
- Tobi EW , GoemanJJ , MonajemiRet al. DNA methylation signatures link prenatal famine exposure to growth and metabolism . Nat. Commun.5 , 5592 ( 2014 ).
- Garagnani P , BacaliniMG , PirazziniCet al. Methylation of ELOVL2 gene as a new epigenetic marker of age . Aging Cell11 ( 6 ), 1132 – 1134 ( 2012 ).
- Nitert MD , DayehT , VolkovPet al. Impact of an exercise intervention on DNA methylation in skeletal muscle from first-degree relatives of patients with Type 2 diabetes . Diabetes61 ( 12 ), 3322 – 3332 ( 2012 ).
- Shen J , WangS , ZhangYJet al. Genome-wide DNA methylation profiles in hepatocellular carcinoma . Hepatology55 ( 6 ), 1799 – 1808 ( 2012 ).
- Zhu JD . The altered DNA methylation pattern and its implications in liver cancer . Cell Res.15 ( 4 ), 272 – 280 ( 2005 ).
- Hernandez-Vargas H , LambertMP , Le Calvez-KelmFet al. Hepatocellular carcinoma displays distinct DNA methylation signatures with potential as clinical predictors . PLoS ONE5 ( 3 ), e9749 ( 2010 ).
- Ling C , PoulsenP , SimonssonSet al. Genetic and epigenetic factors are associated with expression of respiratory chain component NDUFB6 in human skeletal muscle . J. Clin. Invest.117 ( 11 ), 3427 – 3435 ( 2007 ).
- Voight BF , ScottLJ , SteinthorsdottirVet al. Twelve Type 2 diabetes susceptibility loci identified through large-scale association analysis . Nat. Genet.42 ( 7 ), 579 – 589 ( 2010 ).
- Yaghootkar H , StancákováA , FreathyRMet al. Association analysis of 29,956 individuals confirms that a low-frequency variant at CCND2 halves the risk of Type 2 diabetes by enhancing insulin secretion . Diabetes64 ( 6 ), 2279 – 2285 ( 2015 ).
- Vaquerizas JM , KummerfeldSK , TeichmannSA , LuscombeNM . A census of human transcription factors: function, expression and evolution . Nat. Rev. Genet.10 ( 4 ), 252 – 263 ( 2009 ).
- Polager S , GinsbergD . p53 and E2f: partners in life and death . Nat. Rev. Cancer9 ( 10 ), 738 – 748 ( 2009 ).
- Glass D , VinuelaA , DaviesMNet al. Gene expression changes with age in skin, adipose tissue, blood and brain . Genome Biol.14 ( 7 ), R75 ( 2013 ).
- Kim SK , JangHR , KimJHet al. CpG methylation in exon 1 of transcription factor 4 increases with age in normal gastric mucosa and is associated with gene silencing in intestinal-type gastric cancers . Carcinogenesis29 ( 8 ), 1623 – 1631 ( 2008 ).
- Bernal GM , WahlstromJS , CrawleyCDet al. Loss of Nfkb1 leads to early onset aging . Aging (Albany NY)6 ( 11 ), 931 – 942 ( 2014 ).