
Abstract
Excitement about DNA methylation biomarkers has been tempered by a growing appreciation of the complex causal relations with cell fate. Intersample differences in DNA methylation can be partitioned into those that are independent of cellular heterogeneity and those that are caused by differential mixtures of cell types. Generally, the field has assumed that the former are more likely to be causative of disease. The latter has been considered a likely consequence of disease and a confounder to be removed. We argue that the conceptual separation of these signals is artificial and not necessarily informative about causation. DNA methylation is a very sensitive measure of cell fate mix and therefore reveals much about underlying disease etiology including aspects of causation.
First draft submitted: 26 February 2017; Accepted for publication: 23 May 2017; Published online: 27 July 2017
DNA methylation marks integrate genetic & environmental influences & hence have potential as prognostic & stratification biomarkers & also as read-outs of intervention efficacy
Loci-specific DNA 5-methylcytosine levels at CpG sites are easily measured at scale in biological samples. They vary across individuals and this variation has been robustly associated with a range of disease phenotypes and environmental exposures [Citation1–6]. As interindividual DNA methylation is specified by the interaction of both genotypic and environmental influences [Citation7,Citation8], it may be a more powerful prognostic biomarker than either genotypic or lifestyle factors alone [Citation9]. DNA methylation is dynamic throughout the lifecourse and is potentially modifiable by therapeutic interventions. This raises the possibility of sensitive real-time biomarkers of disease status to track intervention efficacy [Citation10].
Locus-specific observations were first to demonstrate the role of early life environmental influence on interindividual variation in methylation. For instance, postnatal maternal care in rats or childhood trauma in humans, affects DNA methylation levels at the NR3C1 gene in blood and the hippocampus; methylation levels at this locus then predict adult psychopathology [Citation11–13]. Observations such as this have inspired many epigenome wide association studies (EWAS) to determine the epigenetic consequences of early life influences. Although epigenetic programming was originally envisioned to pertain to very early life factors (i.e., fetal programming, see for example [Citation14]), it could be generalized to account for environmental influences throughout the lifecourse. Some of the best evidence for the later life effect of the environment on DNA methylation is from Fasanelli and colleagues, who showed (by EWAS) that smoking reversibly caused hypomethylation of the AHRR and FR2L3 genes in adults and that approximately 37% of the total effect of smoking on lung cancer risk is mediated by methylation at these loci [Citation15]. Importantly, these findings have recently been independently replicated [Citation16]. Other EWAS have also shown that genetic predisposition to adult onset phenotypes may be mediated by DNA methylation [Citation17,Citation18].
DNA methylation is strongly associated with cellular mix
DNA methylation was not initially recognized as a transmitter of genetic or environmental influences. Instead DNA methylation was recognized as a key indicator of cell differentiation; DNA methylation profiles differ strongly by cell type. This has implications for interpreting interindividual variation in DNA methylation across biological samples. The actual DNA methylation state at any one allele in a single cell is binary, with a given CG dinucleotide (CpG) being either methylated or not. However, the measured DNA methylation signal in a sample at any specific genomic site is a continuous measure. The continuous% methylation value for a sample, represents the averaging of methylation states at that locus across multiple cells (A).
Samples 1 and 2 have 20 cells each (represented by black outlined circles). (A) Differential methylation: ten cells in sample 1 and 12 cells in sample 2 have methylation at specific locus (represented by pink star within cell) so the proportions of methylation in each sample is 50 and 60%. (B) Cellular heterogeneity dependent (Extrinsic) methylation signal: cells colored blue are B cells and cells colored white are other cell types. The 10 B cells in sample 1 and 12 B cells in sample 2 are all methylated at a specific locus (represented by pink star within cell) so the proportions of methylation in each sample is 50 and 60% and exactly equal to the proportions of B cells. (C) Cellular heterogeneity independent (Intrinsic) methylation signal: samples 1 and 2 have the same proportions of B cells (colored blue) and T cells (orange) but sample 1 has 1/3 T cells methylated while sample 2 has 2/3 T cells methylated. (D) Mixed methylation signal: the difference in percent methylation between samples 1 and 2 is partially caused by different proportions of the uniformly methylated B cells (blue) but also by differing methylation proportions of the three T cells (orange) in each sample.
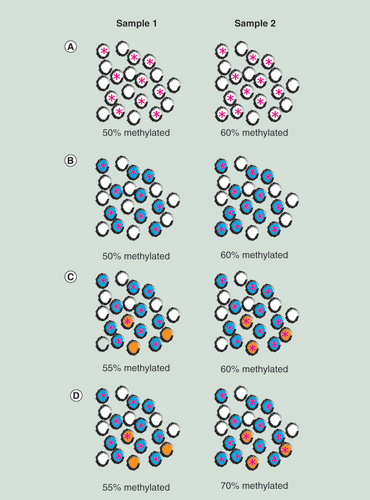
Tissue samples commonly used in EWAS, such as blood, muscle and fat biopsies, placenta and umbilical cord tissue are made up of multiple cell types and the proportions of cells in each sample will vary. Therefore, part of the observed interindividual differences in DNA methylation level is driven by differential cellular proportions. For instance, if all B cells are methylated at a particular locus, while all other cellular constituents of blood are not, variations in the methylation signal at this locus will reflect (at least in part) the proportion of B cells in a blood sample (B). Horvath et al. [Citation19] recently referred to DNA methylation change due to change in cellular proportions as the ‘extrinsic’ signal. Horvath et al. also defined an intrinsic signal as that occurring only within a canonical cell type (C). Of course, samples may (and probably do) differ by cellular proportions and also by methylation state within a cell subtype (D).
In an EWAS, often the methylation values that correlate with phenotype, show a quite small absolute range (e.g., <5%), therefore all sources of variation must be carefully considered [Citation20]. It is important to realize that there are several potential origins of variation, including changed proportions of cell types, each with their own cell type-unique epigenomic ‘signature’.
Disease is also often associated with cellular mix
Many of the diseases studied by EWAS, cause or are caused by changes in cellular mix. This is obviously true for immune-related disorders such as allergic conditions where changes in immune cell numbers are core to the disease process, but is also the case for other conditions, which are typified by chronic inflammatory states. For instance, in obesity and Type 2 diabetes, chronic inflammation in adipose tissue [Citation21], in the liver and systemically [Citation22] causes elevated insulin resistance and decreased insulin sensitivity [Citation23]. Activation and proliferation of immune cells (including neutrophils, macrophages, T cells, B cells, mast cells and eosinophils) underlie this [Citation21,Citation24]. Direct evidence of how this reflects upon the cell mix in peripheral blood samples often studied in EWAS, exists in multiple observational cohorts showing that leukocytes (neutrophils, lymphocytes and monocytes) and their subpopulations are linearly associated with adiposity and metabolic syndrome risk [Citation25]. Therefore, variation in cellular composition of peripheral blood is associated with obesity risk and the consequences of obesity such as Type 2 diabetes.
A salient example of a DNA methylation locus associated with measures of adiposity in blood is HIF3A [Citation26]. Longitudinal and Mendelian randomization analysis suggests that increased HIF3A DNA methylation is a consequence of increasing adiposity [Citation27], maybe mediated by cell fate changes, although the association survives adjustment for gross cell changes and methylation levels predict Type 2 diabetes risk [Citation28]. Also, the example of DNA methylation associating with smoking discussed above has also been shown to be at least partially mediated by cell fate changes caused by smoking, leading to differential cellular heterogeneity within the blood samples of smokers and non-smokers [Citation29].
Methylation changes independent of cell type are not necessarily ‘disease causing’ while methylation change due to cellular heterogeneity is not necessarily ‘caused by disease’
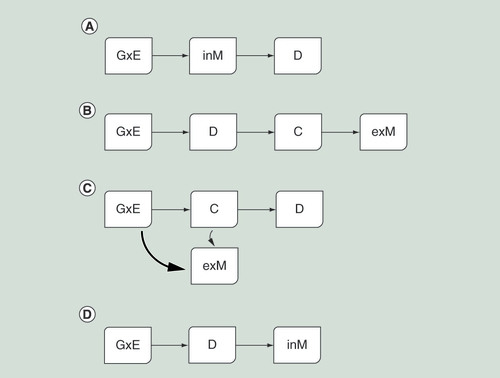
Both DNA methylation level and disease state can be caused by, or be a consequence of, differing cell-type mix. The different scenarios shown in are all credible. However, they have different implications for translation to clinical benefit. The scenario of causation (A) raises the possibility of DNA methylation as a prognostic biomarker and a potential target for intervention (e.g., by inhibiting a protein activated by methylation change). The scenario of reverse causation (B) suggests DNA methylation as a marker to monitor intervention efficacy, as successful intervention in the disease state would be expected to change cellular proportions and hence methylation levels.
Schematics showing (A) a scenario of ‘causation’ whereby the interaction of genetic and environmental effects (GxE) cause methylation change independent of cellular heterogeneity, that is, within a cell type (inM), which causes a later change in disease risk (D). (B) A scenario of ‘reverse causation’ whereby the interaction of genetics and environment (GxE) causes change in disease risk (D), disease causes change in cell fate (C), which then causes large-scale change in methylation signal due to cellular heterogeneity (exM). (C) A scenario of ‘causation’ whereby the interaction of genetics and environment (GxE) causes change in cell fate (C), large-scale methylation change due to cellular heterogeneity is a The change in cell fate alters later disease risk (D). (D) A scenario of ‘reverse causation’ whereby the interaction of genetic and environmental effects (GxE) causes change in disease risk which then causes changes in methylation independent of cellular heterogeneity.
The field of EWAS has treated the difference due to cellular proportions as akin to a technical artifact to be adjusted for before the true signal can be detected and associated with phenotype [Citation30]. Changes in cell mix have been seen a consequence of disease, rather than a cause. The developmental origins of health and disease (DoHAD) hypothesis [Citation31] postulates that an environmental influence early in life, causes epigenetic change and this transmits the ‘cellular memory’ to affect later phenotype. However, it does not specify whether that epigenetic change occurs within a particular cell type or whether it causes differences in cell fate. Conceptually, changes in cell fate seem a possible way to change later disease risk (D). Similarly, we see no reason to suppose that cases of reverse causation (where disease changes methylation levels) are always characterized by changes in mix of canonical cell type, disease-driven changes could occur with a cell subtype (E). Methylation changes as a consequence of cellular heterogeneity are likely to affect numerous loci. In contrast a change independent of cellular heterogeneity may occur only at an individual locus.
Partitioning the relative contributions of cellular mix & change within a canonical cell type is challenging
Locus-specific DNA methylation change within a cell type and DNA methylation change caused by cellular heterogeneity do not map neatly to causal or reverse causation scenarios. However, some have attempted to measure only DNA methylation differences that are not due to cellular heterogeneity, by deriving samples with as pure a cell type as possible. For example, blood can be fractionated and DNA methylation investigated in specific cell types [Citation32–35]. However, even relatively ‘pure’ populations of cells, such as CD4+ T cells, actually comprise many functionally and epigenetically distinct cell subpopulations (Th1, Th2, Th17, Treg, etc.). Although it is possible to deconvolute these lineages, it is logistically difficult in limited samples and resource intensive. Another possibility for blood-based study is to directly measure the cell count in the DNA sample [Citation36,Citation37] and determine how much of the methylation signal is co-linear with the cell counts. However, such measures are not always feasible, for instance, when studying previously frozen samples, or solid tissues that are not easily fractionated. Again, sorting is limited in its resolution of specific subpopulations. Single-cell transcriptomics offers far greater resolution and can be used to define ‘transcriptional signatures’ of the cell subtypes in a tissue and then those signatures can be used to estimate proportions from whole-sample transcriptomic data and used to adjust EWAS data. However, the mapping between transcriptional signature derived cell types and canonical cell types is unclear and the whole definition of a subtype is questionable (see next section). Alternatively, cellular heterogeneity can be estimated using statistical approaches. These can use a priori methylation signatures for specific cell types [Citation38] with cell counts potentially supplemented by imputation methods [Citation39]. Such approaches require the development of reference methylation values for individual cell subpopulations within a tissue of interest; this has been done to a limited extent for blood but not at high-resolution for all age groups and ethnicities. Such panels are also needed for other complex tissues regularly used in EWAS. An alternative recent approach uses cell-type specific DNAse hypersensitive sites measured in many cell types by the ENCODE consortium and so is applicable to many other tissue [Citation40,Citation41]. Other statistical approaches make the assumption that co-variation across many loci represents cell type and so adjusts for these major sources of variation [Citation42–44]. The use of such methods and their inherent assumptions are controversial [Citation45,Citation46].
Apart from the practical problems of determining cellular proportions, there are also statistical issues to consider when examining them in an EWAS. Measured DNA methylation can be highly correlated with many estimated cell proportions. Therefore, when DNA methylation and estimated cell type proportions are entered as predictors into a regression model the statistical assumption of no collinearity between predictors is violated. The resulting multicollinearity causes instability in the estimates of regression coefficients as well as an increase in their standard errors. This can lead to apparent changes in the direction of association between DNA methylation and outcome when cellular proportions are included in the model. One solution to this is to omit one of the cellular proportions from the model to reduce multicollinearity; however, this may not be desirable as potentially useful biological information could be lost.
What is a cell type anyway?
Attempts to define cellular heterogeneity independent and dependent signals suffer from an unclear definition of cell subtype. Every cell is different from every other cell, not only in canonical cell type but also by spatial position (in the body, organ and tissue), cell cycle stage, differentiation status and cumulative previous environmental exposures. Cell types are traditionally classified according to morphology and specific combinations of cell surface and other markers. However, these are rather arbitrary distinctions limited by current knowledge and available resources. Advances in single cell ‘omics’ provide a more complex picture of identity, often revealing continuums of multiple facets of cellular plasticity [Citation47]. Therefore, the distinction between DNA methylation changes at single loci within a canonical cell type (intrinsic in Horvath’s definition [Citation19]) and changed cell fate characterized by DNA methylation changes at multiple loci (extrinsic by Horvath’s definition) is just one of scale. How do we define where variation within a specific cell subtype ends and a new cellular fate begins? Are two cells with near identical methylomes always the same cell type? How many loci need to change before the cells diverge into distinct entities?
DNA methylation potentially captures this complexity at a single cell level [Citation48]. However, such single-cell approaches are unlikely to be practical or economic on large numbers of clinical or population-based cohort samples. DNA methylation measured in the whole sample at a particular locus, co-linear with canonical cell types, is also driven by the subtle complexities of cellular identity. Interventions that cause shifts in the relevant cellular identities of the sample can theoretically be tracked by DNA methylation.
Is cell mix a confounder to be discarded?
The challenges of cell mix in the interpretation of DNA methylation studies remain unresolved. Regardless, recently researchers have begun to question whether the methylation signal determined by cell mix should be discarded as a merely a technical artefact. Horvath et al. [Citation19] and Quach et al. [Citation49] found their intrinsic and extrinsic signals of aging in blood correlated with different lifestyle factors and outcomes. Cell mix driven DNA methylation signal may be extremely relevant to prognostic biomarkers and trackers of intervention efficacy. This is particularly true for blood-based studies of immune and adiposity-related disorders, where changes in cellular composition often strongly associate with phenotypes of interest. Compared with the transcriptome, which is also strongly implicated in cell fate, the methylome may be more specific as a biomarker, by virtue of its greater stability.
Future perspective
Variation in DNA methylation at a particular locus in a specific sample may be both a cause and consequence of disease state and cell mix. As such, it has potential for use as an intervention target, prognostic biomarker and a biomarker for intervention efficacy. If DNA methylation is to provide molecular targets for intervention, it is necessary to first demonstrate its involvement in the causal pathway to disease. The downstream effects of DNA methylation marks associated with disease are important context for this. For instance, DNA methylation changes may change chromatin state and binding of transcription factors [Citation50] and consequent changes in transcript and protein levels [Citation51]. These may happen in only one cell subtype, or in more than one cell type and they may also be causative to changes in cell fate. The emergence of in vitro technologies that link manipulation of methylation state with cellular transcriptomics and phenotypes are a promising route to building such causal evidence [Citation52]. However, if the goal is simply to use DNA methylation as prognostic biomarkers or as trackers of intervention efficacy, direct evidence of a role in disease etiology may not be needed. There has been an assumption that DNA methylation variation, which is a consequence of cellular heterogeneity is unlikely to be causative of disease or reversible by therapeutic intervention. However, a binary categorization of what is intrinsic and extrinsic of cell subtype may be unhelpful as it belies a more nuanced spectrum of cell fate. Cell fate decisions and changes in cellular composition are obviously extremely pertinent to disease risk in many circumstances and, therefore, DNA methylation levels tracking with cell identity/fate are also promising biomarkers for tracking disease trajectories associated with changes in cellular composition. These marks may be powerful tools to direct interventions and track the dynamics of cell identity in a variety of complex diseases.
It is not possible (certainly in cross-sectional epigenome wide association studies) to properly distinguish the causes of interindividual variation in methylation as either cellular heterogeneity dependent (caused by differences in cell mix/fate also known as extrinsic) from cellular heterogeneity independent (i.e., caused by regulatory change within a cell type, also known as intrinsic).
It may also be unhelpful as cellular heterogeneity independent and dependent methylation differences do not necessarily map neatly to disease-causing and reverse-causation categories, respectively, as sometimes assumed.
In a binary distinction of DNA methylation dependent or not on cellular heterogeneity is not necessarily a punctate reality; rather cells exist along continuous fate spectra.
Cell fate is related to disease both as a cause and consequence. Interindividual variation in DNA methylation may be a subtle measure of cell fate, which is more sensitive and convenient than other proxies and more specific than transcriptomics.
Notwithstanding the above, understanding complex causal relations between methylation, disease and cell fate are important in realizing the potential of DNA methylation biomarkers.
One particularly relevant use of DNA methylation biomarkers may be in tracking treatment efficacy as a read-out of changes in cell fate caused by clinical benefit.
Financial & competing interests disclosure
KA Lillycrop, SJ Barton and JD Holbrook are part of an academic consortium that has received research funding from Abbott Nutrition and Nestec. JD Holbrook is supported by the National Institute for Health Research through the NIHR Southampton Biomedical Research Centre. R-C Huang is supported by NH&MRC Fellowship #1053384. The authors have no other relevant affiliations or financial involvement with any organization or entity with a financial interest in or financial conflict with the subject matter or materials discussed in the manuscript apart from those disclosed.
No writing assistance was utilized in the production of this manuscript.
Additional information
Funding
References
- Perfilyev A , DahlmanI , GillbergLet al. Impact of polyunsaturated and saturated fat overfeeding on the DNA-methylation pattern in human adipose tissue: a randomized controlled trial . Am. J. Clin. Nutr.105 ( 4 ), 991 – 1000 ( 2017 ).
- Ligthart S , MarziC , AslibekyanSet al. DNA methylation signatures of chronic low-grade inflammation are associated with complex diseases . Genome Biol.17 ( 1 ), 255 ( 2016 ).
- Rask-Andersen M , MartinssonD , AhsanMet al. Epigenome-wide association study reveals differential DNA methylation in individuals with a history of myocardial infarction . Hum. Mol. Genet.25 ( 21 ), 4739 – 4748 ( 2016 ).
- Lin X , LimIY , WuYet al. Developmental pathways to adiposity begin before birth and are influenced by genotype, prenatal environment and epigenome . BMC Med.15 ( 1 ), 50 ( 2017 ).
- Mendelson MM , MarioniRE , JoehanesRet al. Association of body mass index with DNA methylation and gene expression in blood cells and relations to cardiometabolic disease: a mendelian randomization approach . PLoS Med.14 ( 1 ), e1002215 ( 2017 ).
- Delgado-Morales R , EstellerM . Opening up the DNA methylome of dementia . Mol. Psychiatry22 ( 4 ), 485 – 496 ( 2017 ).
- Teh AL , PanH , ChenLet al. The effect of genotype and in utero environment on interindividual variation in neonate DNA methylomes . Genome Res.24 ( 7 ), 1064 – 1074 ( 2014 ).
- Van Dongen J , NivardMG , WillemsenGet al. Genetic and environmental influences interact with age and sex in shaping the human methylome . Nat. Commun.7 , 11115 ( 2016 ).
- Holbrook JD . An epigenetic escape route . Trends Genetics31 ( 1 ), 2 – 4 ( 2015 ).
- Holbrook JD . Catching diabetes . Epigenomics8 ( 9 ), 1173 – 1177 ( 2016 ).
- Weaver IC , CervoniN , ChampagneFAet al. Epigenetic programming by maternal behavior . Nat. Neurosci.7 ( 8 ), 847 – 854 ( 2004 ).
- Mcgowan PO , SasakiA , D’alessioACet al. Epigenetic regulation of the glucocorticoid receptor in human brain associates with childhood abuse . Nat. Neurosci.12 ( 3 ), 342 – 348 ( 2009 ).
- Turecki G , MeaneyMJ . Effects of the social environment and stress on glucocorticoid receptor gene methylation: a systematic review . Biol. Psychiatry79 ( 2 ), 87 – 96 ( 2016 ).
- Godfrey KM , SheppardA , GluckmanPDet al. Epigenetic gene promoter methylation at birth is associated with child’s later adiposity . Diabetes60 ( 5 ), 1528 – 1534 ( 2011 ).
- Fasanelli F , BagliettoL , PonziEet al. Hypomethylation of smoking-related genes is associated with future lung cancer in four prospective cohorts . Nat. Commun.6 , 10192 ( 2015 ).
- Baglietto L , PonziE , HaycockPet al. DNA methylation changes measured in pre-diagnostic peripheral blood samples are associated with smoking and lung cancer risk . Int. J. Cancer140 ( 1 ), 50 – 61 ( 2017 ).
- Liu Y , AryeeMJ , PadyukovLet al. Epigenome-wide association data implicate DNA methylation as an intermediary of genetic risk in rheumatoid arthritis . Nat. Biotechnol.31 ( 2 ), 142 – 147 ( 2013 ).
- Kato N , LohM , TakeuchiFet al. Trans-ancestry genome-wide association study identifies 12 genetic loci influencing blood pressure and implicates a role for DNA methylation . Nat. Genetics47 ( 11 ), 1282 – 1293 ( 2015 ).
- Horvath S , GurvenM , LevineMEet al. An epigenetic clock analysis of race/ethnicity, sex, and coronary heart disease . Genome Biol.17 ( 1 ), 171 ( 2016 ).
- Lin X , BartonS , HolbrookJD . How to make DNA methylome wide association studies more powerful . Epigenomics8 ( 8 ), 1117 – 1129 ( 2016 ).
- Wu D , MolofskyAB , LiangHEet al. Eosinophils sustain adipose alternatively activated macrophages associated with glucose homeostasis . Science332 ( 6026 ), 243 – 247 ( 2011 ).
- Duncan BB , SchmidtMI , PankowJSet al. Low-grade systemic inflammation and the development of Type 2 diabetes: the atherosclerosis risk in communities study . Diabetes52 ( 7 ), 1799 – 1805 ( 2003 ).
- Gregor MF , HotamisligilGS . Inflammatory mechanisms in obesity . Annu. Rev. Immunol.29 , 415 – 445 ( 2011 ).
- Talukdar S , OhDY , BandyopadhyayGet al. Neutrophils mediate insulin resistance in mice fed a high-fat diet through secreted elastase . Nat. Med.18 ( 9 ), 1407 – 1412 ( 2012 ).
- Babio N , Ibarrola-JuradoN , BulloMet al. White blood cell counts as risk markers of developing metabolic syndrome and its components in the PREDIMED study . PLoS ONE8 ( 3 ), e58354 ( 2013 ).
- Dick KJ , NelsonCP , TsaprouniLet al. DNA methylation and body-mass index: a genome-wide analysis . Lancet383 ( 9933 ), 1990 – 1998 ( 2014 ).
- Richmond RC , SharpGC , WardMEet al. DNA methylation and body mass index: investigating identified methylation sites at HIF3A in a causal framework . Diabetes65 ( 5 ), 1231 – 1244 ( 2016 ).
- Holbrook JD . Does diet interact with genotype to cause epigenetic modification of angiogenesis genes, on the trajectory to obesity?Epigenomics8 ( 6 ), 741 – 745 ( 2016 ).
- Su D , WangX , CampbellMRet al. Distinct epigenetic effects of tobacco smoking in whole blood and among leukocyte subtypes . PLoS ONE11 ( 12 ), e0166486 ( 2016 ).
- Jaffe AE , IrizarryRA . Accounting for cellular heterogeneity is critical in epigenome-wide association studies . Genome Biol.15 ( 2 ), R31 ( 2014 ).
- Gluckman PD , HansonMA , BuklijasT , LowFM , BeedleAS . Epigenetic mechanisms that underpin metabolic and cardiovascular diseases . Nat. Rev. Endocrinol.5 ( 7 ), 401 – 408 ( 2009 ).
- Reinius LE , AcevedoN , JoerinkMet al. Differential DNA methylation in purified human blood cells: implications for cell lineage and studies on disease susceptibility . PLoS ONE7 ( 7 ), e41361 ( 2012 ).
- Kulis M , MerkelA , HeathSet al. Whole-genome fingerprint of the DNA methylome during human B cell differentiation . Nat. Genetics47 ( 7 ), 746 – 756 ( 2015 ).
- Martino D , JooJE , Sexton-OatesAet al. Epigenome-wide association study reveals longitudinally stable DNA methylation differences in CD4+ T cells from children with IgE-mediated food allergy . Epigenetics9 ( 7 ), 998 – 1006 ( 2014 ).
- Heyn H , LiN , FerreiraHJet al. Distinct DNA methylomes of newborns and centenarians . Proc. Natl Acad. Sci. USA109 ( 26 ), 10522 – 10527 ( 2012 ).
- Carmona JJ , SoferT , HutchinsonJet al. Short-term airborne particulate matter exposure alters the epigenetic landscape of human genes associated with the mitogen-activated protein kinase network: a cross-sectional study . Environ. Health13 , 94 ( 2014 ).
- Zhu ZZ , HouL , BollatiVet al. Predictors of global methylation levels in blood DNA of healthy subjects: a combined analysis . Int. J. Epidemiol.41 ( 1 ), 126 – 139 ( 2012 ).
- Houseman EA , AccomandoWP , KoestlerDCet al. DNA methylation arrays as surrogate measures of cell mixture distribution . BMC Bioinformatics13 , 86 ( 2012 ).
- Chambers JC , LohM , LehneBet al. Epigenome-wide association of DNA methylation markers in peripheral blood from Indian Asians and Europeans with incident Type 2 diabetes: a nested case-control study . Lancet Diabetes Endocrinol.3 ( 7 ), 526 – 534 ( 2015 ).
- Teschendorff AE , BreezeCE , ZhengSC , BeckS . A comparison of reference-based algorithms for correcting cell-type heterogeneity in Epigenome-Wide Association Studies . BMC Bioinformatics18 ( 1 ), 105 ( 2017 ).
- Breeze CE , PaulDS , Van DongenJet al. eFORGE: a tool for identifying cell type-specific signal in epigenomic data . Cell Rep.17 ( 8 ), 2137 – 2150 ( 2016 ).
- Houseman EA , MolitorJ , MarsitCJ . Reference-free cell mixture adjustments in analysis of DNA methylation data . Bioinformatics30 ( 10 ), 1431 – 1439 ( 2014 ).
- Rahmani E , ZaitlenN , BaranYet al. Sparse PCA corrects for cell type heterogeneity in epigenome-wide association studies . Nat. Methods13 ( 5 ), 443 – 445 ( 2016 ).
- Van Iterson M , Van ZwetEW , ConsortiumB , HeijmansBT . Controlling bias and inflation in epigenome- and transcriptome-wide association studies using the empirical null distribution . Genome Biol.18 ( 1 ), 19 ( 2017 ).
- Rahmani E , ZaitlenN , BaranYet al. Correcting for cell-type heterogeneity in DNA methylation: a comprehensive evaluation . Nat. Methods14 ( 3 ), 218 – 219 ( 2017 ).
- Zheng SC , BeckS , JaffeAEet al. Correcting for cell-type heterogeneity in epigenome-wide association studies: revisiting previous analyses . Nat. Methods14 ( 3 ), 216 – 217 ( 2017 ).
- Wagner A , RegevA , YosefN . Revealing the vectors of cellular identity with single-cell genomics . Nat. Biotechnol.34 ( 11 ), 1145 – 1160 ( 2016 ).
- Farlik M , SheffieldNC , NuzzoAet al. Single-cell DNA methylome sequencing and bioinformatic inference of epigenomic cell-state dynamics . Cell Rep.10 ( 8 ), 1386 – 1397 ( 2015 ).
- Quach A , LevineME , TanakaTet al. Epigenetic clock analysis of diet, exercise, education, and lifestyle factors . Aging (Albany NY)9 ( 2 ), 419 – 446 ( 2017 ).
- Lillycrop KA , CostelloPM , TehALet al. Association between perinatal methylation of the neuronal differentiation regulator HES1 and later childhood neurocognitive function and behaviour . Int. J. Epidemiol.44 ( 4 ), 1263 – 1276 ( 2015 ).
- Lillycrop K , MurrayR , CheongCYet al. ANRIL promoter DNA methylation: a perinatal marker for later adiposity . eBioMedicine19 , 60 – 72 ( 2017 ).
- Thakore PI , BlackJB , HiltonIB , GersbachCA . Editing the epigenome: technologies for programmable transcription and epigenetic modulation . Nat. Methods13 ( 2 ), 127 – 137 ( 2016 ).