
Abstract
Aim: To investigate the role of DNA methylation during erythrocyte production by human embryonic stem cells (hESCs). Methods: We employed an erythroid differentiation model from hESCs, and then tracked the genome-wide DNA methylation maps and gene expression patterns through an Infinium HumanMethylation450K BeadChip and an Ilumina Human HT-12 v4 Expression Beadchip, respectively. Results: A negative correlation between DNA methylation and gene expression was substantially enriched during the later differentiation stage and was present in both the promoter and the gene body. Moreover, erythropoietic genes with differentially methylated CpG sites that were primarily enriched in nonisland regions were upregulated, and demethylation of their gene bodies was associated with the presence of enhancers and DNase I hypersensitive sites. Finally, the components of JAK-STAT-NF-κB signaling were DNA hypomethylated and upregulated, which targets the key genes for erythropoiesis. Conclusion: Erythroid lineage commitment by hESCs requires genome-wide DNA methylation modifications to remodel gene expression dynamics.
Erythrocyte transfusion is useful for many patients with hematological disorders or emergencies. As erythrocyte supply depends on limited voluntary donations and involves the risk of infectious disease transmission, human embryonic stem cells (hESCs) are ideal candidates for in vitro erythropoiesis due to their nonimmunoreactive nature and limitless quantities [Citation1–3]. However, many technical obstacles must be overcome to achieve single-lineage differentiation. Thus, understanding the mechanisms governing pluripotent stem cell erythropoiesis is highly important.
DNA methylation at CpG dinucleotide, which constitutes the most important epigenetic modification, regulates the gene expression dynamics of transcription factors during erythropoiesis [Citation4]. However, the role of total-genome DNA methylation in determining stem cell fate and erythroid-lineage commitment remains poorly understood. Employing large-scale DNA methylation mapping, some in vivo studies have uncovered the changes in DNA methylation during hematopoietic stem cell (HSC) or hematopoietic progenitor cell differentiation and lineage commitment [Citation4–7], and in vitro studies have revealed hypomethylation events that occur during erythropoiesis [Citation4,Citation8], although some studies directly comparing differentiated cell types have detected virtually no demethylation during cellular differentiation, indicating increased DNA methylation-mediated epigenetic repression during lineage specification [Citation9,Citation10]. Therefore, hypomethylation may be more significant for erythropoiesis than the development of other cell type. Moreover, according to a recent study, methylation is most relevant at the HSC level but less so after lineage commitment [Citation11]. As determined using Dnmt3a−/− and Dnmt3b−/− HSCs, de novo methylation is important for HSC renewal but not for differentiation [Citation12]; this notion is further supported by a recent study examining the differentiation of CD34+ cells into reticulocytes that compared early and late erythroid progenitors, revealing progressive hypomethylation to be the predominant change in DNA methylation [Citation13]. Thus, DNA demethylation is an essential epigenetic mechanism for erythroid differentiation programs in both ESCs and HSCs.
Many genomic-scale studies or single-gene studies of DNA methylation had only focused on gene promoters and CpG islands [Citation7,Citation14–15]. However, regions outside of the promoters, as well as non-CpG island loci, are also very important for transcriptional regulation [Citation16,Citation17]. For example, a study examining erythropoiesis from CD34+ stem/hematopoietic cells revealed preferential progressive hypomethylation in gene bodies, intergenic regions and CpG shores; moreover, gene body hypomethylation was associated with decreased gene expression, in contrast to the effects of hypomethylation at promoters [Citation13]. The true role of methylation changes in different genomic contexts must still be explored, taking into account numerous hypomethylation events – particularly at distinct differentiation stages.
In this study, we took advantage of a robust erythropoiesis differentiation model, which can generate 1010–1011 erythroid cells/6-well plate of hESCs, to investigate the role of DNA methylation/demethylation during the earlier stages of mesoderm progenitor specification and later erythroid-specific commitment. This differentiation system includes hESCs differentiated into early-stage embryoid bodies (EBs) with the potential to generate hemangioblasts (hES-EBs), and erythroid blasts (hES-BLs) [Citation1,Citation3,Citation18].
Erythropoiesis in mouse fetal liver has been improved associated with genome-wide loss of one third of all DNA methylation at nearly all genomic loci through the reduced representation bisulfite sequencing, which covered all promoter regions, CpG islands and enhancers [Citation7]. However, wider scale of DNA methylation should be investigated for comprehensive understanding of the process upon erythroid lineage commitment. Therefore, we tracked DNA methylation maps in three cell types based on a newly developed HM450K cytosine microarray, which includes CpG and CNG sites, CpG islands/shores/shelves/open sea, noncoding RNA and sites surrounding the gene bodies and 3′-UTRs, and then investigated the regulatory roles of changes in DNA methylation associated with genome-wide gene expression profiles. Our data emphasized the requirement for genome-wide DNA methylation modification to remodel gene expression dynamics and achieve hESC commitment to an erythroid lineage. Thus, the current study provides a potential epigenetics strategy for in vitro erythropoiesis.
Results
DNA methylation profiling at CpG sites upon hESC erythropoiesis
We first monitored differentially methylated CpG (DMC) sites at two distinct differentiation stages (stage one: hESCs→hES-EBs; stage two: hES-EBs→hES-BLs). Methylation levels at 639 CpG sites were changed during stage one. Of these sites, 85.29% were hypomethylated and 14.7% were hypermethylated. During stage two, the methylation levels of 100,991 CpG sites (hyper: 66.68% and hypo: 33.32%) were significantly changed. A total of 134,736 DMC sites were identified when hES-BLs were compared with hESCs (A), suggesting that the methylation patterns of hES-BLs differed substantially from those of hES-EBs or hESCs. Moreover, the number of hypomethylated events significantly exceeded the number of hypermethylated events during erythropoiesis.
(A) Scatter plots comparing averaged beta-values from DNA methylation microarrays for 450,000 CpG sites in three cell types. Hyper-CpGs and hypo-CpGs were shown in the upper-left and lower-right areas, respectively. Differentially methylated CpG sites were filtered based on a Diff-score = ±13 (equal to p = 0.05) in hES-EBs (n = 3) versus human embryonic stem cells (hESCs) (n = 3), a Diff-score = ± 20 (equal to p = 0.01) in hES-BLs (n = 4) versus hES-EBs, or a Diff-score = ±30 (equal to p = 0.001) in hES-BLs versus hESCs. (B) DNA methylation portrait in hES-EBs versus hESCs. The following key features were depicted: percentage of hypermethylation (red) or hypomethylation (green), the CpG content and neighborhood context, the distribution of hyper-CpGs or hypo-CpGs according to the functional genome distribution and the associated RNA transcription (Bonferroni corrected one-sided Fisher’s exact p < 0.01). (C) DNA methylation portrait in hES-BLs versus hES-EBs. (D) Amplification plot of real-time MSP for SOX2, GATA2 and GYPB genes were performed in three cell samples. △Ct ≥5 represents a high level of methylated/unmethylated differentiation. Products were obtained primers only, suggesting that CpG sites in the promoter are hypermethylated, conversely, if only UM primers get their products represents the CpG sites in the promoter are unmethylated. If PCR was successful with both of primer for detecting methylated DNA (M) and primer for detecting unmethylated DNA (UM), the CpG sites are methylated partially.
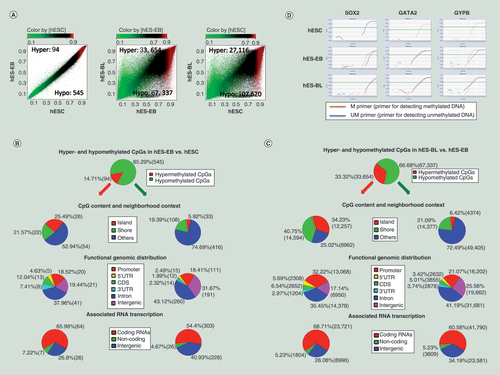
Next, we investigated the locations of DMC sites in the whole genome. During stage one, the proportions of hypermethylated CpG sites (hyper-CpGs) located in CpG islands, CpG shores, and other locations (shelves and open sea) were 25.49, 21.57 and 52.94%, respectively. Hypomethylated CpG sites (hypo-CpGs) accounted for 5.92, 19.3 and 74.69% of these sites, respectively (B). Thus, in CpG islands, hyper-CpGs were more frequent than hypo-CpGs, but regions far from islands were rich in hypo-CpGs. Subsequently, based on functional genomic distributions, 18.52% of hypermethylation events and 18.14% of hypomethylation events occurred in promoter regions, and 50% of hyper-CpGs and 45.11% of hypo-CpGs were enriched in gene bodies (coding sequencing and introns) (B). In terms of associated RNA transcription, 65.98% of hyper-CpGs and 54.45% of hypo-CpGs were located on coding RNA (B). Based on these results, DMC sites in the gene body might also participate in hES-EBs generation through transcriptional regulation, with the exception of sites in promoters.
Additionally, among the more expansive DMC sites, 34.23, 40.75 and 25.02% of hyper-CpGs were located in CpG islands, CpG shores, and others, respectively, during stage two, while hypo-CpGs accounted for 6.42, 21.09 and 72.49% within each site type, respectively (C), indicating hyper-CpGs were primarily distributed in CpG islands and shores, but hypo-CpGs were enriched in shelves and open sea. Moreover, hypermethylation events (32.22%) were found more often than hypomethylation events (21.07%) in promoter regions. In gene bodies, hypo-CpGs (46.2%) were enriched slightly more than hyper-CpGs (41.99%). Importantly, the majority of DMC sites were located on coding RNAs (hyper: 68.71%; hypo: 60.58%) (C). Thus, DMC sites in both the promoter and gene body may play important roles in transcriptional regulation during erythroid lineage commitment from hES-EBs.
When genes containing DMC sites were clustered based on their gene ontology (GO) terms using DAVID, we identified hES-EB biological processes including the regulation of small GTPase-mediated signal transduction, cell shape regulation, and the positive regulation of gene-specific transcription. Conversely, hES-BLs processes included nervous system development, cell adhesion, embryonic development, heart development, blood vessel development, and hemopoietic or lymphoid organ development (Supplementary Table 1). Based on these results, genes containing DMC sites participate in specific signal transduction and system development, particularly hematopoietic development.
Verification of DNA methylation microarray data
We focused on the genes SOX2, GYPB, and GATA2 to validate our microarray-based DNA methylation analysis results, and promoter methylation status was determined by performing real-time methylation-specific PCR (MSP). In hESCs, the promoter for the pluripotency gene SOX2 was unmethylated, as PCR products were generated only using the primers for unmethylated DNA. In hES-EBs and hES-BLs, both methylated and unmethylated SOX2 DNA primers generated PCR products, indicating SOX2 was partially methylated upon hESC erythropoiesis. However, the hematopoietic gene GATA2 and the erythrocyte-specific gene GYPB were partially demethylated during erythroid differentiation (D). These results corresponded to our DNA methylation microarray data.
Gene expression changes during hESCs erythropoiesis
To probe whether DMC sites regulate gene expression, whole genome expression microarray chips were employed to profile gene expression during each differentiation stage. We identified 577 upregulated genes and 233 downregulated genes when hES-EBs were compared with hESCs (A). According to DAVID analysis for GO term enrichment, the upregulated genes were primarily involved in vasculature development, blood circulation, the circulatory system process, angiogenesis, cell differentiation, neurogenesis, placenta development and epithelia development, these findings are consistent with the heterogeneous nature of hES-EBs [Citation18]. The genes identified in the mesoderm-development ontology included BMP4, CAV1, GATA2, RTN4 and PLAT. Conversely, downregulated genes were involved in the processes of biological adhesion and nervous system development (Supplementary Table 2). Based on these data, hES-EBs are advantageous for mesoderm development but are restricted for the development other systems.
(A) Scatter plots comparing the averaged normalized log2 signal values from expression microarrays between two samples, such as hES-EBs (n = 3) versus hESCs (n = 3), or hES-BLs (n = 3) versus hES-EBs or hES-BLs versus hESCs. A fold-change >2 or <0.5 represents upregulated or downregulated genes, respectively. (B) The real-time PCR validation of down-/upregulated genes during every stage of erythroid cell differentiation. Using the comparative Ct method and GAPDH as an endogenous control, the fold-change in expression was calculated as 2(-ΔΔCt). The negative fold-difference data were converted to linear ‘fold-change in expression’ values using the following formula: linear fold change in expression = -1/2(-ΔΔCt).
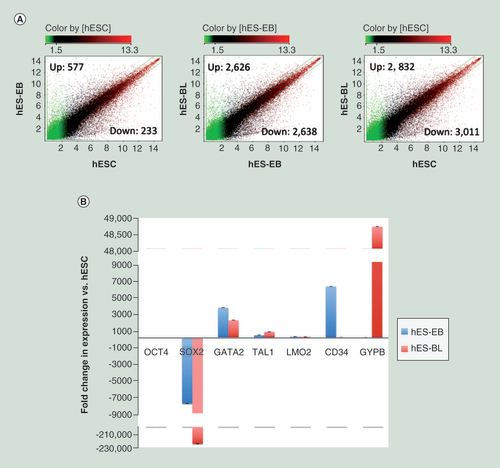
During stage two, we identified 2626 upregulated genes and 2638 downregulated genes (A). When these genes were clustered according to their GO terms using DAVID, the upregulated genes were preferentially involved in the immune response and hematopoiesis, particularly erythrocyte development and maturation. The genes CD44, G6PD, CD34 and CD33 are markers for hematopoietic cells; and the genes IL-7R, IL-10RB and CSF-1R promote hematopoiesis. The genes CD36, GYPB, CD14 and ITGAL are signal transduction activators specific for the hematopoietic lineage. However, these downregulated genes are primarily involved in nonhemopoietic system development, such as nervous system and chordate embryonic development (Supplementary Table 3), may facilitate hES-EB commitment to an erythropoietic fate.
Verification of gene expression microarray data
We performed RT-qPCR to detect the mRNA expression levels of selected genes associated with pluripotency or hematopoiesis. As expected, the expression levels of the pluripotency genes OCT4 and SOX2 were decreased in hES-EBs and hES-BLs relative to hESCs. The expression levels of the hematopoiesis genes TAL1, LMO2 and GATA2 increased, and GYPB expression was remarkably upregulated by 48,672.97-fold. Moreover, the expression levels of CD34, an HSC marker, increased by more than 6000-fold in hES-EB cells and then decreased back to basal levels in hES-BLs (B). The above results correspond to our gene expression microarray data.
Combining DNA methylation & gene expression data enables the effects of epigenetics regulation on erythropoiesis to be inferred
To investigate any correlation between methylation levels and the expression of genes with biological functions, we first sorted anticorrelated genes and then analyzed the relationships between gene expression and the genomic distribution of DMC sites following by the enrichment of GO and KEGG terms.
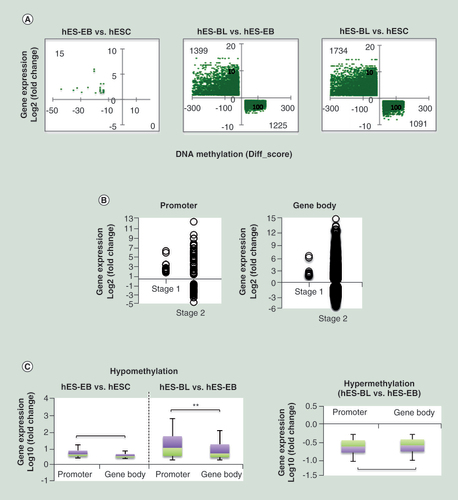
As shown in the cross-plots (A), only 15 genes were negatively expressed against DNA methylation levels during stage one, while during stage two, 1399 genes were hypomethylated/upregulated and 1255 genes were hypermethylated/downregulated. Thus, anticorrelated events primarily occurred upon erythroid differentiation from hES-EBs, and a majority of genes were hypomethylated and upregulated. Among these anticorrelated genes, DMC sites prominently located in promoters and gene bodies (B). Furthermore, hypo-CpGs in both promoters and gene bodies correlated with upregulation, and the relationship between upregulation and hypomethylation in the promoter was statistically significant compared with the relationship in the gene body, particularly during stage two (p = 1.657E-18). Additionally, hyper-CpGs in both the promoters and gene bodies correlated with downregulation (C).
(A) A cross-plot of the combined genes showing a negative correlation between methylation and gene expression levels. The left-upper region indicates hypomethylated and upregulated genes; the right-lower region indicates hypermethylated and downregulated genes. The Y-axis was plotted based on fold-change; the X-axis was plotted based on Diff-score. (B) Correlations between the differentially methylated CpG sites distribution and gene expression during stage one (hES-EB vs hESC) and stage two (hES-BL vs hES-EB) were investigated. (C) Focusing on hypo-CpGs and hyper-CpGs, we analyzed the correlations between gene expression and differentially methylated CpG sites in the promoter or gene body.
**p < 0.01.
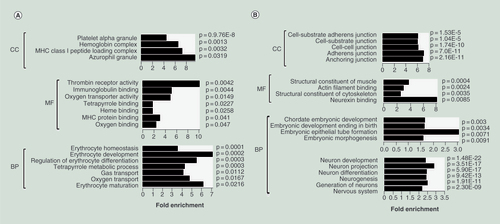
Next, we focused on the erythroid differentiation of hES-EBs and mapped anticorrelated genes sets to GO terms. As shown in A, hypomethylated/upregulated gene enrichment in hES-BLs indicated the gain of erythroid lineage-specific features. Enriched cellular component GO terms included the hemoglobin complex, platelet granules and the MHC class I peptide loading complex, all of which are unique to hematopoietic cells. Enriched molecular function GO terms were erythrocyte-specific. For example, TDO2, HBZ and HBG1 encode proteins with oxygen-binding or oxygen-transport activity, while ALAD, ALAS2 and TBXAS1 encode proteins involved in heme or porphyrin binding. The enriched biological process GO terms were associated with erythropoiesis, including the regulation of erythrocyte differentiation (e.g., TAL1, LMO2 and SPI1), erythrocyte development and maturation (e.g., G6PD, EPB42, JMJD6, HBZ and KLF1), and erythrocyte homeostasis (e.g., BPGM, RB1 and TRIM10) (A & A).
(A) Enrichment of the gene ontology (GO) terms for hypomethylated/upregulated genes in hES-BLs versus hES-EBs. Histograms were drawn using R14.0 with GO_ID as the y-axis and −log10 (p) as the x-axis. The p-values are listed next to bars, while fold-enrichment is shown below the bars. (B) Enrichment of the GO terms for hypermethylated/downregulated genes in hES-BLs versus hES-EBs.
BP: Biological process; CC: Cellular component; MF: Molecular function.
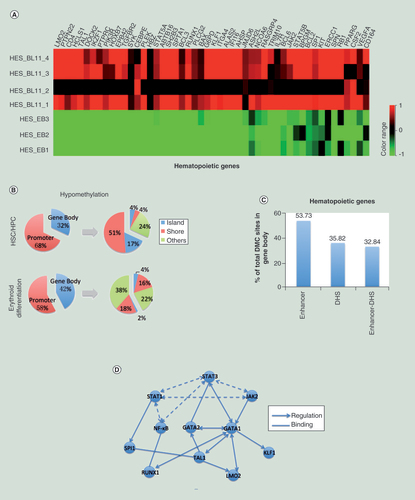
(A) Heatmap showing the hypomethylated/upregulated genes in hES-BLs (n = 4) versus hES-EBs (n = 3). (B) A pie chart showing the distribution of hypomethylated CpG sites in genes involved in hematopoietic stem cell/hematopoietic progenitor cell and erythroid differentiation. The promoters and gene bodies were investigated first, and then CpG islands, shores and others (shelves and open sea) were investigated within the promoters or gene bodies. (C) The enrichment of enhancers and DNase I-hypersensitive sites for differentially methylated CpG sites within the gene body. (D) The nodes in the network represent the anticorrelated genes. Dotted lines connect the genes of JAK-STAT-NF-κB pathway; solid lines link the pathway with target genes. The arrows point to downstream of the regulation point, and the straight lines represent binding to each other.
Conversely, GO terms enriched among hypermethylated/downregulated genes were consistent with the loss of hES-EBs multipotency. The enriched cellular components were associated with various cell junctions or neuron-specific components (axon, synapse, dendrite and growth cone). The enriched molecular functions were associated with muscle structural constituents, actin filament binding and neurexin binding. In terms of biological processes, the enriched GO terms were associated with embryonic development (SP8, SEMA3A, NANOG, POU5F1 and SOX2), cell fate determination (MTL5, DLL3, FOXJ1 and IER3) and nervous system development, which involved 161 genes FGF19, CREB5 and JAG1, etc. (B).
Based on these results, gene expression dynamics were remodeled by DMC sites to favor processes with a gain of hematopoietic function and a loss of pluripotency or nonhematopoietic lineage commitment, accompanied by changes in cell morphology and growth patterns, due to the loss of cell junctions.
Genomic distribution of DMC sites in erythropoiesis genes
Because hemopoietic genes were notably hypomethylated and upregulated, we identified the genomic distribution of the DMC sites within these genes.
In genes (CD34, DOK2 and SPI1) that are as markers for hemopoietic stem cells/progenitor cells, 68% of DMC sites were located in the proximal promoter regions (TSS1500, TSS200, 5′UTR and first exon). Of these sites, 51 and 17% were located in CpG islands and CpG shores, respectively; Conversely, 32% of DMC sites were located in gene bodies. Of these, 4% were specifically located in CpG islands, 4% were located in shores and 24% were located in other sites (shelves and open sea). In erythropoiesis genes (GATA1, RUNX1 and LMO2, etc.), 58% of DMC sites were present in the promoters. Of these, 18% were found in CpG shores, and 38% were found in other sites. Furthermore, 42% of DMC sites were enriched in gene bodies. Of these, 16% were in CpG shores and 22% were in other sites (B & Supplementary Table 4). According to these data, with the exception of CD34, DOK2 and SPI1, DMC sites in erythropoiesis genes were primarily enriched in nonisland regions that overlapped within both the promoter and gene body. This implies important putative effect for both promoter-DMC sites and gene body-DMC sites, particularly the demethylation occurring in nonisland CpG sites, in regulating hematopoietic gene expression.
Further analysis of the above DMC sites within the gene bodies of hemopoietic genes revealed the enrichment of 53.73% of them in enhancers, while 35.82% of them located at DNase I-hypersensitive sites (DHSs). Additionally, the overlaps between enhancers and DHSs accounted for 32.84% of DMC sites. Therefore, gene body demethylation may be involved in the upregulation of hemopoietic genes by promoting transcriptional activity through enhancers or increasing DNA accessibility induced by open-state chromatin containing DHS (C & Supplementary Table 4). Based on the above results, revealed specific patterns of demethylation likely upregulate hemopoietic genes and then promote the process of erythropoiesis in hESCs.
Putative DMC-mediated signaling in erythroid cells
To investigate the signaling pathways promoting erythropoiesis from early mesodermal progenitors (hES-EBs), we mapped anticorrelated gene sets to known pathways. Hypomethylated/upregulated genes were highly significantly enriched in 38 pathways, including the chemokine signaling pathway, hematopoietic cell lineage, the B-cell receptor signaling pathway and the JAK–STAT pathway, which are critical for hematopoietic cells (). Moreover, we identified 34 components of JAK-STAT pathway, including the genes encoding CSF-3R, IL-6R, EPOR, JAK, STATs and others, as well as the gene encoding NF-κB1. The JAK-STAT pathway, combined with NF-κB1 signaling, further regulated certain transcription factors (TFs) (e.g., GATA1, GATA2, SPI1 and RUNX1), and subsequently targeted other TFs (e.g., LMO2, KLF1 and TAL1) (D). Based on our previous analysis, all above TFs were involved in the regulation of erythrocyte differentiation, erythrocyte development and erythrocyte maturation, and all exhibited hypomethylation in the gene body. Thus, DNA hypomethylation occurred in JAK-STAT-NF-κB signaling might affect erythroid lineage choice by specifically upregulating erythropoiesis TFs.
Table 1. Enriched signaling pathways involved in genes hypomethylated/upregulated in hES-BLs versus hES-EBs.
Our results suggest coordination between hypermethylation and hypomethylation to confer a specific DNA methylation signature upon genes encoding certain key pathways in mesoderm lineage-restricted hES-EBs, which may further influence cell fate commitment toward the erythroid lineage.
Discussion
DNA methylation is a reversible biochemical process, and DNA methylation patterns throughout the genome represent a balance between methylation and demethylation. The transition of stem cells into a single lineage is accompanied by extensive changes in DNA methylation patterns. During the early stage of embryonic development, CpG islands maintain unmethylated states in which the majority of genes undergo active demethylation, and obtain DNA methylation patterns specific to certain tissue types and developmental stages [Citation19]. Some studies have detected increases in DNA methylation-mediated epigenetic repression during cardiomyocyte lineage specification or decreases during neurogenesis from ESCs [Citation20,Citation21]. However, in our study, hypomethylation events occurred more often than hypermethylation events upon erythroid differentiation from hESCs, which is in agreement with events during mouse erythropoiesis and the results of study investigating CD34+ cells [Citation4,Citation13].
Therefore, it is necessary for ESCs to trigger dynamic switches regulating DNA methylation upon differentiation into a specific cell type [Citation22,Citation23]. When hESCs were induced with mesoderm medium containing BMP4 and VEGF [Citation3,Citation23], the resulting DNA methylation patterns did not prevent the hESCs from differentiating into mesodermal progenitors, although DNA methylation only induced weak changes in gene expression in our study. During stage one, genes associated with vasculature development and angiogenesis were notably upregulated, similary to embryonic hematopoiesis. Generally, primitive erythrocytes arise from the extraembryonic mesoderm [Citation24,Citation25], and the overlapping development of erythroid and endothelial cells has been confirmed given their common mesodermal precursor (hemangioblast) [Citation26].
Upon erythroid differentiation from hES-EBs, the distribution of hyper-CpGs trended toward regions near CpG islands, whereas hypo-CpGs were primarily enriched in regions far from CpG islands, despite potentially low levels of DNA methylation at CpG-rich sequences in ESCs [Citation27,Citation28]. Based on our study, the hypomethylation of non-CpG islands is tissue-specific during cell differentiation [Citation29], because both groups of genes containing hyper-CpGs and hypo-CpGs, regardless of their location in the promoter or gene body, exhibited similar proportions of coding RNAs and were significantly upregulated. Moreover, these genes were associated with hematopoiesis, erythrocyte development and erythrocyte maturity in agreement with the developmental stages of erythropoiesis.
According to a previous studies, gene body methylation was positively correlated with gene upregulation [Citation16,Citation30], and the methylation of CpG-rich regions in the gene body was confirmed to be related to gene upregulation in human B cells [Citation31]. However, in our study, DMC sites were located in both the promoters and gene bodies of anticorrelated genes, although the probability of a promoter location was more statistically significant than the probability of a location in the gene body. DMC sites have important regulatory roles in gene body methylation changes. To investigate further, we focused on single CpG sites in the gene bodies of erythropoiesis genes characterized by an anticorrelation between DNA methylation and gene expression. Gene body-DMC sites were numerous and largely overlaped within nonisland regions, implying the improtant effect of both promoter-DMC sites and the gene body-DMC sites on regulation of hematopoiesis genes, particularly the demethylation occurring at nonisland CpG sites. Then, we obtained evidence supporting the above inference, in which more than 50% of gene body-DMC sites were enriched in enhancers. An ealier study revealed an interaction between DNA methylation within the gene body and histone modifications, such as H3K9me3 and H3K36me3 [Citation32], and the role of this relationship in transcriptional regulation involved conformational changes in chromatin and DNA accessibility [Citation33,Citation34]. In hES-BLs, more than 35% of the gene body-DMC sites occurred at DHSs, and the majority of them overlapped with enhancers. Based on this observation, increased DNA accessibility and open-state chromatin were closely associated with gene body demethylaiton. However, whether chromatin modifications are present in the gene bodies of erythropoiesis genes remains to be further studied.
Previously, high-resolution methylome analysis revealed functional hypomethylation during adult human erythropoiesis, due to the enrichment of TFs binding motifs [Citation13], but in our study, the signaling involved in this functional regulation remains unknown. When EBs were used as a microenvironment to initiate primitive hematopoiesis, treatment with a cytokine cocktail drove hESCs to produce mature erythrocytes in a more precise and effective way. These cytokines included G-CSF, SCF, IL-3 and IL-6, as well as EPO, which is thought to be important for erythropoiesis, through activation of the receptor-associated JAK-STAT pathway [Citation35,Citation36], and AKT signaling-coupled NF-κB [Citation37]. However, in our study, we predicted a significant role for DNA hypomethylation in JAK-STAT-NF-κB signaling-regulated erythropoiesis, although many more functional studies are still needed to further confirm. Because upregulation of members of the JAK-STAT pathway and the NF-κB1 gene occurred simultaneously DNA demethylation, a regulatory network linked the JAK-STAT-NF-κB pathway to erythropoisis TFs was identified [Citation37–39]. Demethylation signaling upregulates the expression of TFs (GATA1, GATA2, TAL1 and RUNX1) that are critical in embryonic or primitive hematopoiesis [Citation40–42] and further targets the downstream genes SPI1, which is important for fate commitment between the myeloid and lymphoid lineages [Citation43,Citation44], and LMO2 and KLF1, which are both indispensable for erythrocyte maturation [Citation45,Citation46].
In summary, we investigated the regulatory role of genomic DNA methylation via the remodeling of gene expression dynamics during hESC erythropoiesis. In the future, we will study the relationships between DMC sites and the mRNA levels of specific genes, as well as the cooperation between DNA methylation and the other epigenetic mechanisms, in greater detail. More importantly, study in vivo still needs to be performed to comprehensively evaluate our differentiation model for clinical practice. Such information will yield comprehensive insight into the role of epigenetics in the developmental stage-dependent dynamics of gene expression during erythropoiesis.
Materials & methods
hESC culture, EB formation & erythroid differentiation
The 3D microcarrier culture of hESCs (H9 cells) has been previously described [Citation47]. Briefly, to achieve mesoderm differentiation, EBs were formed by first collecting the cell–microcarrier suspension, and then rinsing with phosphate-buffered saline. Media were then changed to EB media (Stemline II, 50 ng/ml VEGF and 50 ng/ml BMP4) for 2 days and the cells were then plated in Ultra-Low 6-well plates (Corning, NY, USA). After 48 h, 50% of the media was refreshed with Stemline II and VEGF (50 ng/ml), BMP4 (50 ng/ml) and bFGF (20 ng/ml, final concentration). At day 3.5–4, EBs were collected and trypsinized for 3–5 min and plated in blast growth medium (BGM). After 6 days, a ½ volume of fresh BGM with an additional 6 Units/ml of EPO was added to the BGM to promote erythroid differentiation [Citation1,Citation3]. The blast cells after expansion on Epo+ BGM for 11 days were identified erythroid cells [Citation1]. Samples of hESCs, hES-EBs (day 3.5–4.0) and hESC-blast cells (hES-BLs, day 11) were collected and stored at -80°C for DNA and RNA isolation. Next, genomic DNA and total RNA were extracted from hESCs, hES-EBs and hESC-BLs according to the manufacturer’s protocol (Ambion mirVana; Applied Biosystems, CA, USA). Experiments were performed either in triplicate or with four independent repeats; the values presented the means of biological replicates.
DNA methylation analysis
DNA was treated with sodium bisulfite (EZ DNA Methylation Gold, Zymo Research, CA, USA), and DNA methylation levels were measured in an Infinium HumanMethylation450K BeadChip (Illumina Inc, CA, USA, hereafter referred to as HM450K). Three cell samples (hESCs, n = 3; hES-EBs, n = 3 and hES-BLs, n = 4) were randomly distributed across the arrays. Arrays analysis, including CpG site annotation and the assessment of differential DNA methylation, was carried out using previously methods [Citation48].
DMC filtering was performed based on a Diff-score = ±13 (equal to p = 0.05) in hES-EBs versus hESCs, a Diff-score = ±20 (equal to p = 0.01) in hES-BLs versus hES-EBs, or a Diff-score = ±30 (equal to p = 0.001) in hES-BLs versus hESCs. The resulting probes were used to obtain DMC images. A DNA methylation portrait was described according to the CpG distribution and the neighborhood context, functional genomic distribution and associated RNA transcription, as previously described [Citation49].
Expression microarray
Expression analysis was performed using an Ilumina Human HT-12 v4 Expression Beadchip (later designated GE; Illumina, CA, USA) as described previously [Citation50]. RNA quantity (Qubit™ RNA BR Assay Kits; Invitrogen, MA, USA) and quality (RNA6000 Nano Kit; Agilent, CA, USA) were assessed to ensure the optimization of each sample prior to further processing. RNA samples (200 ng) were amplified using an Illumina R Total Prep™ RNA Amplification Kit according to the manufacturer’s protocol and were quantified as described above. The gene expression data were processed and normalized; then, samples were compared with each other, with each test group containing ≥3 biological repeat samples. Genes (transcripts) with a p-value below 0.05 and a fold-change >2 or <0.5 relative to the control were considered significant.
Correlation between DNA methylation & gene expression
The correlation between gene expression and DNA methylation was detected using a previously described method [Citation48,Citation50], involving association of the ID for GE and HM450K, the qualitative analysis of opposing trends and the calculation of Pearson’s correlation coefficient.
Data analysis & visualization
Data analysis was carried out in the R environment (R version 3.2.3, R Development Core Team [Citation51]). One-sided Fisher’s exact tests were calculated to assess the significance of enrichment for genes containing differentially methylated CpG sites and differentially expressed mRNAs for functionally annotated regions. All p-values were adjusted for multiple testing by false discovery rate (FDR) unless otherwise stated.
To construct box plots and scatter plots, all beta values were imported into Genespring 12.0 and the box plots and scatter plots were drawn using the R program. x = y lines and fold-changes >2 or <0.5 are shown in the GE_scatter plot; the x = y lines is shown in the methylation scatter plot.
GO term and KEGG pathway enrichment analysis were performed using the database for Function Annotation in DAVID. The GO terms included molecular function, biological process and cell component. Histograms were drawn using R 3.2.3, with the GO_ID or pathway ID as the y-axis and −log10 (p) as the x-axis. The cutoff was set by discretion when p = 0. The pathway maps were downloaded from the official KEGG website [Citation52]. Hierarchical clustering with complete linkage was performed using Genespring 12.0; the distance was tested using the Pearson-centered and average linkage rule.
Extraction & bisulfite conversion of genomic DNA & real-time MSP
Genomic DNA was extracted from hESCs, hES-EBs and hES-BLs following the instruction manual for TRIzol® LS Reagent (Life Technologies). DNA was precipitated from the interphase/organic layer with ethanol and washed to remove impurities. Then, it was resuspended for use in downstream applications. Genomic DNA was bisulfite-converted with the MethylEdge™ Bisulfite Conversion System (Promega, WI, USA) according to the manufacturer’s protocol. After DNA desulfonation and cleanup, the eluted DNA was stored at 4°C or -20°C. Primers for PCR amplification were designed using the Methprimer program [Citation53] and these sequences are listed in Supplementary Table 5. The promoter regions of each gene were amplified with primers for methylated or unmethylated templates using the EpiScope® MSP Kit (TAKARA) according to the manufacturer’s protocol.
Isolation of total RNA & quantitative real-time RT-PCR
Total RNA was isolated from hESCs, hES-EBs and hES-BLs following the instruction manual of TRIzol LS Reagent. The resulting RNA (1 μg) was reverse-transcribed using M-MLV (TAKARA, Shiga, Japan) and random 9-mer primers (TAKARA). PCR reactions were performed using a ABI 7300 Real-Time PCR detection system. Real-time PCR was carried out in triplicates using 25 ng of reverse-transcribed cDNA and 0.4 μM of each primer in a final reaction volume of 30 μl containing 1 × SYBR Premix EX Taq (TAKARA). The PCR cycling conditions were as follows: one cycle at 95°C for 30 s, followed by 40 cycles each consisting of 5 s at 95°C and 1 min at 60°C, followed by a final cycle of 15 s at 95°C, 1 min at 60°C and 15 s at 95°C. Using the comparative cycle threshold (Ct) method and employing GAPDH as an endogenous control, the fold-change in expression was calculated as 2(−ΔΔCt). The negative fold-difference data were converted to linear ‘fold-change in expression’ values using the following formula: linear fold change in expression = -1/2(−ΔΔCt). The sequences of gene specific primers are listed in Supplementary Table 5.
Statistical analysis
All data are expressed as the mean ± standard error. Statistical comparisons were performed using paired Student’s t-tests. Values were considered statistically significant at p < 0.05 or p < 0.01.
DNA methylation profiling at CpG sites upon human embryonic stem cell erythropoiesis
The methylation patterns of hES-BLs differed substantially from those of hES-EBs or human embryonic stem cells (hESCs). Moreover, the number of hypomethylated events significantly exceeded the number of hypermethylated events during erythropoiesis.
Differentially methylated CpG (DMC) sites in the gene body might also participate in hES-EBs generation through transcriptional regulation, with the exception of sites in promoters.
DMC sites in both the promoter and gene body may play important roles in transcriptional regulation during erythroid lineage commitment from hES-EBs.
Genes containing DMC sites participate in specific signal transduction and system development, particularly hematopoietic development.
Gene expression changes during hESCs erythropoiesis
We identified 577 upregulated genes and 233 downregulated genes when hES-EBs were compared with hESCs. The upregulated genes were primarily involved in vasculature development, blood circulation, the circulatory system process, angiogenesis, cell differentiation, neurogenesis, placenta development and epithelia development. Conversely, downregulated genes were involved in the processes of biological adhesion and nervous system development.
During stage two, we identified 2626 upregulated genes and 2638 downregulated genes. The upregulated genes were preferentially involved in the immune response and hematopoiesis, particularly erythrocyte development and maturation. The downregulated genes are primarily involved in nonhemopoietic system development, such as nervous system and chordate embryonic development, may facilitate hES-EB commitment to an erythropoietic fate.
Combining DNA methylation & gene expression data enables the effects of epigenetics regulation on erythropoiesis to be inferred
Anticorrelated events primarily occurred upon erythroid differentiation from hES-EBs, and a majority of genes were hypomethylated and upregulated. Among these anticorrelated genes, DMC sites prominently located in promoters and gene bodies. Furthermore, hypo-CpGs in both promoters and gene bodies correlated with upregulation, and the relationship between upregulation and hypomethylation in the promoter was statistically significant compared with the relationship in the gene body, particularly during stage two. Additionally, hyper-CpGs in both the promoters and gene bodies correlated with downregulation.
Among hypomethylated/upregulated genes, the enriched cellular component gene ontology (GO) terms were unique to hematopoietic cells, and enriched molecular function GO terms were erythrocyte-specific. Moreover, the enriched biological process GO terms were associated with erythropoiesis, including the regulation of erythrocyte differentiation, erythrocyte development and maturation, and erythrocyte homeostasis. Conversely, GO terms enriched among hypermethylated/downregulated genes were consistent with the loss of hES-EBs multipotency.
Genomic distribution of DMC sites in erythropoiesis genes
With the exception of CD34, DOK2 and SPI1, DMC sites in erythropoiesis genes were primarily enriched in nonisland regions that overlapped within both the promoter and gene body. This implies important putative effect for both promoter-DMC sites and gene body-DMC sites, particularly the demethylation occurring in nonisland CpG sites, in regulating hematopoietic gene expression.
Further analysis of the above DMC sites within the gene bodies of hemopoietic genes revealed the enrichment of 53.73% of them in enhancers, while 35.82% of them located at DNase I-hypersensitive sites (DHSs). Additionally, the overlaps between enhancers and DHSs accounted for 32.84% of DMC sites. Therefore, gene body demethylation may be involved in the upregulation of hemopoietic genes by promoting transcriptional activity through enhancers or increasing DNA accessibility induced by open-state chromatin containing DHS.
Putative DMC-mediated signaling in erythroid cells
Among hypomethylated and upregulated genes, 34 components of JAK-STAT pathway and the gene encoding NF-κB1 were identified. The JAK-STAT pathway, combined with NF-κB1 signaling, further regulated certain transcription factors (TFs), and subsequently targeted other TFs. Based on our previous analysis, all above TFs were involved in the regulation of erythrocyte differentiation, erythrocyte development and erythrocyte maturation, and all exhibited hypomethylation in the gene body. Thus, DNA hypomethylation occurred in JAK-STAT-NF-κB signaling might affect erythroid lineage choice by specifically upregulating erythropoiesis TFs.
Our results suggest coordination between hypermethylation and hypomethylation to confer a specific DNA methylation signature upon genes encoding certain key TFs in mesoderm lineage-restricted hES-EBs, which may further influence cell fate commitment toward the erythroid lineage.
Ethical conduct of research
The authors state that they have obtained appropriate institutional review board approval or have followed the principles outlined in the Declaration of Helsinki for all human or animal experimental investigations. In addition, for investigations involving human subjects, informed consent has been obtained from the participants involved.
Supplemental Document
Download MS Word (71.1 KB)Supplementary data
To view the supplementary data that accompany this paper please visit the journal website at: https://www.tandfonline.com/doi/full/10.2217/epi-2017-0039
Financial & competing interests disclosure
Q Feng and S-J Lu are employees of Vcanbio Center for Translational Biotechnology, a company focused on cell therapy and precision medicine. The other authors have declared that no competing interests exist. The authors have no other relevant affiliations or financial involvement with any organization or entity with a financial interest in or financial conflict with the subject matter or materials discussed in the manuscript apart from those disclosed.
No writing assistance was utilized in the production of this manuscript.
References
- Lu SJ , FengQ , ParkJSet al. Biologic properties and enucleation of red blood cells from human embryonic stem cells . Blood112 ( 12 ), 4475 – 4484 ( 2008 ).
- Pryzhkova MV , PetersA , ZambidisET . Erythropoietic differentiation of a human embryonic stem cell line harbouring the sickle cell anaemia mutation . Reprod. Biomed. Online21 ( 2 ), 196 – 205 ( 2010 ).
- Lu SJ , FengQ , CaballeroSet al. Generation of functional hemangioblasts from human embryonic stem cells . Nat. Methods4 ( 6 ), 501 – 509 ( 2007 ).
- Bock C , BeermanI , LienWHet al. DNA methylation dynamics during in vivo differentiation of blood and skin stem cells . Mol. Cell47 ( 4 ), 633 – 647 ( 2012 ).
- Hodges E , MolaroA , Dos SantosCOet al. Directional DNA methylation changes and complex intermediate states accompany lineage specificity in the adult hematopoietic compartment . Mol. Cell44 ( 1 ), 17 – 28 ( 2011 ).
- Ji H , EhrlichLI , SeitaJet al. Comprehensive methylome map of lineage commitment from haematopoietic progenitors . Nature467 ( 7313 ), 338 – 342 ( 2010 ).
- Shearstone JR , PopR , BockC , BoyleP , MeissnerA , SocolovskyM . Global DNA demethylation during mouse erythropoiesis in vivo . Science334 ( 6057 ), 799 – 802 ( 2011 ).
- De Goede OM , LavoiePM , RobinsonWP . Characterizing the hypomethylated DNA methylation profile of nucleated red blood cells from cord blood . Epigenomics8 ( 11 ), 1481 – 1494 ( 2016 ).
- Farthing CR , FiczG , NgRKet al. Global mapping of DNA methylation in mouse promoters reveals epigenetic reprogramming of pluripotency genes . PLoS Genet.4 ( 6 ), e1000116 ( 2008 ).
- Illingworth R , KerrA , DesousaDet al. A novel CpG island set identifies tissue-specific methylation at developmental gene loci . PLoS Biol.6 ( 1 ), e22 ( 2008 ).
- Broske AM , VockentanzL , KharaziSet al. DNA methylation protects hematopoietic stem cell multipotency from myeloerythroid restriction . Nat. Genet.41 ( 11 ), 1207 – 1215 ( 2009 ).
- Tadokoro Y , EmaH , OkanoM , LiE , NakauchiH . De novo DNA methyltransferase is essential for self-renewal, but not for differentiation, in hematopoietic stem cells . J. Exp. Med.204 ( 4 ), 715 – 722 ( 2007 ).
- Yu Y , MoY , EbenezerDet al. High resolution methylome analysis reveals widespread functional hypomethylation during adult human erythropoiesis . J. Biol. Chem.288 ( 13 ), 8805 – 8814 ( 2013 ).
- Futscher BW , OshiroMM , WozniakRJet al. Role for DNA methylation in the control of cell type specific maspin expression . Nat. Genet.31 ( 2 ), 175 – 179 ( 2002 ).
- Li XY , ShenJZ , ShenSFet al. [Methylation status of IEX-1 gene promotor CpG island in malignant hematopoietic cell lines] . Zhongguo Shi Yan Xue Ye Xue Za Zhi19 ( 2 ), 473 – 476 ( 2011 ).
- Moen EL , StarkAL , ZhangW , DolanME , GodleyLA . The role of gene body cytosine modifications in MGMT expression and sensitivity to temozolomide . Mol. Cancer Ther.13 ( 5 ), 1334 – 1344 ( 2014 ).
- Hong SJ , KangMI , OhJHet al. DNA methylation and expression patterns of key tissue-specific genes in adult stem cells and stomach tissues . J. Korean Med. Sci.24 ( 5 ), 918 – 929 ( 2009 ).
- Lu SJ , HippJA , FengQ , HippJD , LanzaR , AtalaA . GeneChip analysis of human embryonic stem cell differentiation into hemangioblasts: an in silico dissection of mixed phenotypes . Genome Biol.8 ( 11 ), R240 ( 2007 ).
- Feng S , JacobsenSE , ReikW . Epigenetic reprogramming in plant and animal development . Science330 ( 6004 ), 622 – 627 ( 2010 ).
- Gu Y , LiuGH , PlongthongkumNet al. Global DNA methylation and transcriptional analyses of human ESC-derived cardiomyocytes . Protein & Cell5 ( 1 ), 59 – 68 ( 2014 ).
- Wei D , LoekenMR . Increased DNA methyltransferase 3b (Dnmt3b)-mediated CpG island methylation stimulated by oxidative stress inhibits expression of a gene required for neural tube and neural crest development in diabetic pregnancy . Diabetes63 ( 10 ), 3512 – 3522 ( 2014 ).
- Petell CJ , AlabdiL , HeM , San MiguelP , RoseR , GowherH . An epigenetic switch regulates de novo DNA methylation at a subset of pluripotency gene enhancers during embryonic stem cell differentiation . Nucleic Acids Res.44 ( 16 ), 7605 – 7617 ( 2016 ).
- Sohni A , BartoccettiM , KhoueiryRet al. Dynamic switching of active promoter and enhancer domains regulates Tet1 and Tet2 expression during cell state transitions between pluripotency and differentiation . Mol. Cell. Biol.35 ( 6 ), 1026 – 1042 ( 2015 ).
- Chasis JA , MohandasN . Erythroblastic islands: niches for erythropoiesis . Blood112 ( 3 ), 470 – 478 ( 2008 ).
- Dzierzak E , PhilipsenS . Erythropoiesis: development and differentiation . Cold Spring Harb. Perspect. Med.3 ( 4 ), a011601 ( 2013 ).
- Boisset JC , Van CappellenW , Andrieu-SolerC , GaljartN , DzierzakE , RobinC . In vivo imaging of haematopoietic cells emerging from the mouse aortic endothelium . Nature464 ( 7285 ), 116 – 120 ( 2010 ).
- Fouse SD , ShenY , PellegriniMet al. Promoter CpG methylation contributes to ES cell gene regulation in parallel with Oct4/Nanog, PcG complex, and histone H3 K4/K27 trimethylation . Cell Stem Cell2 ( 2 ), 160 – 169 ( 2008 ).
- Meissner A , MikkelsenTS , GuHet al. Genome-scale DNA methylation maps of pluripotent and differentiated cells . Nature454 ( 7205 ), 766 – 770 ( 2008 ).
- Nagae G , IsagawaT , ShirakiNet al. Tissue-specific demethylation in CpG-poor promoters during cellular differentiation . Hum. Mol. Genet.20 ( 14 ), 2710 – 2721 ( 2011 ).
- Jones PA . The DNA methylation paradox . Trends Genet.15 ( 1 ), 34 – 37 ( 1999 ).
- Rauch TA , WuX , ZhongX , RiggsAD , PfeiferGP . A human B cell methylome at 100-base pair resolution . Proc. Natl Acad. Sci. USA106 ( 3 ), 671 – 678 ( 2009 ).
- Hahn MA , WuXW , LiAX , HahnT , PfeiferGP . Relationship between gene body DNA methylation and intragenic H3K9me3 and H3K36me3 chromatin marks . PLoS ONE6 ( 4 ), e18844 ( 2011 ).
- Miller JR , CartwrightEM , BrownleeGG , FedoroffNV , BrownDD . The nucleotide sequence of oocyte 5S DNA in Xenopus laevis. II. The GC-rich region . Cell13 ( 4 ), 717 – 725 ( 1978 ).
- Mcmanus S , EbertA , SalvagiottoGet al. The transcription factor Pax5 regulates its target genes by recruiting chromatin-modifying proteins in committed B cells . EMBO J.30 ( 12 ), 2388 – 2404 ( 2011 ).
- Richmond TD , ChohanM , BarberDL . Turning cells red: signal transduction mediated by erythropoietin . Trends Cell Biol.15 ( 3 ), 146 – 155 ( 2005 ).
- Kirito K , NakajimaK , WatanabeTet al. Identification of the human erythropoietin receptor region required for Stat1 and Stat3 activation . Blood99 ( 1 ), 102 – 110 ( 2002 ).
- Cokic VP , BhattacharyaB , Beleslin-CokicBB , NoguchiCT , PuriRK , SchechterAN . JAK-STAT and AKT pathway-coupled genes in erythroid progenitor cells through ontogeny . J. Transl. Med.10 , 116 ( 2012 ).
- Bausek N , ZeidlerMP . Galpha73B is a downstream effector of JAK/STAT signalling and a regulator of Rho1 in Drosophila haematopoiesis . J. Cell Sci.127 ( Pt 1 ), 101 – 110 ( 2014 ).
- Furqan M , MukhiN , LeeB , LiuD . Dysregulation of JAK-STAT pathway in hematological malignancies and JAK inhibitors for clinical application . Biomarker Res.1 ( 1 ), 5 ( 2013 ).
- Porcher C , SwatW , RockwellK , FujiwaraY , AltFW , OrkinSh . The T cell leukemia oncoprotein SCL/tal-1 is essential for development of all hematopoietic lineages . Cell86 , 47 – 57 ( 1996 ).
- Grass JA , BoyerME , PalS , WuJ , WeissMJ , BresnickEH . GATA-1-dependent transcriptional repression of GATA-2 via disruption of positive autoregulation and domain-wide chromatin remodeling . Proc. Natl Acad. Sci. USA100 ( 15 ), 8811 – 8816 ( 2003 ).
- Okuda T , Van DeursenJ , HiebertSW , GrosveldG , DowningJR . AML1, the target of multiple chromosomal translocations in human leukemia, is essential for normal fetal liver hematopoiesis . Cell84 ( 2 ), 321 – 330 ( 1996 ).
- Carotta S , WuL , NuttSL . Surprising new roles for PU.1 in the adaptive immune response . Immunol. Rev.238 ( 1 ), 63 – 75 ( 2010 ).
- Huang G , ZhangP , HiraiHet al. PU.1 is a major downstream target of AML1 (RUNX1) in adult mouse hematopoiesis . Nat. Genet.40 ( 1 ), 51 – 60 ( 2008 ).
- Vinjamur DS , WadeKJ , MohamadSF , HaarJL , SawyerST , LloydJA . Kruppel-like transcription factors KLF1 and KLF2 have unique and coordinate roles in regulating embryonic erythroid precursor maturation . Haematologica99 ( 10 ), 1565 – 1573 ( 2014 ).
- Inoue A , FujiwaraT , OkitsuYet al. Elucidation of the role of LMO2 in human erythroid cells . Exp. Hematol.41 ( 12 ), 1062 – 1076e1061 ( 2013 ).
- Lu SJ , KelleyT , FengQet al. 3D microcarrier system for efficient differentiation of human pluripotent stem cells into hematopoietic cells without feeders and serum [corrected] . Regen. Med.8 ( 4 ), 413 – 424 ( 2013 ).
- Nordlund J , BacklinCL , WahlbergPet al. Genome-wide signatures of differential DNA methylation in pediatric acute lymphoblastic leukemia . Genome Biol.14 ( 9 ), r105 ( 2013 ).
- Sandoval J , HeynH , MoranSet al. Validation of a DNA methylation microarray for 450,000 CpG sites in the human genome . Epigenetics6 ( 6 ), 692 – 702 ( 2011 ).
- Han H , YangX , PandiyanK , LiangG . Synergistic re-activation of epigenetically silenced genes by combinatorial inhibition of DNMTs and LSD1 in cancer cells . PLoS ONE8 ( 9 ), e75136 ( 2013 ).
- The R Project for Statistical Computing . www.r-project.org
- KEGG PATHWAY Database . www.genome.jp/kegg/pathway.html
- The Li Lab. MethPrimer . www.urogene.org/cgi-bin/methprimer/methprimer.cgi