
Abstract
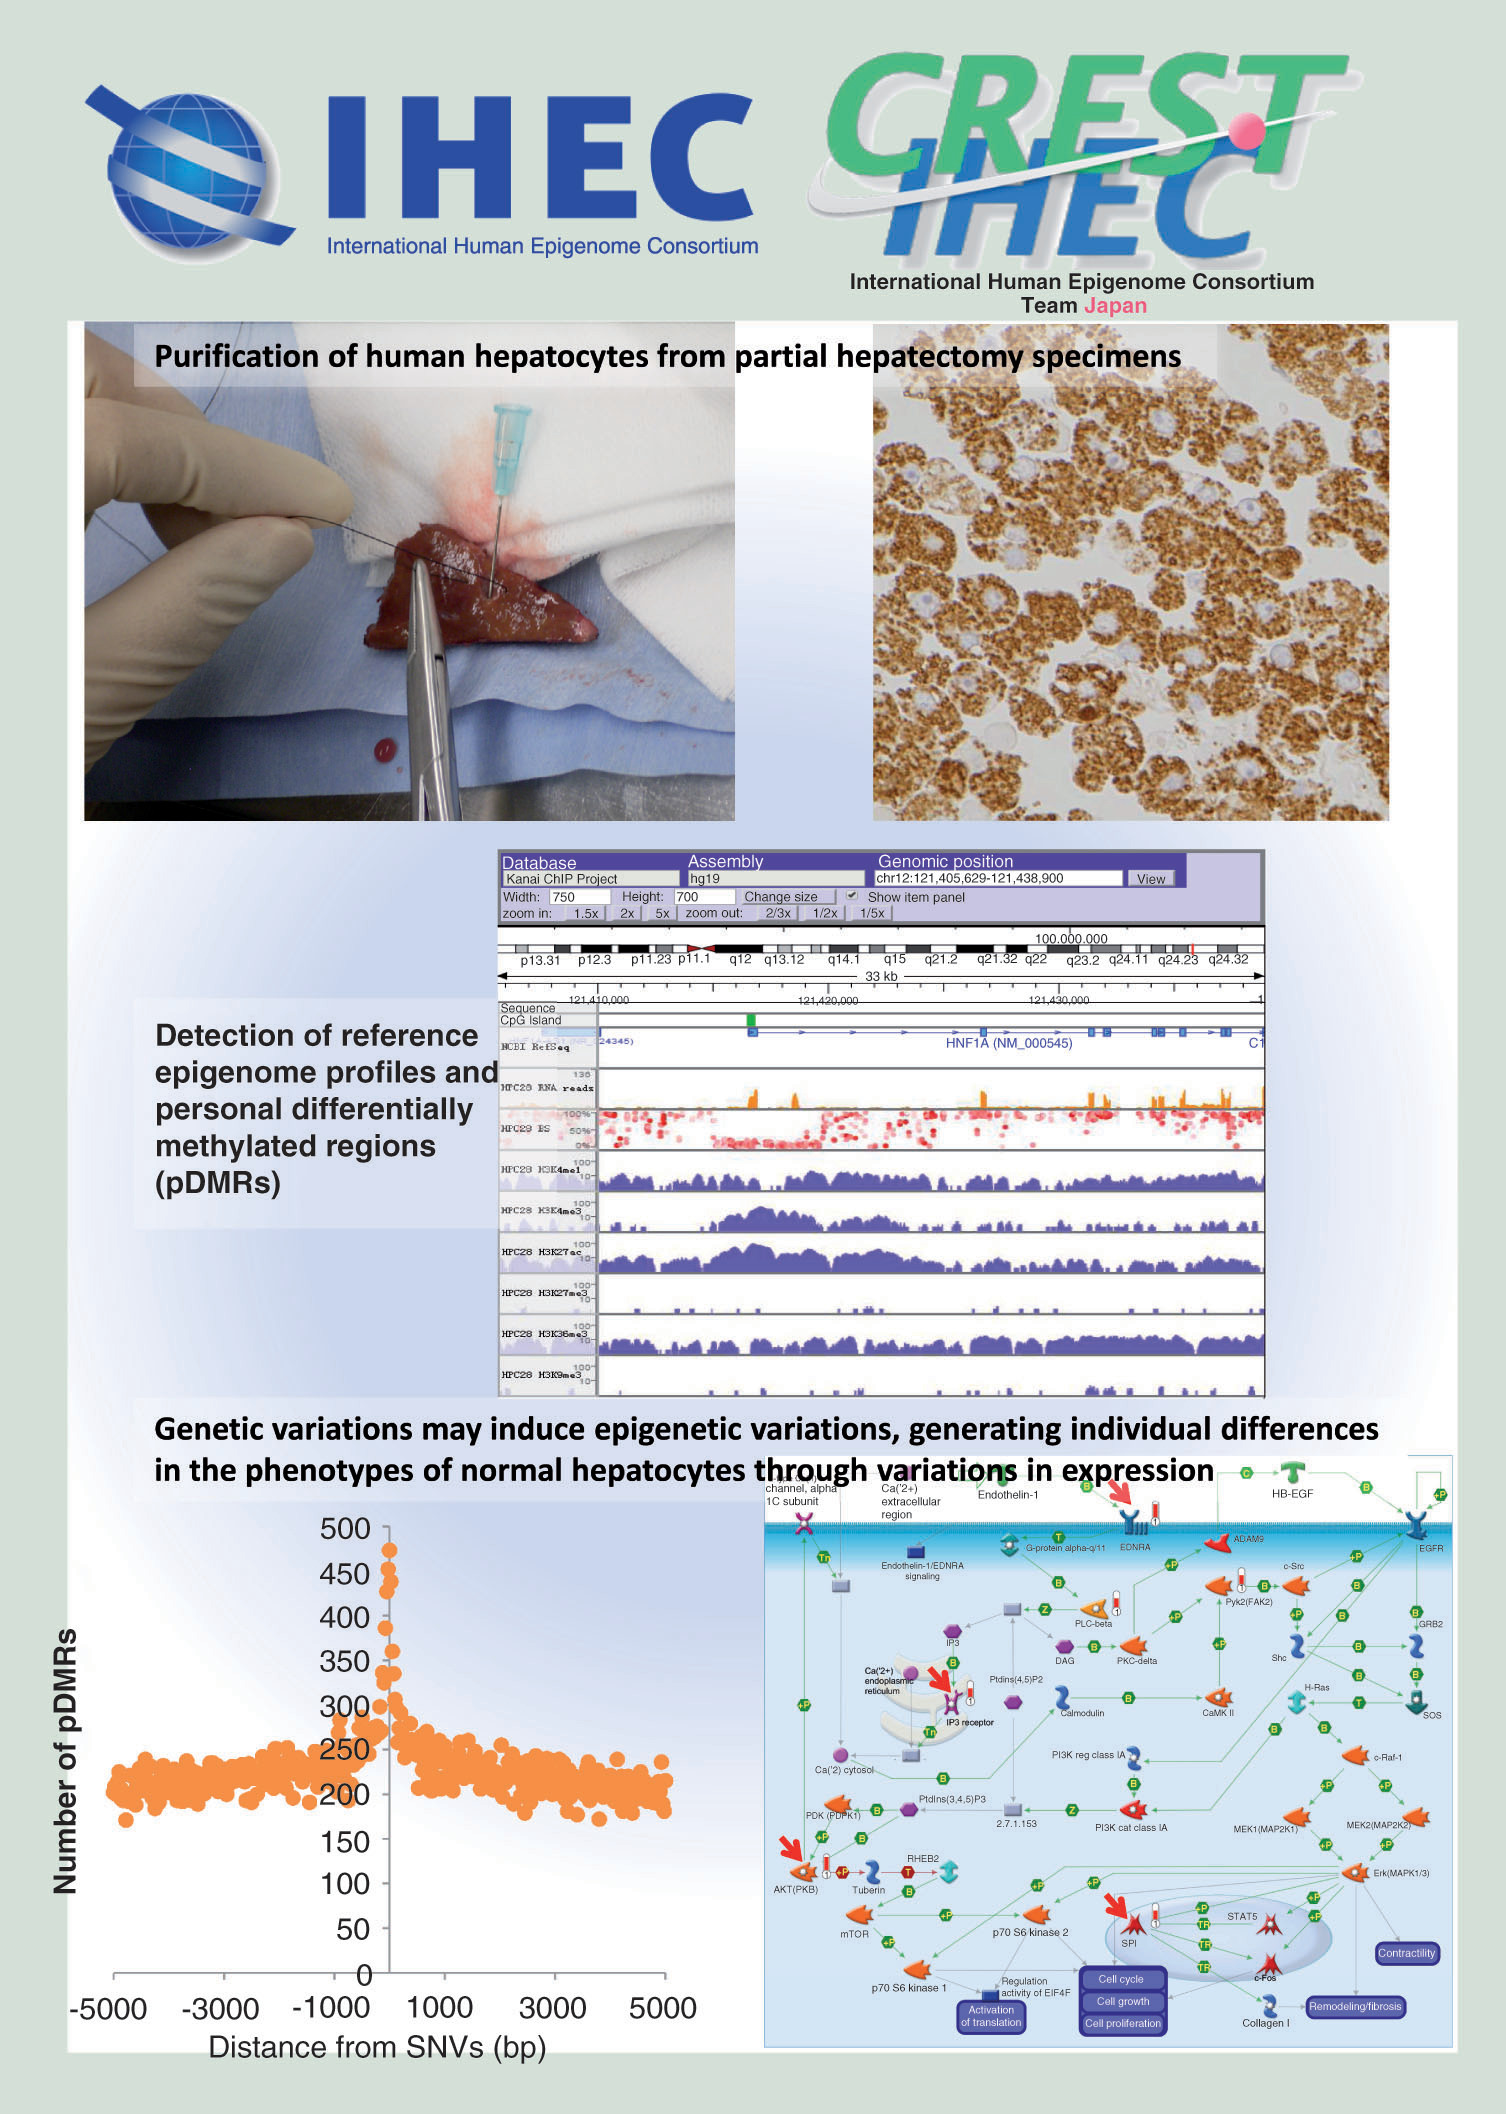
Aim: The aim of this study was to reveal the epigenome landscape of human normal hepatocytes. Materials & methods: Cells purified from partial hepatectomy specimens of Japanese patients were subjected to whole-genome bisulfite sequencing using postbisulfite adaptor tagging, chromatin immunoprecipitation sequencing, RNA sequencing and whole-genome sequencing. Results: CHG and CHH methylations were inversely associated with gene expression. Histone modification profiles of personal differentially methylated regions (pDMRs) differed considerably among samples. pDMRs were observed around the transcription start sites of genes whose expression is reportedly regulated by CpG methylation. pDMRs were frequently observed in the vicinity of single-nucleotide variations and insertions/deletions. Conclusion: Genetic variations may induce epigenetic variations, generating individual differences in the phenotypes of normal hepatocytes through variations in expression.
Epigenomic processes are defined as heritable alterations of biological information unaccompanied by changes in the DNA sequence. Such modulation of epigenome profiles contributes to embryonic development and differentiation, and underlies responses to environmental signals such as nutrients and inflammation. Histone modification and DNA methylation are both key elements of epigenetic mechanisms, cooperatively determining chromatin configuration and regulating the levels of gene expression [Citation1]. Epigenome alterations have recently attracted a great deal of attention as the molecular basis of cancers [Citation2] and metabolic disorders [Citation3], such as hepatocarcinogenesis associated with hepatitis virus infection and/or nonalcoholic steatohepatitis (NASH) [Citation4]. On the basis of disease-specific epigenome profiles, attempts are now being made to explore possible biomarkers for carcinogenetic risk estimation and prognostication [Citation5,Citation6], and druggable targets [Citation7].
In order to accurately identify such disease-specific epigenome profiles, strict comparison with standard epigenome profiles of normal cells is indispensable. However, as epigenomic mechanisms show heterogeneity among tissues and cell lineages, it is not easy to obtain a comprehensive picture of standard epigenome profiles for normal cells. The International Human Epigenome Consortium (IHEC) [Citation8] has set an ambitious goal to decipher at least 1000 epigenomes for various cell lineages and states [Citation9]. We are one of the Japan’s IHEC teams [Citation10] and are now focusing on standard epigenome profiling of human normal hepatocytes.
The aim of this study was to reveal the epigenetic landscape based on whole-genome bisulfite sequencing (WGBS), chromatin immunoprecipitation (ChIP) sequencing (seq), RNA-seq and whole-genome sequencing (WGS) data obtained simultaneously from the same batch of purified hepatocytes, and to contribute the results to the IHEC data portal. The obtained data were used to examine correlations between non-CpG methylation and gene expression, the histone modification profiles of personal differentially methylated regions (pDMRs), correlations between personal variation of DNA methylation status and personal variation of gene expression, and genome–epigenome interaction (i.e., correlations between genomic variation and variation of DNA methylation). Notably, this study has revealed that pDMRs are frequent in the vicinity of single-nucleotide variations and insertions/deletions, suggesting that genetic variations may induce epigenetic variations, generating individual differences in the phenotypes of normal hepatocytes through variations in expression.
Materials & methods
Purification of human normal hepatocytes
Six samples of human normal hepatocytes (HPC6, 20, 25, 27, 28 and 35) were purified from partial hepatectomy specimens immediately after surgery as described in Supplementary Methods (page 1) from six Japanese patients without hepatocellular carcinoma who were negative for both hepatitis B virus surface antigen and anti–hepatitis C virus antibody. Clinicopathological information for these patients is summarized in Supplementary Table 1 (page 8).
To confirm the purity of the normal hepatocytes, a proportion of the isolated cells were prepared into formalin-fixed and paraffin-embedded blocks, and subjected to immunocytochemical analysis using Hep Par 1 antibody [Citation11] (clone OCH1E5.2.10, 1:80 dilution, DAKO, CA, USA). All six samples were confirmed to be more than 95% pure (Supplementary Figure 1 [page 303]). The liver consists of various cell lineages, such as hepatocytes, liver sinusoidal endothelial cells, Kupffer cells and satellite cells. Maslak et al. showed that liver sinusoidal endothelial cells comprise about 20% of the total number of liver cells [Citation12]. In addition, in rats, Marcos et al. showed that the average number of Kupffer cells per animal ranged from 1.54 ± 0.15 × 10⁸ (females) to 2.09 ± 0.14 × 10⁸ (males) and that of satellite cells was 2.86 ± 0.58 × 10⁸, whereas the average number of hepatocytes per animal was 2.0 ± 0.3 × 10⁹ [Citation13]. Therefore, a purity of more than 95% can be considered to represent a significant concentration of hepatocytes. Genomic DNA and total RNA were isolated from purified normal hepatocytes using phenol-chloroform followed by dialysis and TRIzol reagent (Thermo Fisher Scientific, MA, USA), respectively.
Polyploidization of hepatocytes in the course of the human life cycle has been reported [Citation14], and the possibility that epigenetic regulation of hepatocyte-specific genes may be affected by multiple nuclei and polyploid nuclei should not be totally neglected. Therefore, we microscopically evaluated the content of hepatocytes showing multiple (two or more) nuclei in hematoxylin-eosin-stained slides. In addition, the content of hepatocytes with polyploid (triploid or more) nuclei was evaluated by fluorescence in situ hybridization using a probe designed for the centromeric region of chromosome 12 (Jokoh Co., Ltd, Tokyo, Japan), as described previously [Citation15]. About 1.85–12.40% and 11.51–23.03% of hepatocytes harbored multiple nuclei and polyploid nuclei, respectively. These data are summarized in Supplementary Figure 2 (page 304).
WGBS using postbisulfite adaptor tagging
Genomic DNA was, if necessary, further treated with RNase ONE (Promega, WI, USA) followed by Proteinase K (Qiagen, Hilden, Germany) in Ex Taq Buffer (Takara, Ohtsu, Japan). The enzyme-treated DNA was then purified using AMPure XP SPRI beads (Beckman, CA, USA). Genomic DNA (100 ng) spiked with unmethylated λ phage DNA (1 ng, Promega) was treated with EZ DNA Methylation-Gold kit (Zymo Research, CA, USA). A WGBS library was constructed according to the postbisulfite adaptor tagging (PBAT) protocol revision 12 [Citation16,Citation17]. The concentration of the library was quantified using real-time PCR using an ABI7000 SDS system (Life Technologies) and KAPA Library Quantification Kits (Kapa Biosystems, MA, USA). Single-end 100-nt reads were generated by HiSeq2000 (Illumina, CA, USA) in accordance with the manufacturer’s instructions except for the denaturation step prior to cluster generation [Citation16] (also see Supplementary Discussion [page 4]). The obtained reads were simultaneously mapped to the human reference genome (University of California, Santa Cruz [UCSC] Genome Browser hg19 assembly) and the bacteriophage λ genome (GenBank accession number J02459) using BMap pipeline [Citation18] and visualized as described previously [Citation16]. Quality control (QC) metrics of WGBS using PBAT in each of six samples are summarized in Supplementary Table 2 (page 9): an average read depth of more than 30 was obtained in all samples, thus satisfying the recommendation of the IHEC [Citation19]. All the results of WGBS have been deposited in the National Bioscience Database Center (NBDC) [Citation20] (accession number JGA00000000026), and also can be browsed in the IHEC database [Citation21].
Chromatin immunoprecipitation–sequencing
About 1 × 10⁷ purified normal hepatocytes were crosslinked for 5 min using 1% formaldehyde at room temperature and then neutralized using 0.2 M glycine solution as described previously [Citation22]. Normal hepatocytes were resuspended in SDS lysis buffer (10 mM Tris-HCl [pH 8.0], 150 mM NaCl, 1% SDS, 1 mM EDTA). Cell suspensions, including the DNA–protein complexes, were subjected to fragmentation (ten cycles for 30 s, output level 40%) using a SLPe 40 sonifier (Branson, CT, USA) on ice. The lysate was centrifuged at 13,000 r.p.m. for 10 min, and the supernatant was recovered. The supernatant containing 30 μg of sheared DNA was incubated with 4 μg of mouse monoclonal antibody against H3K4me3, H3K9me3, H3K27me3, H3K27AC, H3K4me1 and H3K36me3 [Citation23 and references therein] overnight at 4°C with rotation, and then the immunocomplexes were collected with 35 μl of the magnetic beads (Dynabeads M-280 Sheep anti-mouse IgG, Life Technologies). These antibodies have been employed by many research teams participating in the IHEC, and equivalency of the ChIP protocols has been confirmed by concordance of the results and QC metrics based on analysis of the same samples by participating teams under the supervision of the Assay Standard Working Group of the IHEC. After precipitation, quantitative real-time PCR using primer sets encompassing the enhancer region of the GAPDH, FOXA1 and ALB genes was performed for validation of H3K27AC and/or H3K4me1 precipitation. Similarly, that using primer sets encompassing the promoter region of the GAPDH, EEF1A1, CNR1 and KCNA1 genes was performed for validation of H3K4me3 or H3K27me3 precipitation, and that using primer sets encompassing the body of the GAPDH gene and Satellite II was performed for validation of H3K36me3 and H3K9me3, respectively. It was confirmed that an appropriate amount of DNA was co-precipitated almost equally from all samples (data not shown). ChIP-Seq libraries were generated from DNA extracted from the immunoprecipitates. Single-end 100-nt reads were generated using the HiSeq 2000 or HiSeq 2500 platforms (Illumina) in accordance with the manufacturer’s protocol.
ChIP-seq data for each histone modification were mapped to the human reference genome (UCSC Genome Browser hg19 assembly) using ELAND (Illumina). Using model-based analysis of the ChIP-Seq (MACS) 2 pipeline [Citation24,Citation25] with default parameters, the peaks of each modification were identified. The QC metrics of ChIP-seq for each batch of six samples are summarized in Supplementary Table 3 (page 10). Using ChromHMM [Citation26,Citation27] based on a multivariate hidden Markov model, chromatin states were characterized from ChIP-Seq data. All the results of ChIP-seq have been deposited in the NBDC [Citation20] (accession number JGAS00000000027), and also can be browsed in the IHEC database [Citation21].
Whole transcriptome sequencing (RNA-seq)
cDNA libraries (fragments of 150–200 bp) were prepared from 2 μg of total RNA using the TruSeq RNA Sample Preparation Kit (Illumina). The RNA-seq libraries were subjected to paired-end 100-bp sequencing using the HiSeq2000 (Illumina) in accordance with the manufacturer’s instructions. Sequencing data were mapped to known RNA sequences in the NCBI Reference Sequence database [Citation28], Ensembl [Citation29] and Long noncoding RNA (LincRNA) databases [Citation30] using the Bowtie program [Citation31] as described previously [Citation32]. The QC metrics of RNA-seq for each batch of six samples are summarized in Supplementary Table 4 (page 11). After selecting the best hits with the proper spacing and orientation, the number of reads per kilobase pair per million reads (RPKM) was calculated. All the results of RNA-seq have been deposited in the NBDC [Citation20] (accession number JGAS00000000028), and also can be browsed in the IHEC database [Citation21].
Whole-genome sequencing
DNA was fragmented using an ultrasonic solubilizer (Covaris, MA, USA) using a combination of quick bursts and sonication. DNA fragments of 200–300 bp were gel purified to exclude any inappropriate DNA fusions during library construction. The short fragmented DNA libraries were generated using a pair-end DNA sample prep kit (Illumina) and subjected to paired-end sequencing on the HiSeq2000 (Illumina), in accordance with the manufacturer’s instructions. Paired-end reads were aligned to the human reference genome (UCSC Genome Browser hg19 assembly) using Burrows–Wheeler Aligner (version 0.7.12) [Citation33]. Because duplicated reads were generated during the PCR amplification process, pair-end reads that aligned to the same genomic positions were removed using SAMtools [Citation34] (version 1.2) [Citation35] and a program developed in-house. The QC metrics of WGS for each batch of six samples are summarized in Supplementary Table 5 (page 12). Single nucleotide variations (SNVs) and insertions and deletions (indels) were called using SAMtools with stringent confidence filtering conditions we had developed [Citation36]. Copy number information was detected using CNVnator algorithm [Citation37,Citation38].
Pathway & statistical analysis
MetaCore software [Citation39] was used for pathway analysis and statistical analysis was performed using programming language R, both as described in Supplementary Methods (page 1).
Transfection with siRNA
The human liver cancer cell lines KIM-1 and KYN-2 were transfected with either negative control siRNA, AKT3 siRNA or EDNRA siRNA. MTS cell viability assay, apoptosis assay and cell migration assay were then performed, as described in Supplementary Methods (page 1).
Results
CpG methylation status in human normal purified hepatocytes
In order to confirm the reliability of WGBS using PBAT [Citation16], WGBS using the MethylC-Seq method [Citation40] and Infinium Assay [Citation41] using a HumanMethylation450 BeadChip (Illumina) were performed on the same sample, HPC6. Significant correlations of the results between WGBS using PBAT and WGBS using MethylC-Seq, and between WGBS using PBAT and the Infinium assay, were confirmed (Supplementary Figure 3A & B [page 305]).
CpG sites with a read depth of 10 or more were subjected to further analysis. All chromosomes were divided into 30,956,951 100-bp-length windows. Occurrence of de novo SNV on CpG sites (1.944 ± 0.064%) was significantly higher than that on all chromosomes (0.251 ± 0.008) on average for all six samples (Supplementary Table 6 [page 13]). For accurate analysis, CpG sites showing de novo SNV in at least one sample were omitted from calculation of the average DNA methylation levels of the 100-bp windows for all six samples.
Each window was annotated as (a) from 200 bp upstream of the transcription start site (TSS) to 1500 bp upstream of it (TSS1500), (b) from TSS to 200 bp upstream of TSS (TSS200), (c) the 5′ untranslated region (UTR), (d) the first coding exon (excluding the 5′ UTR from the first exon), (e) the first intron, (f) the gene body (second exon and downstream), (g) the 3′ UTR and (h) the intergenic region based on the Reference Sequence database [Citation28]. If a window was included in (a) to (g) of multiple genes, it was annotated for the nearest three genes. The number of windows annotated as (a) to (h) are summarized in Supplementary Table 7A (page 14). Each window was also categorized into (i) CpG island, (j) N-Shelf (2000 bp region 5′ adjacent to N-Shore), (k) N-Shore (2000 bp region 5′ adjacent to CpG island), (l) S-Shore (2000 bp region 3′ adjacent to CpG island), (m) S-Shelf (2000 bp region 3′ adjacent to S-Shore) and (n) open sea based on the UCSC Genome Browser [Citation42]. The number of windows annotated as (i) to (n) are summarized in Supplementary Table 7B (page 14).
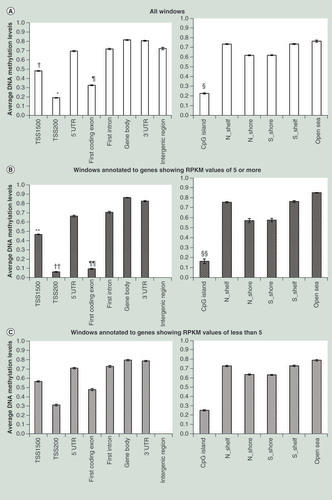
The mean values of the average levels of CpG methylation in 100-bp windows belonging to (a) to (h) for all six samples are shown in . CpG methylation levels of TSS200s and TSS1500s were significantly lower than other regions. Within first exons, CpG methylation levels of coding regions (first coding exons) were significantly lower than those of 5′ UTRs. The mean values of the average levels of CpG methylation in 100-bp windows belonging to (i) to (n) for all six samples are shown in . CpG methylation levels of CpG islands were significantly lower than other regions. Variations within individual samples are shown by box and whisker plots in Supplementary Figure 4 (page 307). Average CpG methylation levels of 100-bp windows for genes showing five or more RPKM and those showing less than five are shown in & C, respectively. CpG methylation levels of TSS200s, first coding exons and CpG islands were lower in actively transcribed genes () than in nonactive genes (). With respect to 100-bp windows belonging to lincRNAs, CpG methylation levels of TSS1500s, TSS200s, first exon, CpG islands, N-Shelf, N-Shore and S-Shelf showing RPKM values of 0.5 or more were significantly lower than those showing RPKM values of less than 0.5 (Supplementary Figure 5 [page 313]).
(A) CpG methylation levels of TSS200s (*) were significantly lower than those of TSS1500 (p = 8.923 × 10⁻¹⁸), 5′ UTR (p = 1.062 × 10⁻¹⁵), first coding exon (p = 2.193 × 10⁻¹³), first intron (p = 1.942 × 10⁻¹⁴), gene body (p = 5.025 × 10⁻¹⁵), 3′ UTR (p = 2.122 × 10⁻¹⁸) and intergenic region (p = 2.122 × 10⁻¹⁸). CpG methylation levels of TSS1500s (†) were significantly lower than those of 5′ UTR (p = 1.299 × 10⁻¹²), first intron (p = 8.598 × 10⁻¹²), gene body (p = 6.184 × 10⁻¹³), 3′ UTR (p = 7.758 × 10⁻¹⁶) and intergenic region (p = 1.011 × 10⁻⁸). Within first exons, CpG methylation levels of coding regions (first coding exons, ¶) were significantly lower than those of 5′ UTRs (p = 6.260 × 10⁻¹⁶). CpG methylation levels of CpG islands (§) were significantly lower than those of N-Shelf (p = 7.002 × 10⁻¹⁸), N-Shore (p = 4.147 × 10⁻¹⁶), S-Shore (p = 4.799 × 10⁻¹⁶), S-Shelf (p = 6.696 × 10⁻¹⁸) and open sea (p = 2.820 × 10⁻¹⁴). Error bars, standard deviation among windows or samples. CpG methylation levels of TSS1500s (**p = 6.372 × 10⁻⁷), TSS 200s (††p = 1.132 × 10⁻⁸), first coding exons (¶¶p = 5.201 × 10⁻⁹) and CpG islands (§§p = 2.830 × 10⁻⁴) in actively transcribed genes (B) were significantly lower than in suppressed genes (C).
RPKM: Read per kilobase pair per million read; TSS: Transcription start site; UTR: Untranslated region.
Methylome data for Roadmap liver tissue [Citation43] and Encode purified hepatocytes [Citation44,Citation45] are available from the public database. Although low CpG methylation in TSS200, the first coding exon and CpG island was confirmed even in the Encode data, the CpG methylation levels of Encode purified hepatocytes were generally lower than in our six purified hepatocyte samples and Roadmap liver tissue (Supplementary Figure 6 [page 314]). Such differences between our purified hepatocytes and Roadmap liver tissue on the one hand and Encode purified hepatocytes on the other are probably due to differences in analytical procedure: the Encode protocol involves reduced representation bisulfite sequencing.
Non-CpG methylation status of human normal purified hepatocytes
The number of non-CpG sites (CHG and CHH sites) showing 20% or more cytosine methylation in each of the six samples, and the averaged values for all six samples, are summarized in Supplementary Table 8 (page 15). The mean number of CHG and CHH sites showing such methylation in all six samples (mean ± standard deviation) were 468,807 ± 50,737 and 1,059,551 ± 75,647, respectively. The number of CHG sites showing 20% or more cytosine methylation on autosomes and the ratios of CHG sites showing 20% or more cytosine methylation for all CHG sites on autosomes are shown in . The sample-by-sample details are shown in Supplementary Figure 7 (page 315). The number of CHG sites showing 20% or more cytosine methylation on the sense and antisense strands on autosomes are shown in . Average methylation levels (less than 60 vs 60% or more) and the average expression levels of the genes (RPKM value by RNA-seq) are shown in . CHH sites showing 20% or more cytosine methylation are shown in & D in the same way.
(A) Methylation status on CHG sites. The number of methylated CHG sites in TSS200s (*) were significantly lower than those of TSS1500 (p = 7.544 × 10⁻⁶), 5′ UTR (p = 3.649 × 10⁻⁶), first intron (p = 4.154 × 10⁻⁶), gene body (p = 2.786 × 10⁻⁶), 3′ UTR (p = 3.318 × 10⁻⁶) and intergenic region (p = 3.182 × 10⁻⁶). The number of methylated CHG sites in first coding exons (†) were significantly lower than those of TSS1500 (p = 7.213 × 10⁻⁶), TSS200 (p = 9.236 × 10⁻⁵), 5′ UTR (p = 3.453 × 10⁻⁶), first intron (p = 3.785 × 10⁻⁶), gene body (p = 2.673 × 10⁻⁶), 3′ UTR (p = 3.060 × 10⁻⁶) and intergenic region (p = 3.147 × 10⁻⁶). The number of methylated CHG sites in TSS1500 (¶) were significantly lower than those of 5′ UTR (p = 4.864 × 10⁻⁶), first intron (p = 5.772 × 10⁻⁶), gene body (p = 3.512 × 10⁻⁶), 3′ UTR (p = 3.930 × 10⁻⁶) and intergenic region (p = 3.461 × 10⁻⁶). The ratios of CHG sites showing 20% or more cytosine methylation among all CHG sites belonging to TSS1500, TSS200, 5′ UTR, first coding exon, first intron, gene body, 3′ UTR and intergenic region are shown in the middle panel. The number of CHG sites (mean ± standard error for all six samples) showing 20% or more cytosine methylation on the sense and antisense strands are shown in the right panel. (B) Association between CHG methylation and gene expression. CHG methylation in TSS1500, TSS200 and first coding exon (p = 4.022 × 10⁻⁴) and in 5′ UTR, first intron, gene body and 3′ UTR (p = 2.369 × 10⁻³) was inversely associated with expression levels. (C) Methylation status on CHH sites. The number of methylated CHH sites in TSS200s (*) were significantly lower than those of TSS1500 (p = 1.041 × 10⁻⁶), 5′ UTR (p = 8.590 × 10⁻⁷), first intron (p = 5.310 × 10⁻⁷), gene body (p = 3.369 × 10⁻⁶), 3′ UTR (p = 1.649 × 10⁻⁶) and intergenic region (p = 1.939 × 10⁻⁷). The number of methylated CHH sites in first coding exons (†) were significantly lower than those of TSS1500 (p = 9.096 × 10⁻⁷), TSS200 (p = 1.714 × 10⁻⁶), 5′ UTR (p = 8.214 × 10⁻⁷), first intron (p = 4.849 × 10⁻⁷), gene body (p = 3.260 × 10⁻⁶), 3′ UTR (p = 1.514 × 10⁻⁶) and intergenic region (p = 1.924 × 10⁻⁷). The number of methylated CHH sites in TSS1500 (¶) were significantly lower than those of 5′ UTR (p = 1.161 × 10⁻⁶), first intron (p = 4.606 × 10⁻⁷), gene body (p = 4.555 × 10⁻⁶), 3′ UTR (p = 2.801 × 10⁻⁶) and intergenic region (p = 2.075 × 10⁻⁷). The ratio of CHH sites showing 20% or more cytosine methylation among all CHH sites belonging to TSS1500, TSS200, 5′ UTR, first coding exon, first intron, gene body, 3′ UTR and intergenic region is shown in the middle panel. Twenty percent or more CHH methylation was observed more frequently on the antisense strand than on the sense strand (coding strand) in the 5′ UTR (p = 1.312 × 10⁻³), first intron (p = 1.214 × 10⁻⁴), gene body (p = 2.598 × 10⁻³) and 3′ UTR (p = 1.885 × 10⁻²) (right panel of C), whereas CHG methylation did not show such significant differences between the sense and antisense strands (right panel of A). (D) Association between CHH methylation and gene expression. CHH methylation in TSS1500, TSS200 and first coding exon (p = 1.170 × 10⁻¹³) and in 5′ UTR, first intron, gene body and 3′ UTR (p = 3.337 × 10⁻⁴) was inversely associated with expression levels. Error bars, standard error.
TSS: Transcription start site; UTR: Untranslated region.
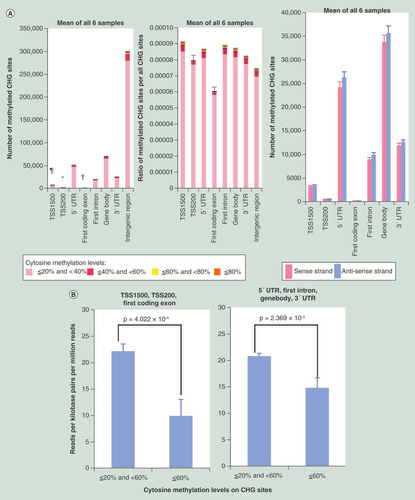
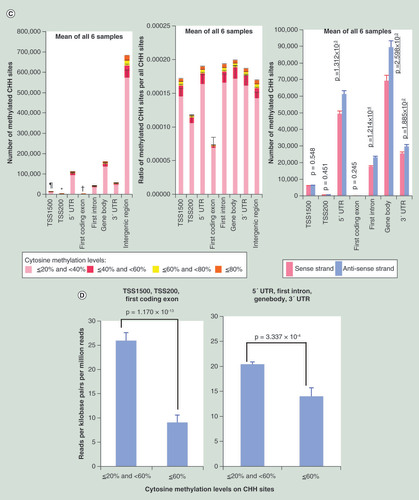
Twenty to 40% CHG () and CHH () methylation was observed more frequently than 40% or more methylation. CHG () and CHH () methylation was observed less frequently in TSS200, the first coding exon and TSS1500. Twenty percent or more CHH methylation on the antisense strand was observed more frequently than on the sense strand (coding strand) in the 5′ UTR, first intron, gene body and 3′ UTR (), whereas CHG methylation did not show such significant differences between the sense and antisense strands (). CHG and CHH methylation was significantly correlated with higher methylation levels at neighboring CpG sites (Supplementary Table 9 [page 17]). CHG and CHH methylation showed significant inverse association with gene expression levels ( & D). The association for lincRNAs is shown in Supplementary Figure 5C & D (page 313).
pDMRs among human normal purified hepatocytes
We focused on personal variation of CpG methylation profiles. If the average DNA methylation level of a 100-bp window in a sample was 0.3 or more higher than the maximum DNA methylation level of the other five samples and DNA methylation levels of the other five samples were within 0.3, the window was defined as ‘pDMR showing DNA hypermethylation’ for the sample (Supplementary Figure 8A [page 316]). ‘pDMR showing DNA hypomethylation’ for the sample was defined in the same way (Supplementary Figure 8B [page 316]). Representative pDMRs showing DNA hypermethylation and DNA hypomethylation are shown in . Since PBAT shows good coverage for GC-rich regions, more accurate evaluation can be performed for GC-rich pDMRs in comparison to MethylC-seq (Supplementary Figure 3C [page 306]). The number of pDMRs for each sample and the mean of all six samples are summarized in Supplementary Table 10 (page 18).
(A) Representative pDMRs (blue boxes) showing DNA hypermethylation (a: HPC6, HPC20 and HPC28) and DNA hypomethylation (b: HPC25) based on the definition shown in Supplementary Figure 8 (page 316). (B) The ratio of pDMRs belonging to TSS1500, TSS200, 5′ UTR, first coding exon, first intron, gene body, 3′ UTR and intergenic region for all pDMRs in each sample (pie charts) and the average ratios of the number of pDMRs per total number of 100-bp windows on autosomes that contain CpG sites and belong to TSS1500, TSS200, 5′ UTR, first coding exon, first intron, gene body, 3′ UTR and intergenic region in all six samples (bar graph). pDMRs in TSS200s (*) were less frequent than those in TSS1500 (p = 2.550 × 10⁻²), 5′ UTR (p = 1.755 × 10⁻²) and intergenic region (p = 6.466 × 10⁻³). pDMRs in first coding exons (†) were less frequent than those in TSS1500 (p = 7.647 × 10⁻³), 5′ UTR (p = 3.385 × 10⁻³), first intron (p = 5.665 × 10⁻³), gene body (p = 1.030 × 10⁻²), 3′ UTR (p = 6.319 × 10⁻³) and intergenic region (p = 6.294 × 10⁻³). pDMRs in TSS1500 (¶) were less frequent than those in 5′ UTR (p = 5.451 × 10⁻⁴), first intron (p = 4.724 × 10⁻³), gene body (p = 2.846 × 10⁻²) and intergenic region (p = 6.743 × 10⁻³). (C) pDMRs in CpG island (§) were less frequent than those in N-Shelf (p = 2.010 × 10⁻²), N-Shore (p = 5.850 × 10⁻³), S-Shore (p = 6.111 × 10⁻³), S-Shelf (p = 8.473 × 10⁻³) and open sea (p = 5.695 × 10⁻³).
Chr: Chromosome; pDMR: Personal differentially methylated region; UTR: Untranslated region.
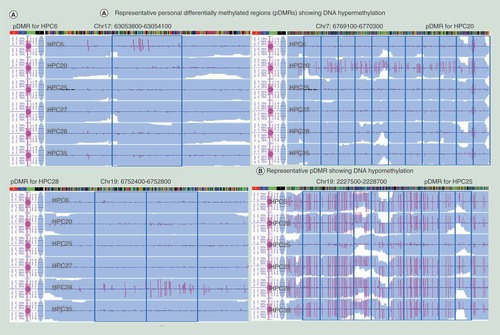
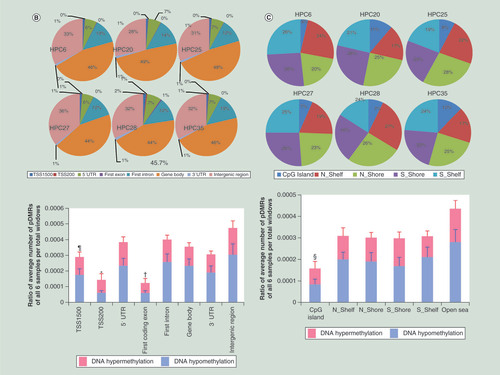
Pie charts in show the ratios of pDMRs belonging to TSS1500, TSS200, 5′ UTR, first coding exon, first intron, gene body, 3′ UTR and intergenic region for all pDMRs of each sample. Differences in the ratio among samples were not obvious among the pie charts. The bar graph in shows the average ratios of the number of pDMRs per total number of 100-bp windows on autosomes containing CpG sites and belonging to TSS1500, TSS200, 5′ UTR, first coding exon, first intron, gene body, 3′ UTR and intergenic region of all six samples. Personal variations in CpG methylation levels were observed less frequently in TSS200s, first coding exons and TSS1500s (bar graph in ). Pie charts in show the ratio of pDMRs belonging to CpG island, N-Shelf, N-Shore, S-Shore and S-Shelf for all pDMRs in each sample. Differences in the ratio among samples were not obvious among the pie charts. Personal variations in CpG methylation levels were observed less frequently in CpG islands (bar graph in ).
Among all the examined 100-bp windows on autosomes, 21,682 and 21 windows showed significant correlations between the average CpG methylation levels and age and sex of the six individuals, respectively. Among the 21,682 age-related windows, 53 were included in pDMRs: the average DNA methylation levels of less than 1% of the pDMRs showed significant correlations with age (Supplementary Table 11 [page 19]). Among the 21 sex-related windows (summarized in Supplementary Table 12 [page 20]), none was included in the pDMRs.
Histone modification profiles in human normal purified hepatocytes
Representative wiggle tracks for each mark of the ALB and PLK genes are shown in Supplementary Figure 9 (page 317). Differing from the ChIP-seq data (H3K27AC and H3K27me3) for three hepatocyte samples without detailed metadata deposited in public databases [Citation46–48], our data consist of six marks (H3K4me3, H3K9me3, H3K27me3, H3K27AC, H3K4me1 and H3K36me3) and were obtained from healthy hepatocytes with accurate metadata, as shown in Supplementary Table 1 (page 8), for which DNA methylation and expression profiles are available.
When we focused on representative genes encoding transcription factors that are highly expressed in hepatocytes and reportedly important for hepatocyte function, such as HNF1 and HNF4, lower DNA methylation levels and H3K4me3 and H3K27AC marks around the TSS were observed in all six of our purified hepatocyte samples without exception (representative data are shown in ), whereas such marks were not observed in genes encoding organ-specific transcription factors that are not expressed in hepatocytes, such as PAX8 and CDX2 (all panels for all six samples of the HNF1, HNF4, PAX8 and CDX2 genes are shown in Supplementary Figure 10 [page 319]). In addition, the number of peaks revealed by ChIP-seq that were detected in all three samples from males but not in all three samples from females, or vice versa, are summarized in Supplementary Table 13 (page 21). The H3K4me3 and H3K27AC peaks showing such sex differences frequently resulted in significant overexpression in samples from males in comparison with those from females, or vice versa, respectively (Supplementary Table 14 [page 22]).
(A) Representative wiggle tracks of genes encoding transcription factors that are highly expressed in hepatocytes and reportedly important for hepatocyte function, such as HNF1 and HNF4, in HPC6 and HPC27 samples. Panels of the HNF1 and HNF4 genes in four other samples and for genes encoding organ-specific transcription factors that are not expressed in hepatocytes, such as PAX8 and CDX2, in the six purified hepatocyte samples are shown in Supplementary Figure 10 (page 319). (B) Heatmap of ChIP-seq data in HPC6, HPC20, HPC25, HPC27, HPC28 and HPC35 generated by the ChromeHMM pipeline [Citation27]. The ratios (mean of all six samples) for all autosomal windows (C), windows annotated to genes showing five or more RPKMs (D), windows annotated to genes showing RPKM values of less than 5 (E), and pDMRs (F) are shown.
ChIP-seq: Chromatin immunoprecipitation–sequencing; pDMR: Personal differentially methylated region; RPKM: Read per kilobase pair per million read.
![Figure 4. Histone modification status based on the mean values for human normal purified hepatocytes (HPC6, HPC20, HPC25, HPC27, HPC28 and HPC35). (A) Representative wiggle tracks of genes encoding transcription factors that are highly expressed in hepatocytes and reportedly important for hepatocyte function, such as HNF1 and HNF4, in HPC6 and HPC27 samples. Panels of the HNF1 and HNF4 genes in four other samples and for genes encoding organ-specific transcription factors that are not expressed in hepatocytes, such as PAX8 and CDX2, in the six purified hepatocyte samples are shown in Supplementary Figure 10 (page 319). (B) Heatmap of ChIP-seq data in HPC6, HPC20, HPC25, HPC27, HPC28 and HPC35 generated by the ChromeHMM pipeline [Citation27]. The ratios (mean of all six samples) for all autosomal windows (C), windows annotated to genes showing five or more RPKMs (D), windows annotated to genes showing RPKM values of less than 5 (E), and pDMRs (F) are shown.ChIP-seq: Chromatin immunoprecipitation–sequencing; pDMR: Personal differentially methylated region; RPKM: Read per kilobase pair per million read.](/cms/asset/e353e828-85a3-4394-b2ee-c451b7bc32b8/iepi_a_12323862_f0007.jpg)
![Figure 4. Histone modification status based on the mean values for human normal purified hepatocytes (HPC6, HPC20, HPC25, HPC27, HPC28 and HPC35). (A) Representative wiggle tracks of genes encoding transcription factors that are highly expressed in hepatocytes and reportedly important for hepatocyte function, such as HNF1 and HNF4, in HPC6 and HPC27 samples. Panels of the HNF1 and HNF4 genes in four other samples and for genes encoding organ-specific transcription factors that are not expressed in hepatocytes, such as PAX8 and CDX2, in the six purified hepatocyte samples are shown in Supplementary Figure 10 (page 319). (B) Heatmap of ChIP-seq data in HPC6, HPC20, HPC25, HPC27, HPC28 and HPC35 generated by the ChromeHMM pipeline [Citation27]. The ratios (mean of all six samples) for all autosomal windows (C), windows annotated to genes showing five or more RPKMs (D), windows annotated to genes showing RPKM values of less than 5 (E), and pDMRs (F) are shown.ChIP-seq: Chromatin immunoprecipitation–sequencing; pDMR: Personal differentially methylated region; RPKM: Read per kilobase pair per million read.](/cms/asset/f05c4487-990b-4452-812b-21f3b3868852/iepi_a_12323862_f0008.jpg)
![Figure 4. Histone modification status based on the mean values for human normal purified hepatocytes (HPC6, HPC20, HPC25, HPC27, HPC28 and HPC35). (A) Representative wiggle tracks of genes encoding transcription factors that are highly expressed in hepatocytes and reportedly important for hepatocyte function, such as HNF1 and HNF4, in HPC6 and HPC27 samples. Panels of the HNF1 and HNF4 genes in four other samples and for genes encoding organ-specific transcription factors that are not expressed in hepatocytes, such as PAX8 and CDX2, in the six purified hepatocyte samples are shown in Supplementary Figure 10 (page 319). (B) Heatmap of ChIP-seq data in HPC6, HPC20, HPC25, HPC27, HPC28 and HPC35 generated by the ChromeHMM pipeline [Citation27]. The ratios (mean of all six samples) for all autosomal windows (C), windows annotated to genes showing five or more RPKMs (D), windows annotated to genes showing RPKM values of less than 5 (E), and pDMRs (F) are shown.ChIP-seq: Chromatin immunoprecipitation–sequencing; pDMR: Personal differentially methylated region; RPKM: Read per kilobase pair per million read.](/cms/asset/060eda2b-1576-48a4-96ca-4c4b947d30fe/iepi_a_12323862_f0009.jpg)
All 100-bp windows on all autosomes of all six samples were grouped into ten subclusters based on ChIP-seq data by the ChromeHMM pipeline. The heatmap obtained by ChromHMM is shown in and the emission parameters for each cluster are summarized in Supplementary Table 15 (page 23). We annotated each cluster as follows: clusters 3, 4 and 5: H3K4me1 and H3K27AC predominant pattern, clusters 1 and 2: H3K4me3 and H3K27AC predominant pattern, clusters 9 and 10: H3K36me3 predominant pattern, cluster 6: no distinctive mark pattern, cluster 8: H3K27me3 predominant pattern and cluster 7: H3K9me3 predominant pattern. Analogous with the annotation suggested by Ernst et al. [Citation49], the 3K4me1 and H3K27AC predominant pattern, the H3K4me3 and H3K27AC predominant pattern, the H3K36me3 predominant pattern, the no distinctive mark pattern, the H3K27me3 predominant pattern and the H3K9me3 predominant pattern have also been interpreted as the strong enhancer cluster, active promoter cluster, transcribed gene cluster, low signal cluster, polycomb-repressed gene cluster and heterochromatin region cluster, respectively. The ratio of autosomal windows showing histone modifications of the H3K4me1 and H3K27AC predominant pattern (strong enhancer: clusters 3, 4 and 5), H3K4me3 and H3K27AC predominant pattern (active promoter: clusters 1 and 2), H3K36me3 predominant pattern (transcribed gene: clusters 9 and 10), no distinctive mark pattern (low signal: cluster 6), H3K27me3 predominant pattern (polycomb-repressed gene: cluster 8) and H3K9me3 predominant pattern (heterochromatin region: cluster 7) are shown in . The sample-by-sample details are shown in Supplementary Figure 11 (page 323). Differing from the DNA methylation profiles shown in & C, considerable variations in the histone modification profiles among samples shown in Supplementary Figure 11 (page 323) were observed. On the other hand, the finding that H3K4 methylation and H3K27 acetylation were frequently observed in TSS200, the first coding exon and CpG island, especially in genes showing RPKM values of 5 or more (), whereas H3K27me3 suppression was frequently observed in genes showing RPKM values of less than 5 (), was not unexpected.
The histone modification patterns of pDMRs are shown in . The sample-by-sample details are shown in Supplementary Figure 11G (page 325). Histone modification patterns that were observed frequently or less frequently (binomial test; p < 0.05) in pDMRs than in all autosomes are summarized in Supplementary Table 16 (page 24). When compared with all autosomes, histone modification profiles of pDMRs did not show a common tendency in TSS1500, TSS200, 5′ UTR, first coding exon, first intron, gene body, 3′ UTR and intergenic region, or in CpG island, N-Shelf, N-Shore S-Shore, S-Shelf and open sea: histone modifications frequently observed in pDMRs differed from each other among each batch of six samples (Supplementary Table 16 [page 24]).
Expression profiles in human normal purified hepatocytes
We focused on genes showing personal variations in expression levels. If a gene showed an RPKM value that was at least twice the maximum for the other five samples, it was defined as personal overexpression in that sample. If a gene showed an RPKM value that was a half or less of the minimum for other five samples, it was defined as personal underexpression in that sample. Genes showing personal over- or underexpression in each sample are summarized in Supplementary Table 17 (page 25): 6864, 2648, 2700, 2121, 2828 and 3628 genes for HPC6, HPC20, HPC25, HPC27, HPC28 and HPC35, respectively.
If a pDMR showing DNA hypermethylation (or hypomethylation) was located within 1500 bp upstream or downstream of TSS of a gene showing personal underexpression (or overexpression) in the same sample, respectively, we considered that the pDMR was potentially associated with personal expression variation in normal purified hepatocytes from the same individual: genes showing such an association are summarized in Supplementary Table 18 (page 281).
In order to validate the association between variations in DNA methylation levels and variations in expression levels of the 30 genes listed in Supplementary Table 18 (page 281), DNA methylation and expression data deposited in a public database (Integrative Disease Omics Database [Citation50]) were examined. Significant inverse correlations between DNA methylation levels and expression levels for the AURKB, BOK, C11orf21, CLEC2B, CSDC2, CYP4F12, GRB7, KLHDC7B, MYOC, NPR2, PLLP, RASGRF2, SLC28A1, SLC44A3, STEAP2, TFF1 and TMEM105 genes were confirmed in the database (Supplementary Table 19 [page 282]).
Genome–epigenome correlation
The number of SNVs that were observed in only one sample but not in the other five, in each sample batch are summarized in Supplementary Table 20A (page 283). The number of pDMRs existing in the vicinity, in other words, within 1000 bp upstream or downstream, of SNVs in each sample are summarized in Supplementary Table 20A (page 283): pDMRs were observed more frequently in the vicinity of SNVs than on all autosomes in all six samples of hepatocytes (binomial test, ). Such a correlation between SNVs and pDMRs is also shown in . The number of pDMRs existing in the vicinity, in other words, within 1000 bp upstream or downstream, of indels in each sample are summarized in Supplementary Table 20B (page 283): pDMRs were observed more frequently in the vicinity of indels than on all autosomes in five of the six hepatocyte samples examined (binomial test, ). Such a correlation between SNVs and pDMRs is also shown in .
Table 1. Genome–epigenome correlation: personal differentially methylated regions, genetic polymorphisms† and copy number variations.
(A) Histogram of pDMRs according to the distance from SNVs in six samples of normal hepatocytes. pDMRs were observed more frequently in the vicinity, in other words, within 1000 bp upstream or downstream, of SNVs than on all autosomes in all six samples (also see ). (B) Histogram of pDMRs according to the distance from indels in six samples of normal hepatocytes. pDMRs were observed more frequently in the vicinity, in other words, within 1000 bp upstream or downstream, of indels than on all autosomes in five of the six samples (also see ). (C) Histogram of regions showing CNVs according to the distance from pDMRs in six samples of normal hepatocytes. CNVs were observed more frequently in the vicinity, in other words, within 1000 bp upstream or downstream, of pDMRs (especially pDMRs showing DNA hypomethylation), than on all autosomes in five of the six samples (also see ).
bp: Base pair; CNV: Copy number variation; indel: Insertion/deletion; pDMR: Personal differentially methylated region; SNV: Single nucleotide variation.
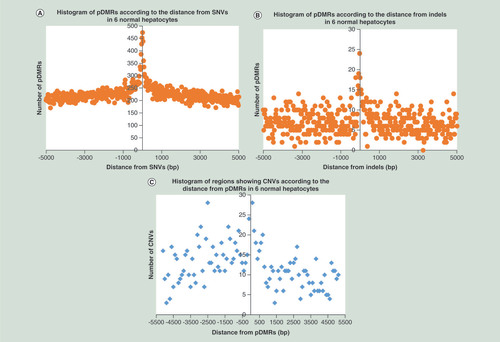
The number of regions showing copy number variations (CNVs) in each sample are summarized in Supplementary Table 20C (page 284). The number of CNVs existing in the vicinity, in other words, within 1000 bp upstream or downstream, of pDMRs in each sample are summarized in Supplementary Table 20C (page 284): CNVs were observed more frequently in the vicinity of pDMRs, especially pDMRs showing DNA hypomethylation, than on all autosomes in five of the six hepatocyte samples examined (binomial test, ). Such correlations between pDMRs and CNVs are also shown in .
Pathway analysis
Supplementary Table 21 (page 285) summarizes 179 genes showing both genetic variations (SNVs and/or indels) and epigenetic variations (pDMRs) in two or more human normal purified hepatocyte samples. MetaCore pathway analysis by GeneGo using these 179 genes revealed that genes showing both genetic and epigenetic variations were significantly accumulated in 168 pathways (p < 0.05, Supplementary Table 22 [page 289]). After exclusion of pathways specific to organs other than the liver, 46 pathways, which are potentially correlated with liver function, epithelial cell function or immune response, and showed a p-value of 0.01 or less, are summarized in . Two representative signaling pathways, ‘Development_Endothelin-1/EDNRA transactivation of EGFR’ (p = 9.282 × 10⁻⁶) [Citation51,Citation52] and ‘G-protein signaling_G-Protein α-q signaling cascades’ (p = 5.671 × 10⁻⁵) [Citation53–55] have been illustrated schematically in Supplementary Figure 12 (page 326).
Table 2. Signaling pathways in which genes showing both genetic variations† and epigenetic variations‡ were significantly accumulated, as revealed by MetaCore pathway analysis§.
Transfection with siRNA
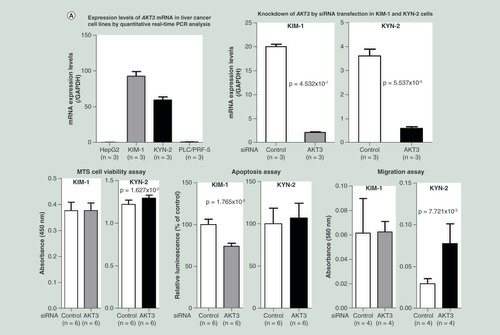
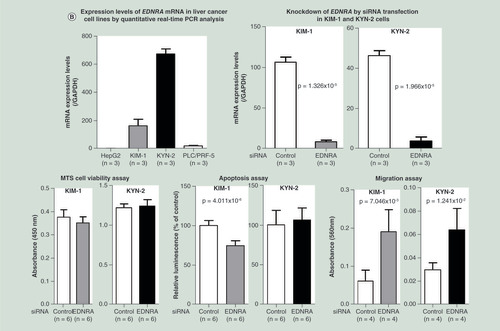
Knockdown of the AKT3 gene, a representative gene frequently showing both SNV and pDMR and listed in , in hepatocellular carcinoma KIM-1 and KYN-2 cells, which show higher levels of AKT3 expression, resulted in increased cell viability (p = 1.627 × 10⁻² for KYN-2), reduced apoptosis (p = 1.765 × 10⁻⁵ for KIM-1) and enhanced cell migration (p = 7.721 × 10⁻³ for KYN-2) (). Knockdown of another representative gene, EDNRA, in KIM-1 and KYN-2 cells, which show higher levels of EDNRA expression, resulted in reduced apoptosis (p = 4.011 × 10⁻⁶ for KIM-1) and enhanced cell migration (p = 7.046 × 10⁻³ for KIM-1 and p = 1.241 × 10⁻² for KYN-2) ().
(A) Knockdown of the AKT3 gene by siRNA transfection was performed in HCC cell lines KIM-1 and KYN-2, which show higher levels of AKT3 expression. Knockdown of the AKT3 gene resulted in increased cell viability (p = 1.63 × 10⁻² for KYN-2), reduced apoptosis (p = 1.77 × 10⁻⁵ for KIM-1) and enhanced cell migration (p = 0.77 × 10⁻² for KYN-2). (B) Knockdown of the EDNRA gene by siRNA transfection was performed in HCC cell lines KIM-1 and KYN-2, which show higher levels of EDNRA expression. Knockdown of the EDNRA gene resulted in reduced apoptosis (p = 4.011 × 10⁻⁶ for KIM-1) and enhanced cell migration (p = 0.70 × 10⁻² for KIM-1 and p = 0.70 × 10⁻² for KYN-2). These data indicated that AKT3 and EDNRA, representative genes frequently showing both genetic and epigenetic variations (single nucleotide variation and personal differentially methylated region) and included in the top pathway of , play a significant role in hepatocyte functions such as proliferation, apoptosis and migration.
HCC: Hepatocellular carcinoma.
Discussion
Epigenome profiles satisfying the IHEC recommendations have been obtained using highly reliable methods, such as PBAT [Citation16], in multiple samples of human normal hepatocytes highly purified immediately after surgery. Although six patients had liver metastases from cancers arising in organs other than the liver, and their hepatocytes were free from hepatitis virus infection and liver-specific precancerous conditions, with no remarkable histological features, they were of relatively advanced age and may have been affected by carcinogenetic factors capable of inducing cancers of organs other than the liver. Therefore, the possibility that our hepatocytes may have represented ‘totally normal materials’ is debatable. In addition, since simultaneous WGBS, ChIP-seq, RNA-seq and WGS for the same purified sample involved laborious work, such a study of a larger cohort would have been impractical. Therefore, for a comparison of six samples, the statistical power would not have been conclusive, and therefore this represents a clear limitation of this study. Since it is not easy to obtain totally normal human tissue samples, it seems that in order to obtain a comprehensive picture of totally normal reference hepatocyte epigenomes, a comparison of data for various hepatocytes that have been, or will be, deposited in the IHEC data portal and other databases will be necessary.
DNA methylation profiles such as low CpG methylation levels in TSS1500, TSS200 and CpG island were obtained especially in actively transcribed genes (). Even within the first exon, differing from the 5′ UTR, the first coding exon in particular was shown to have a low CpG methylation level (). Such low CpG methylation in TSS200, the first coding exon and CpG island was also confirmed in an adult liver tissue sample deposited in the Roadmap database [Citation56] (accession number: GSM916049) (Supplementary Figure 6 [page 314]). Additional analysis using the Roadmap database revealed that low CpG methylation in such regions may not be a liver-specific phenomenon, but common in organs other than the liver (Supplementary Figure 6 [page 314]).
Unlike CHG sites, CHH sites are not located symmetrically on the sense and antisense strands along genomic DNA. In addition, CHH methylation was observed more frequently on the antisense strands than on the sense strands in the 5′ UTR, first intron, gene body and 3′ UTR (). Such observations are consistent with the more frequent non-CpG methylation on the antisense strand reported previously [Citation57]. It has been reported that non-CpG methylation was significantly correlated with gene expression levels in human H1 embryonic stem cells [Citation57], whereas non-CpG methylation was inversely correlated with expression in adult tissues [Citation58]. Our data for purified hepatocytes are consistent with the latter inverse association. Since CHG and CHH methylation was significantly correlated with higher CpG methylation levels in neighboring regions (Supplementary Table 9 [page 17]), this inverse association with expression levels was not unexpected.
Since epigenome profiles of multiple human normal purified hepatocytes were obtained, we focused on personal variation of CpG methylation profiles. pDMRs were observed less frequently in TSS200, the first coding exon, TSS1500 and CpG island where CpG methylation levels were low, indicating that the regions important for expression regulation may be protected from personal variations of CpG methylation. Unlike the histone modification profiles for which personal variations among samples are shown in Supplementary Figure 11 (page 323), variations of DNA methylation profiles were not obvious among the samples (pie charts in & C).
Based on ChIP-seq data, presumptive histone modification profiles [Citation59], such as the histone H3K4 methylation and H3K27 acetylation predominant active marks in TSS200 and CpG island and the H3K27me3 predominant suppressive mark in the intergenic region and open sea, were obtained. On the other hand, 114 genes in which TSS 200 regions showing a H3K4me3 and H3K27AC-dominant histone modification pattern (active promoter cluster) and low DNA methylation levels (<0.5) showed low level expression (less than 0.01 RPKM) in two or more samples (Supplementary Table 23 [page 292]). Such genes that appeared to be less reliant on known epigenetic regulation revealed additional complexities of gene regulation mechanisms.
Differing from DNA methylation profiles, considerable personal variations in the histone modification profiles were observed among samples (Supplementary Figure 11 [page 323]), suggesting that histone modification profiles might be easily altered according to physiological conditions. Since histone modification can induce DNA methylation (e.g., histone methyltransferases G9a and SUV39H1 can recruit DNA methyltransferases) [Citation60,Citation61], some of the histone modification alterations based on physiological conditions (personal variations in histone modification patterns) may result in alterations of DNA methylation (personal variations in DNA methylation profiles such as pDMRs). However, the histone modification patterns of pDMRs did not show a common tendency among normal hepatocyte samples (Supplementary Table 16 [page 24]), and the specific histone modifications that precede and/or induce DNA methylation variations among individuals remain unclear.
Associations between CpG methylation variations (pDMRs) and expression variations (personal over- or underexpression) were observed in the genes listed in Supplementary Table 18 (page 281). Among these genes, expression regulation due to CpG methylation of the LRP1B [Citation62], RASGRF [Citation63] and TFF1 [Citation64] genes has already been reported in normal and diseased states. Moreover, data deposited in a reliable public database [Citation50,Citation65] validated the significant inverse correlations between DNA methylation levels and expression levels of the AURKB, BOK, C11orf21, CLEC2B, CSDC2, CYP4F12, GRB7, KLHDC7B, MYOC, NPR2, PLLP, RASGRF2, SLC28A1, SLC44A3, STEAP2, TFF1 and TMEM105 genes (Supplementary Table 19 [page 282]). Taken together, although further analysis is needed, the possibility that personal variations of CpG methylation (pDMRs) may result in personal variations in the expression levels of specific genes in normal cells can be considered.
In addition to the standard recommendation by the IHEC, we performed WGS using human normal purified hepatocytes and focused on genome–epigenome correlation. It was clearly shown that pDMRs are located more frequently in the vicinity of loci showing genetic variation (SNVs and/or indels) than on all autosomes ( & ): 15.7–22.9% of pDMRs and 0.7–2.1% of pDMRs were located in the vicinity of SNVs and indels, respectively (Supplementary Table 20A & B [page 283]). Although further study is needed to clarify the molecular background of such genome–epigenome correlation, we speculate that SNVs and indels may affect the binding of noncoding RNAs and/or protein complexes that induce histone modification or CpG methylation alterations around the SNV and indel loci. If this possibility were to be extended to a larger number of individuals, the association of DNA methylation status with rare SNVs and indels may have resulted in rare phenotypic individuality in this cohort. SNVs and indels showing a certain frequency may have stratified the phenotypes in the cohort through different DNA methylation profiles. In addition, ethnic variation in the frequencies of SNVs and indels may generate interethnic differences in DNA methylation profiles.
On the other hand, it is known that hotspots of DNA methylation alterations are frequently concordant with hotspots of copy number alterations in human cancers. DNA hypomethylation can induce chromosomal instability via alterations of chromatin configuration: mice carrying a hypomorphic allele of the DNMT1 gene developed aggressive tumors that displayed a high frequency of chromosomal abnormalities [Citation66]. By analogy with such findings, we examined the associations between variations of CpG methylation (pDMRs) and CNVs, and found that CNVs were more frequent in the vicinity of pDMRs, especially pDMRs showing DNA hypomethylation (), although we cannot conclude with certainty whether this represented a causal relationship or simple concordance.
Genes showing both genetic and epigenetic variations in multiple samples were significantly accumulated in signaling pathways participating in various functions in normal and diseased epithelial cells including hepatocytes (). Even when we examined genes showing SNVs and/or indels in 5% or more of the Japanese public cohort deposited in the Integrative Japanese Genome Variation Database [Citation67] and pDMRs in our six purified hepatocyte samples (Supplementary Table 24 [page 293]), such genes were accumulated in 43 of the 46 pathways listed in (Supplementary Table 25 [page 301]), indicating that the enriched pathways did not solely reflect our samples alone, but were of universal significance in a larger Japanese cohort. Knockdown for AKT3 and EDNRA, representative genes, frequently showing both SNV/indel and pDMR and included in the top pathway in , resulted in increased cell proliferation, reduced apoptosis and enhanced migration of hepatocellular carcinoma cell lines (), indicating that such genes have significant importance for hepatocyte function. Genetic variations can induce epigenetic variations in a cis-acting manner and may generate individual differences in the phenotypes of hepatocytes.
also includes the pathways participating in the functions of cells other than hepatocytes, such as inflammatory response pathways. Shi et al. reported that methylation quantitative trait loci (meQTL) in the lung were replicated in both breast and kidney tissues [Citation68]. Among the replicated meQTL documented by Shi et al., the STARTD3, BRF1, AGA, SLC35A3 and PABPC4 genes were also included in our pDMRs. In addition, Volkov et al. [Citation69] and Grundberg et al. [Citation70] identified 39,386 cis-mQTL in adipose tissue that were also found in pancreatic islets and 31,735 meQTL in adipose tissue that were also replicated in whole blood samples, respectively. These previous reports suggested that genome–epigenome correlations observed in a specific cell lineage, such as our sample of hepatocytes, may be shared by other cell lineages in the same individuals. If the same genome–epigenome correlation shown in is established even in other cell lineages, such as those with roles in the immune system, then the interaction may affect a wider variety of cell functions or disease susceptibility.
Conclusion
pDMRs were frequently observed around the TSSs of genes whose expression is reportedly regulated by CpG methylation. In addition, they were frequently observed in the vicinity of SNVs and indels, suggesting possible cis-acting genome–epigenome interaction. Genes showing both genetic (SNVs and indels) and epigenetic (pDMRs) variations in multiple samples were accumulated in signaling pathways participating in hepatocyte function and disease susceptibility. These data indicated that genetic variations may induce epigenetic variations, generating individual differences in the phenotypes of normal hepatocytes through variations in expression.
Future perspective
In parallel, Supplementary Table 20 (page 283) revealed that about 80% of pDMRs are located independently from SNVs and/or indels. Moreover, less than 1% of pDMRs (Supplementary Table 11 [page 19]) and no pDMR showed significant correlations with age and sex, respectively. At least a proportion of the age-related pDMRs may reflect the cumulative effects of environmental exposures throughout life. Moreover, the majority of CpG methylation variations (about 80%) may be induced by environmental and/or epidemiological factors including exposure to carcinogens, rather than by genetic variations, aging-related insults and sex. In particular, even though six patients did not have hepatitis virus infection or NASH, their hepatocytes may have been exposed to some degree of inflammation () reflecting the lifestyle habits and metabolic state of each patient. Such inflammation-related epigenome profiles may represent a very early phase of inflammation-related diseases. After accumulation of numerous reference epigenome profile data in the IHEC database, such correlations between epigenome variations and environmental factors will be examined further.
In the course of our research as a member group of the International Human Epigenome Consortium, we subjected hepatocytes purified from six Japanese patients without hepatitis virus infection or hepatocellular carcinoma who had undergone partial hepatectomy to whole-genome bisulfite sequencing using postbisulfite adaptor tagging, chromatin immunoprecipitation–sequencing, RNA sequencing and whole-genome sequencing to reveal the epigenome landscape of normal human hepatocytes.
CpG methylation levels were low in TSS200, TSS1500 and the first coding exon.
CHH methylation on the antisense strand was more frequent than on the sense strand. CHG and CHH methylation was correlated with higher methylation at neighboring CpG sites and was inversely associated with gene expression levels.
Personal differentially methylated regions (pDMRs) were less frequent in TSS200, TSS1500, the first coding exon and CpG island where CpG methylation levels were low, indicating that the regions important for expression regulation may be protected from personal variations of CpG methylation.
Histone modification profiles of pDMRs differed considerably among samples.
pDMRs were observed around the transcription start sites of genes whose expression is reportedly regulated by CpG methylation.
pDMRs were frequently observed in the vicinity of single nucleotide variations (SNVs) and insertions and deletions (indels), suggesting possible cis-acting genome–epigenome correlation.
Genes showing both genetic (SNVs and indels) and epigenetic (pDMRs) variations in multiple samples were accumulated in signaling pathways participating in hepatocyte function and disease susceptibility.
These data suggested that genetic variations may induce epigenetic variations, generating individual differences in normal hepatocyte phenotypes through variations in expression.
Ethical conduct of research
All of the patients included in this study provided written informed consent. This study (2012-095) was approved by the Ethics Committees of the National Cancer Center, Tokyo, and Keio University School of Medicine, and was performed in accordance with the Declaration of Helsinki.
Supplemental Information 1
Download PDF (32 MB)Supplementary data
To view the supplementary data that accompany this paper please visit the journal website at: https://www.tandfonline.com/doi/suppl/10.2217/epi-2017-0111
Financial & competing interest disclosure
This work was supported by AMED-CREST, Japan Agency for Medical Research and Development (16gm0510003h0006). The authors have no other relevant affiliations or financial involvement with any organization or entity with a financial interest in or financial conflict with the subject matter or materials discussed in the manuscript apart from those disclosed.
No writing assistance was utilized in the production of this manuscript.
Additional information
Funding
References
- Claycombe KJ , BrissetteCA , GhribiO . Epigenetics of inflammation, maternal infection, and nutrition . J. Nutr.145 ( 5 ), 1109S – 1115S ( 2015 ).
- Baylin SB , JonesPA . A decade of exploring the cancer epigenome – biological and translational implications . Nat. Rev. Cancer11 ( 10 ), 726 – 734 ( 2011 ).
- Keating ST , El-OstaA . Epigenetics and metabolism . Circ. Res.116 ( 4 ), 715 – 736 ( 2015 ).
- Tian Y , WongVW , WongGLet al. Histone deacetylase HDAC8 promotes insulin resistance and β-catenin activation in NAFLD-associated hepatocellular carcinoma . Cancer Res.75 ( 22 ), 4803 – 4816 ( 2015 ).
- Nagashio R , AraiE , OjimaH , KosugeT , KondoY , KanaiY . Carcinogenetic risk estimation based on quantification of DNA methylation levels in liver tissue at the precancerous stage . Int. J. Cancer129 ( 5 ), 1170 – 1179 ( 2011 ).
- Arai E , UshijimaS , GotohMet al. Genome-wide DNA methylation profiles in liver tissue at the precancerous stage and in hepatocellular carcinoma . Int. J. Cancer125 ( 12 ), 2854 – 2862 ( 2009 ).
- Kanai Y , AraiE . Multilayer-omics analyses of human cancers: exploration of biomarkers and drug targets based on the activities of the International Human Epigenome Consortium . Front. Genet.5 , 24 ( 2014 ).
- International Human Epigenome Consortium . http://ihec-epigenomes.org/ .
- International Human Epigenome Consortium , StunnenbergHG , HirstM . The International Human Epigenome Consortium: a blueprint for scientific collaboration and discovery . Cell167 ( 7 ), 1145 – 1149 ( 2016 ).
- International Human Epigenome Consortium Team Japan . http://crest-ihec.jp/english/index.html .
- Fasano M , TheiseND , NalesnikMet al. Immunohistochemical evaluation of hepatoblastomas with use of the hepatocyte-specific marker, hepatocyte paraffin 1, and the polyclonal anti-carcinoembryonic antigen . Mod. Pathol.11 ( 10 ), 934 – 938 ( 1998 ).
- Maslak E , GregoriusA , ChlopickiS . Liver sinusoidal endothelial cells (LSECs) function and NAFLD; NO-based therapy targeted to the liver . Pharmacol. Rep.67 ( 4 ), 689 – 694 ( 2015 ).
- Marcos R , Correia-GomesC . Long live the liver: immunohistochemical and stereological study of hepatocytes, liver sinusoidal endothelial cells, Kupffer cells and hepatic stellate cells of male and female rats throughout ageing . Cell Tissue Res.366 ( 3 ), 639 – 649 ( 2016 ).
- Kudryavtsev BN , KudryavtsevaMV , SakutaGA , SteinGI . Human hepatocyte polyploidization kinetics in the course of life cycle . Virchows Arch. B Cell Pathol.64 ( 6 ), 387 – 393 ( 1993 ).
- Nishiyama N , AraiE , NagashioRet al. Copy number alterations in urothelial carcinomas: their clinicopathological significance and correlation with DNA methylation alterations . Carcinogenesis32 ( 4 ), 462 – 469 ( 2011 ).
- Miura F , EnomotoY , DairikiR , ItoT . Amplification-free whole-genome bisulfite sequencing by post-bisulfite adaptor tagging . Nucleic Acids Res.40 ( 17 ), e136 ( 2012 ).
- Post-bisulfite adaptor tagging protocol revision 12 . http://crest-ihec.jp/english/epigenome/index.html .
- BMap . http://itolab.med.kyushu-u.ac.jp/BMap/ .
- Reference epigenome criteria of International Human Epigenome Consortium . http://ihec-epigenomes.org/research/reference-epigenome-standards/ .
- National Bioscience Database Center . http://humandbs.biosciencedbc.jp/en/ .
- International Human Epigenome Consortium Data Portal . http://epigenomesportal.ca/ihec/ .
- Takeshima H , YamashitaS , ShimazuT , NiwaT , UshijimaT . The presence of RNA polymerase II, active or stalled, predicts epigenetic fate of promoter CpG islands . Genome Res.19 ( 11 ), 1974 – 1982 ( 2009 ).
- Kimura H . Histone modifications for human epigenome analysis . J. Hum. Genet.58 ( 7 ), 439 – 445 ( 2013 ).
- Zhang Y , LiuT , MeyerCAet al. Model-based analysis of ChIP-Seq (MACS) . Genome Biol.9 ( 9 ), R137 ( 2008 ).
- Model-based analysis for ChIP-Seq . http://liulab.dfci.harvard.edu/MACS/ .
- Ernst J , KellisM . ChromHMM: automating chromatin-state discovery and characterization . Nat. Methods9 ( 3 ), 215 – 216 ( 2012 ).
- ChromHMM: chromatin state discovery and characterization . http://compbio.mit.edu/ChromHMM/ .
- NCBI Reference Sequence Database . www.ncbi.nlm.nih.gov/refseq/ .
- Ensembl Asia . http://asia.ensembl.org/Homo_sapiens/Info/Index?redirect=no .
- Long noncording RNA catalog . www.broadinstitute.org/genome_bio/human_lincrnas/?q=lincRNA_catalog .
- Bowtie . http://bowtie-bio.sourceforge.net/index.shtml .
- Totoki Y , YoshidaA , HosodaFet al. Unique mutation portraits and frequent COL2A1 gene alteration in chondrosarcoma . Genome Res.24 ( 9 ), 1411 – 1420 ( 2014 ).
- Burrows–Wheeler Aligner . http://bio-bwa.sourceforge.net/ .
- Li H , HandsakerB , WysokerAet al. The Sequence Alignment/Map format and SAMtools . Bioinformatics25 ( 16 ), 2078 – 2079 ( 2009 ).
- SAMtools . http://samtools.sourceforge.net/ .
- Totoki Y , TatsunoK , YamamotoSet al. High-resolution characterization of a hepatocellular carcinoma genome . Nat. Genet.43 ( 5 ), 464 – 469 ( 2011 ).
- Abyzov A , UrbanAE , SnyderM , GersteinM . CNVnator: an approach to discover, genotype, and characterize typical and atypical CNVs from family and population genome sequencing . Genome Res.21 ( 6 ), 974 – 984 ( 2011 ).
- CNVnator . http://sv.gersteinlab.org/cnvnator/ .
- Clarivate Analytics . www.genego.com .
- Lister R , O’MalleyRC , Tonti-FilippiniJet al. Highly integrated single-base resolution maps of the epigenome in Arabidopsis . Cell133 ( 3 ), 523 – 536 ( 2008 ).
- Bibikova M , LeJ , BarnesBet al. Genome-wide DNA methylation profiling using Infinium® assay . Epigenomics1 ( 1 ), 177 – 200 ( 2009 ).
- UCSC Genome Browser . https://genome.ucsc.edu/ .
- Methylome data for Roadmap liver tissue . www.ncbi.nlm.nih.gov/geo/query/acc.cgi?acc=GSM916049 .
- Methylome data for Encode purified hepatocyte . www.ncbi.nlm.nih.gov/geo/query/acc.cgi?acc=GSM683764 .
- Methylome data for Encode purified hepatocyte . www.ncbi.nlm.nih.gov/geo/query/acc.cgi?acc=GSM683872 .
- ChIP-seq data for hepatocyte sample . ftp://ftp.ncbi.nlm.nih.gov/geo/samples/GSM1112nnn/GSM1112808/suppl/GSM1112808%5FBI.Adult%5FLiver.H3K27ac.3.bed.gz .
- ChIP-seq data for hepatocyte sample . ftp://ftp.ncbi.nlm.nih.gov/geo/samples/GSM1112nnn/GSM1112809/suppl/GSM1112809%5FBI.Adult%5FLiver.H3K27ac.4.bed.gz .
- LChIP-seq data for hepatocyte sample . ftp://ftp.ncbi.nlm.nih.gov/geo/samples/GSM1112nnn/GSM1112814/suppl/GSM1112814%5FBI.Adult%5FLiver.H3K27me3.4.bed.gz .
- Ernst J , KheradpourP , MikkelsenTSet al. Mapping and analysis of chromatin state dynamics in nine human cell types . Nature473 ( 7345 ), 43 – 49 ( 2011 ).
- Integrative Disease Omics Database . http://gemdbj.ncc.go.jp/omics/ .
- Bahde R , KapoorS , ViswanathanP , SpiegelHU , GuptaS . Endothelin-1 receptor A blocker darusentan decreases hepatic changes and improves liver repopulation after cell transplantation in rats . Hepatology59 ( 3 ), 1107 – 1117 ( 2014 ).
- Lu JW , LiaoCY , YangWYet al. Overexpression of endothelin 1 triggers hepatocarcinogenesis in zebrafish and promotes cell proliferation and migration through the AKT pathway . PLoS ONE9 ( 1 ), e85318 ( 2014 ).
- Dou L , MengX , SuiXet al. MiR-19a regulates PTEN expression to mediate glycogen synthesis in hepatocytes . Sci. Rep.5 , 11602 ( 2015 ).
- Sun CK , ManK , NgKTet al. Proline-rich tyrosine kinase 2 (Pyk2) promotes proliferation and invasiveness of hepatocellular carcinoma cells through c-Src/ERK activation . Carcinogenesis29 ( 11 ), 2096 – 2105 ( 2008 ).
- Bouchard MJ , WangL , SchneiderRJ . Activation of focal adhesion kinase by hepatitis B virus HBx protein: multiple functions in viral replication . J. Virol.80 ( 9 ), 4406 – 4414 ( 2006 ).
- Roadmap database . www.ncbi.nlm.nih.gov/epigenomics .
- Lister R , PelizzolaM , DowenRHet al. Human DNA methylomes at base resolution show widespread epigenomic differences . Nature462 ( 7271 ), 315 – 322 ( 2009 ).
- Schultz MD , HeY , WhitakerJWet al. Human body epigenome maps reveal noncanonical DNA methylation variation . Nature523 ( 7559 ), 212 – 216 ( 2015 ).
- Fischle W , MootzHD , SchwarzerD . Synthetic histone code . Curr. Opin. Chem. Biol.28 , 131 – 140 ( 2015 ).
- Yang Y , LiuR , QiuRet al. CRL4B promotes tumorigenesis by coordinating with SUV39H1/HP1/DNMT3A in DNA methylation-based epigenetic silencing . Oncogene34 ( 1 ), 104 – 118 ( 2015 ).
- Bittencourt D , LeeBH , GaoL , GerkeDS , StallcupMR . Role of distinct surfaces of the G9a ankyrin repeat domain in histone and DNA methylation during embryonic stem cell self-renewal and differentiation . Epigenetics Chromatin7 , 27 ( 2014 ).
- Sonoda I , ImotoI , InoueJet al. Frequent silencing of low density lipoprotein receptor-related protein 1B (LRP1B) expression by genetic and epigenetic mechanisms in esophageal squamous cell carcinoma . Cancer Res.64 ( 11 ), 3741 – 3747 ( 2004 ).
- Chen H , SuzukiM , NakamuraYet al. Aberrant methylation of RASGRF2 and RASSF1A in human non-small cell lung cancer . Oncol. Rep.15 ( 5 ), 1281 – 1285 ( 2006 ).
- Carvalho R , KayademirT , SoaresPet al. Loss of heterozygosity and promoter methylation, but not mutation, may underlie loss of TFF1 in gastric carcinoma . Lab. Invest.82 ( 10 ), 1319 – 1326 ( 2002 ).
- Arai E , GotohM , TianYet al. Alterations of the spindle checkpoint pathway in clinicopathologically aggressive CpG island methylator phenotype clear cell renal cell carcinomas . Int. J. Cancer137 ( 11 ), 2589 – 2606 ( 2015 ).
- Gaudet F , HodgsonJG , EdenAet al. Induction of tumors in mice by genomic hypomethylation . Science300 ( 5618 ), 489 – 492 ( 2003 ).
- Integrative Japanese Genome Variation Database . https://ijgvd.megabank.tohoku.ac.jp .
- Shi J , MarconettCNet al. Characterizing the genetic basis of methylome diversity in histologically normal human lung tissue . Nat. Commun.5 , 3365 ( 2014 ).
- Volkov P , OlssonAHet al. A genome-wide mQTL analysis in human adipose tissue identifies genetic variants associated with DNA methylation, gene expression and metabolic traits . PLoS ONE11 ( 6 ), e0157776 ( 2016 ).
- Grundberg E , MeduriEet al. Global analysis of DNA methylation variation in adipose tissue from twins reveals links to disease-associated variants in distal regulatory elements . Am. J. Hum. Genet.93 ( 5 ), 876 – 890 ( 2013 ).