
Abstract
Aim: To develop a web tool for survival analysis based on CpG methylation patterns. Materials & methods: We utilized methylome data from ‘The Cancer Genome Atlas’ and used the Cox proportional-hazards model to develop an interactive web interface for survival analysis. Results: MethSurv enables survival analysis for a CpG located in or around the proximity of a query gene. For further mining, cluster analysis for a query gene to associate methylation patterns with clinical characteristics and browsing of top biomarkers for each cancer type are provided. MethSurv includes 7358 methylomes from 25 different human cancers. Conclusion: The MethSurv tool is a valuable platform for the researchers without programming skills to perform the initial assessment of methylation-based cancer biomarkers.
Background
DNA methylation is the most studied epigenetic modification which is crucial for facilitating vital biological processes such as embryonic development, genomic imprinting and X-chromosome inactivation [Citation1]. Aberrant DNA methylation may lead to changes in cellular micro-environment, affect the gene expression pattern and ultimately result in various pathological conditions including carcinogenesis [Citation2,Citation3]. During the recent decades, tremendous efforts have been made by several research groups to assess the applicability of DNA methylation changes in cancer diagnosis, prognosis and therapy management [Citation4]. Some success stories include the MGMT promoter methylation marker which predicts response to alkylating chemotherapy in glioblastoma multiforme [Citation5] and the FHIT methylation marker associated with poor prognosis of esophageal cancer [Citation6].
Several recently developed high-throughput techniques facilitate genome-wide DNA methylation profiling. The Illumina Infinium HumanMethylation450 (HM450K) bead array [Citation7] has been a popular choice during the recent years and therefore dominates in cancer methylome datasets [Citation8]. Various cancer genomics consortia, including ‘The Cancer Genome Atlas’ (TCGA) provide a wealth of methylation data from several tumor tissues profiled using the HM450K array. However, analyzing the raw data from such consortia is a labor-intensive and time-consuming process that requires specific bioinformatics skills. Multiple public resources such as Wanderer [Citation9], METHHC [Citation10] and MEXPRESS [Citation11] provide a simple user interface to explore the relationship between methylation and gene expression data originating from TCGA. Additionally, tools to perform survival analysis using gene expression data from TCGA are also available to the research community [Citation12–Citation20]. However, there are no tools to facilitate the evaluation of the prognostic properties of CpG methylation data. Therefore, the aim of the current paper is to provide a dedicated web tool “MethSurv” to associate overall survival (defined as the time from the first day of cancer diagnosis until the day of death by any cause) with DNA methylation levels.
MethSurv is intended for researchers and clinicians without specific bioinformatics skills for exploring methylation biomarkers that correlate with the survival of various human cancers. MethSurv is freely available at https://biit.cs.ut.ee/methsurv.
Methods
TCGA data
We downloaded processed methylation data (level 3 data, HM450K) from TCGA GDAC Firehose (http://gdac.broadinstitute.org/). We matched the downloaded methylation data with the clinical data which include survival status, patient characteristics (age, sex, height, weight, race, etc.) and clinicopathologic features such as stage and grade of the cancer, etc. using the Biotab utility of TCGA. All the data used in MethSurv were downloaded during the period from January to March 2017. DNA methylation status was represented as β-values (ranging from 0 to 1). The β-values are derived from methylated and unmethylated probe intensities, using the formula M/(M + U + 100). Here M and U are fully methylated and fully unmethylated intensities, respectively [Citation7].
Survival analysis
MethSurv performs univariable and multivariable survival analysis based on patient methylation levels for any CpG site (probe) using Cox proportional-hazards models. In the univariable analysis, survival analysis was performed with probe methylation levels as explanatory variable and survival time as the response variable. In multivariable analysis, in addition to methylation status, clinical covariates such as age, sex, stage, etc., can be used. To assess differences in survival, methylation levels of patients were dichotomized into higher (the methylation β value higher than the cut-off point) and lower groups (the methylation β value lower than the cut-off point). The cut-off point for the dichotomization can be computed based on mean or data quantiles. For further evaluation of all possible cut-off points in the continuous methylation data, ‘Maximally Selected Rank Statistics’ (maxstat) method [Citation21] was used. The details of this method are described by Hothorn and Lausen [Citation21,Citation22]. Briefly, this method assesses all of the data points from the continuous methylation data and establishes a cut-off point where the standardized statistics take their maximum significance of the separation of patient groups. Hazard ratio (HR) with 95% CI is derived from Cox fitting. The goodness of the Cox model fit can be assessed using likelihood-ratio (LR) test and Wald test. The assumption of Cox proportionality is tested using proportional hazards assumption test. The ‘best’ cut-off point option in MethSurv runs all of the above mentioned dichotomization methods (mean, median, higher and lower quantiles and maxstat) and outputs the cut-off point where the HR is highest. The difference in survival between lower and higher methylated groups of patients is visualized by Kaplan–Meier (KM) plots. To compute top biomarkers for each cancer type, methylome-wide survival analysis was performed accounting for multiple testing correction adjusted for false discovery rate (FDR).
Annotation of the CpGs
MethSurv utilizes TCGA methylation data profiled using HM450K array which covers 486,428 CpGs, in other words, about 99% of RefSeq genes and 96% of CpG islands (CGI) from UCSC database [Citation7]. The CpG sites were annotated to genomic regions according to the annotation file (Human genome build 37) provided by Illumina. Association(s) of CpG sites with gene sub-regions or CGI were used as described in detail by Bibikova et al. [Citation7]. Briefly, there were two major classifications in the annotation. First, in relation to CGI including ‘shores’ (0–2 kb from CGI), ‘shelves’ (2–4 kb from CGI) and ‘open sea’ (remaining regions). Second, in relation to gene subregions including TSS200 (region from the transcription start site [TSS] to -200 nucleotides upstream of TSS), TSS1500 (covering -200 to -1500 nucleotides upstream of TSS), first exon, 5′UTR, body and 3′UTR. For instance, one CpG site can be annotated to multiple regions of a gene due to alternative TSSs. Henceforth, no additional annotation was performed.
Clustering analysis
MethSurv computes unsupervised hierarchical clustering and principal component analysis (PCA) for any particular gene to provide a visual overview of methylation differences between the cancer patients as well as gene subregions. The default clustering option utilizes average linkage method using correlation distance (correlation subtracted from 1). Seamless integration of MethSurv with ClustVis [Citation23] provides additional linkage methods which includes complete, McQuitty, median, centroid and Ward linkage. Also, additional distance metrics including Euclidean, maximum, Manhattan and Canberra can be explored. For PCA calculations, singular value decomposition, NIPALS PCA and probabilistic PCA can be used in ClustVis.
Implementation of the web interface
MethSurv is implemented with Shiny web application framework using R programming environment [Citation24]. Survival analysis was performed using the ‘survival’ package, [Citation25] and ‘survminer package’ [Citation26] was used to implement optimal cut-off point determined by maxstat method. We used the ‘pheatmap’ package [Citation27] for plotting the heat map in the ‘gene visualization’ view.
Results
Construction of the web tool
For the selection of most informative datasets to be included in the web tool, the following selection criteria were used: the dataset should contain at least 50 cancer patients; the dataset should contain >10% deaths.
A total of 25 different cancer datasets including 7358 methylomes passed our selection criteria. Since age, sex and BMI are associated with both methylation changes [Citation28–Citation30] and cancer progression [Citation31–Citation34], these were used as covariates in the multivariable prediction models. In addition, we also considered all potentially relevant cancer specific features including cancer stage, grade and HER2, estrogen receptor (ER) and progesterone receptor (PR) status by immunohistochemistry for breast cancer and pathologically determined lymph node metastasis status for uveal melanoma as covariates (Supplementary Table 1). Due to missing or lacking available clinical data, the number of covariates are limited for several cancer types. For instance, height and weight information necessary for calculating BMI is not available for TCGA acute myeloid leukemia (AML) samples. On the other hand, HER2, ER and PR status data are exclusive to TCGA breast cancer samples presented in MethSurv.
User interface
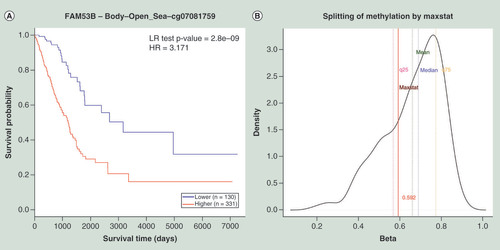
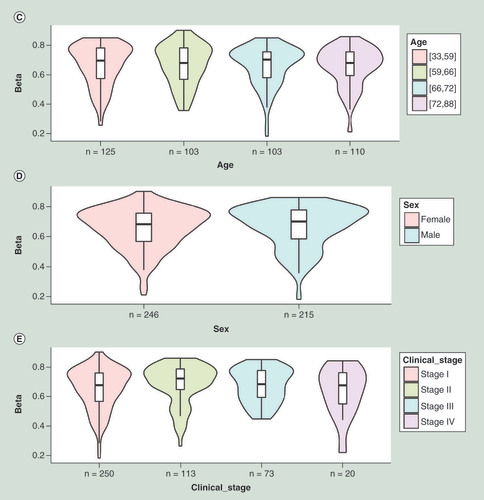
MethSurv strives to provide an intuitive user interface where the analysis results are produced within seconds. The schematic representation of MethSurv user interface and its components are shown in . MethSurv enables cancer survival prediction for single CpG sites (‘Single CpG’ analysis tab) using any of the available genes (official gene symbol) in the TCGA HM450K cancer methylome datasets. Although single CpG methylation patterns might be a potential biomarker for cancer risk assessment [Citation35], it has also been suggested that different genomic regions can be associated with differential survival prognosis [Citation36]. Moreover, several recently published web tools emphasize the need for analyzing DNA methylation data based on sub-regions [Citation9,Citation10]. Therefore, we provide the users with a detailed overview of individual CpG sites with the options to select genomic regions (relative to CGI and gene sub-region), methods to establish cut-off points for dichotomizing higher and lower methylation patient groups (mean, median, lower quantile, upper quantile and maxstat) and adjustment type. As a result, KM plots along with a comprehensive table containing all the relevant statistics from the analysis (HR with 95% CI, proportional hazard assumption test p-value, Wald test p-value, LR test p-value, mean, median and range of methylation β-values) is generated. The HR and the LR test p-value are included in the KM plot (). The KM plot can be exported in high quality png/pdf formats. Additionally, a distribution plot highlighting the cut-off points used for dichotomizing patient methylation levels can be visualized using a density plot within the analysis page (). Further, violin plots are displayed to visualize the distribution, median and interquartile range of methylation profiles of the query CpG site in relation to patient characteristics such as age (), sex (), clinical stage (), etc. We also provide a link to external browsers including ‘GeneCards’ [Citation37], ‘COSMIC’ [Citation38] and ‘Gene Ontology’ [Citation39] to explore additional information related to the query gene.
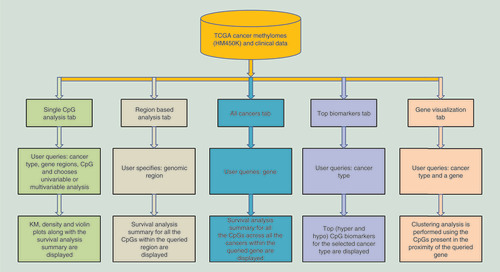
(A) Kaplan–Meier plot showing survival in higher (β > 0.59; shown in red) and lower (β < 0.59; shown in blue) methylation groups dichotomized by maxstat method. The X-axis denotes survival time in days and the Y-axis denotes the probability of patient survival. (B) Density plot, highlighting all the cut-off points evaluated in MethSurv. Different cut-off points are represented by colored texts and the number in red denote the currently used cut-off point to group the patients. (C) Violin plots showing the methylation levels among different age groups. Continuous age data are binned into quantiles for the visualization. (D) Violin plots showing the methylation levels among female and male samples. (E) Violin plots showing the methylation levels among stage I, II, III and IV LUAD samples. A boxplot within each violin plot summarizes the interquartile range and median methylation levels (show by a thick black line). The X-axis denotes the patient category, while the Y-axis denotes the methylation β-values (ranging from 0 to 1).
HR: Hazard ratio; LR: Log-likelihood ratio; LUAD: Lung adenocarcinoma; q25: Upper quantile; q75: Lower quantile.
The user can retrieve the summary of survival analysis results for one or more CpGs available in the user selected genomic region for any particular cancer type using ‘Region-based’ analysis tab. Further, the user can search for a gene of interest to explore a summary of the survival statistics of all the available CpGs within a gene across one or more cancer types using the ‘All cancers’ tab. Thus, the consolidated view generated by ‘All cancers tab’ and ‘Region-based’ analysis tab enables a straightforward way to explore which CpG(s) from the selected gene or genomic region has the best properties for predicting cancer survival.
Next, we provide top survival biomarkers (according to the HRs and significant p-values) for the user selected cancer type to facilitate simultaneous testing of all the CpG markers from the whole genome. Similar to the ‘All cancers’ tab and ‘Region-based’ analysis tab, we provide all the statistical details and FDR corrected P-values in the ‘Top biomarkers’ tab. KM plots can be plotted interactively from any of the chosen CpG in the ‘All cancers’ tab, ‘Region-based’ analysis tab and the ‘Top biomarkers’ tab.
The ‘Gene visualization’ tab allows clustering analysis of individual CpGs within a query gene in the form of a heat map for any of the chosen cancer. This enables the users to associate methylation levels with the available patient characteristics and gene subregions visually. Advanced clustering visualization in the form of a heat map () and PCA () can be obtained by clicking the ‘Browse in ClustVis’ link which redirects to ClustiVis web tool [Citation23]. Analysis using ClustVis gives the users several options such as exploration with different clustering choices for heat map and selection of different methods for computing principal components. By using ClustVis, the user can choose which of the annotations (gene sub-regions and patient characteristics) to use for the clustering analysis.
(A) Heat map depicting clustering of the CpG methylation levels within FAM53B gene calculated using the average linkage method with correlation distance. Methylation levels (1 = fully methylated; 0 = fully unmethylated) are shown as a continuous variable from a blue to red color. Rows correspond to the CpGs and the columns correspond to the patients. (B) PCA plot of LUAD patients showing the methylation levels for the gene FAM53B. The patients who are alive are shown in red and the deceased ones are shown in blue. Patient age groups are represented by different shapes. X-axis denotes PC1 (30.8% variability) and Y-axis denotes PC2 (16.5% variability), respectively. Heat map and PCA plots are generated using seamless integration with ClustVis [Citation23].
LUAD: Lung adenocarcinoma; PCA: Principal component analysis; PC1: Principal component 1; PC2: Principal component 2.
![Figure 3. Clustering analysis of the CpGs within the proximity of FAM53B in lung adenocarcinoma samples using the ‘gene visualization’ module of MethSurv. (A) Heat map depicting clustering of the CpG methylation levels within FAM53B gene calculated using the average linkage method with correlation distance. Methylation levels (1 = fully methylated; 0 = fully unmethylated) are shown as a continuous variable from a blue to red color. Rows correspond to the CpGs and the columns correspond to the patients. (B) PCA plot of LUAD patients showing the methylation levels for the gene FAM53B. The patients who are alive are shown in red and the deceased ones are shown in blue. Patient age groups are represented by different shapes. X-axis denotes PC1 (30.8% variability) and Y-axis denotes PC2 (16.5% variability), respectively. Heat map and PCA plots are generated using seamless integration with ClustVis [Citation23].LUAD: Lung adenocarcinoma; PCA: Principal component analysis; PC1: Principal component 1; PC2: Principal component 2.](/cms/asset/7b49e26c-ecc3-4a9a-a26f-e604fba7bbd2/iepi_a_12323822_f0004.jpg)
Case studies
To assess the performance of MethSurv, we compared previously published studies which implicate prognostic relevance of DNA methylation in cancer survival.
PTPRO promoter hyper methylation associated with a poorer survival rate for breast cancer
The tumor suppressor properties of PTPRO gene have been evaluated across various cancer types such as esophageal carcinoma [Citation40] and breast cancer [Citation41]. A study by Li et al. [Citation42] included 98 primary breast tumor samples (not included in the TCGA database) from Shenzhen Maternal and Child Health Hospital showed that PTPRO promoter hyper methylation is associated with poorer overall survival (HR = 2.7; 95% CI: 1.1–6.2; p = 0.023). This effect can be observed in MethSurv using TCGA data (number of patients = 782). As illustrated in , the hyper methylation of the CpG cg22374861, located in the TSS200 region of PTPRO resulted in poorer overall survival rate in TCGA breast cancer patients (HR = 1.8; 95% CI: 1.2–2.7; p = 0.0054).
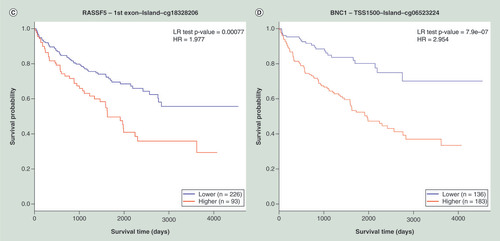
(A) KM plot for cg22374861-PTPRO using breast cancer samples dichotomized by mean methylation (cut-off = 0.17). (B) KM plot for cg08799922-C1R using acute myeloid leukemia samples dichotomized by maxstat method (cut-off = 0.35). (C) KM plot for cg18328206-RASSF5 using KIRC samples dichotomized by maxstat (cut-off = 0.07). (D) KM plot for cg06523224-BNC1 using KIRC samples dichotomized by maxstat (cut-off = 0.14). The X-axis denotes survival time in days, and the Y-axis indicates the probability of patient survival. The red and blue lines indicate higher (β > cut-off) and lower (β < cut-off) methylation patient groups, respectively, dichotomized according to best cut-off point in MethSurv.
HR: Hazard ratio; KIRC: Kidney renal clear cell carcinoma; KM: Kaplan–Meier; LR: Log-likelihood ratio; Maxstat: Maximally selected rank statistics.
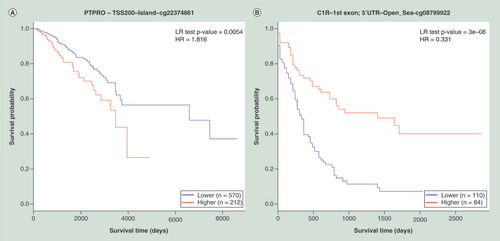
Prognostic relevance of C1R hyper methylation in AML
We compared the results for AML from MethSurv with those from Božić et al. [Citation35] who also used the same TCGA methylome samples (number of patients = 194) as the current version of MethSurv. It was shown by Božić et al. [Citation35] that a single CpG cg08799922 annotated to the gene C1R, showed the most significant association (p < 0.001) with overall patient survival rate. The methylation status for the same CpG was also validated using pyrosequencing by Božić et al. with an independent dataset containing 84 AML patients (p = 0.012). Using the analysis by MethSurv, the same CpG (cg08799922) (HR = 0.3; 95% CI: 0.2–0.5; p = 3e-08) was identified as one of the best survival marker for AML ().
Hyper methylation of tumor-specific genes related to a poor survival rate in kidney renal clear cell carcinoma
Ricketts et al. [Citation43] utilized methylome data from the published TCGA kidney renal clear cell carcinoma project [Citation44] to evaluate the prognostic relevance of known methylation-based biomarkers compiled from a review article by Morris and Maher [Citation45]. We compared the analysis results from Ricketts et al. (number of patients = 160) with MethSurv (number of patients = 314) profiled using the HM450K array. Several biomarker candidates suggested by Ricketts et al. showed a good level of correlation with MethSurv analysis using TCGA data (data not shown). Some examples include promoter hyper methylation of the gene RASSF5 (cg18328206) (HR = 2.3; CI: 0.9–5.9; p = 0.0060) and BNC1 (cg06523224) (HR = 2.1; CI : 1.0–4.2; p = 0.0042) associated with a poor survival rate. & D shows the comparison results for the CpGs cg18328206 (HR = 1.9; CI: 1.3–2.9; p = 0.00077) and cg06523224 (HR = 2.9; CI: 1.8–4.7; p = 7.9e-07), respectively, using MethSurv. The prognostic properties of these biomarkers have also been evaluated by a recent meta-analysis study by Joosten et al. [Citation46].
Thus, in each of the case studies we performed, the analysis results showed a good corroboration with our tool, validating the approach used in MethSurv, thereby indicating a good level of comparability and reproducibility.
Discussion
The current paper presents a web tool that associates overall cancer survival with DNA methylation levels across a large body of TCGA data and many cancers. Our tool enables cancer biologists and clinicians to evaluate biomarker candidates without prior computational programming skills and generate hypotheses related to cancer biomarkers based on associations between methylation levels and patient survival.
TCGA provides the largest collection of cancer survival data along with multi-omics data including DNA methylation data. Such a rich collection of data gathered from a large number of patients have a great potential to be used in robust statistical analyses, thereby enabling improved survival prediction. Therefore, several studies [Citation35,Citation36,Citation43,Citation47–Citation50] rely on TCGA as a complementary resource for biomarker assessment. We believe that MethSurv will be a promising tool for similar studies to explore methylation-based biomarkers and to perform in silico validation as illustrated in the case studies section. However, it must be borne in mind that the prognostic biomarker candidates suggested by MethSurv will require further investigation to verify their clinical relevance.
Most commonly used statistical methods to determine the cut-off point for dichotomizing the patients include data oriented method (based on mean or certain quantiles) and outcome oriented method (according to the survival estimates) [Citation51]. The choice of a method to determine the cut-off point often depends on study design or the nature of the data [Citation51]. Therefore, we provided the users with the opportunity to explore both of the aforementioned methods for patient stratification. Additional features included in the MethSurv user interface such as the ‘All cancers’ tab provide a comprehensive view of survival summary for all the cancers across the same gene facilitating comparative assessment of biomarkers across multiple cancers. The ‘Region-based’ analysis tab enables to retrieve the survival analysis summary for all CpGs within the user-defined genomic region. The ‘top biomarkers’ tab on the other hand provide a straightforward access to the CpGs with the best prognostic characteristics across each cancer type.
Some limitations of our tool should be highlighted. MethSurv performs survival analysis for methylation data profiled exclusively using HM450K array and is currently limited to overall survival analysis as other survival-related information such as metastasis-free survival and disease-free survival is not available for most of the cancer datasets. These short comes will be considered for the future version of MethSurv, as appropriate data become available from TCGA or other publicly available data repositories.
Conclusion
As the amount of cancer methylome data constantly grows, bioinformatics tools that ease information extraction and visualization are needed. To the best of our knowledge, MethSurv is the first web tool for assessing the prognostic potential of DNA methylation biomarker candidates using multivariable survival analysis. We believe that our tool will be an invaluable resource for the scientific community working in cancer biomarker assessment. MethSurv will be continuously maintained and updated to embrace the new methylation data available from TCGA.
The Cancer Genome Atlas offers a plethora of multidimensional omics data, including data on DNA methylation patterns in multiple cancer types. However, computational challenges remain a bottleneck in evaluating prognostic properties of DNA methylation markers in cancer.
We introduce a web tool called MethSurv, which enables interactive survival analysis based on CpG methylation patterns from the large collection of ‘The Cancer Genome Atlas’ data.
Using MethSurv, univariable and multivariable Cox regression analysis can be performed according to the user’s choice of the cancer type, gene, genomic region and CpG site. Kaplan–Meier plots with the relevant statistical summaries are provided as a result.
Additionally, top survival biomarkers for each cancer can be identified and interactively browsed.
We also provide clustering analysis for all the CpG sites around a gene of interest to associate the DNA methylation patterns with the patient characteristics and gene sub-regions.
We provided few examples comparing MethSurv results with previously published methylation markers for breast cancer, acute myeloid leukemia and kidney renal cell carcinoma which showed a good level of comparability and reproducibility.
In conclusion, we created a user-friendly and intuitive web tool aiding clinicians and cancer biologists to perform exploratory DNA methylation survival analysis for selected cancer types without the need to install any specialized software.
We believe that MethSurv will be a valuable resource for initial assessment of methylation-based cancer biomarkers. MethSurv is freely available at https://biit.cs.ut.ee/methsurv.
Supplemental application 1
Download MS Excel (41.4 KB)Acknowledgements
The authors would like to thank I Kuzmin and the high-performance computing team of the University of Tartu for their kind assistance to address the technical issues. We also thank S Kasela for her constructive feedback on statistical matters. We thank TCGA research network (http://cancergenome.nih.gov) for making their data publicly available. MethSurv performs survival analysis based on TCGA data.
Supplementary data
To view the supplementary data that accompany this paper please visit the journal website at: www.tandfonline.com/doi/full/10.2217/epi-2017-0118
Financial & competing interests disclosure
The research was funded by the European Commission Horizon 2020 research and innovation programme under grant agreement 692065 (project WIDENLIFE), and has also been supported by grant IUT34-16 and IUT34-4 from the Estonian Research Council and ERDF through EXCITE Center of Excellence. The authors have no other relevant affiliations or financial involvement with any organization or entity with a financial interest in or financial conflict with the subject matter or materials discussed in the manuscript apart from those disclosed.
No writing assistance was utilized in the production of this manuscript.
Additional information
Funding
References
- Lund AH , van LohuizenM . Epigenetics and cancer . Genes Dev.18 ( 19 ), 2315 – 2335 ( 2004 ).
- Portela A , EstellerM . Epigenetic modifications and human disease . Nat. Biotechnol.28 ( 10 ), 1057 – 1068 ( 2010 ).
- Kelly TK , De CarvalhoDD , JonesPA . Epigenetic modifications as therapeutic targets . Nat. Biotechnol.28 ( 10 ), 1069 – 1078 ( 2010 ).
- Laird PW . The power and the promise of DNA methylation markers . Nat. Rev. Cancer3 , 253 – 266 ( 2003 ).
- Hegi ME , DiserensA-C , GorliaTet al. MGMT gene silencing and benefit from temozolomide in glioblastoma . N. Engl. J. Med.352 ( 10 ), 997 – 1003 ( 2005 ).
- Lee EJ , LeeBB , KimJWet al. Aberrant methylation of fragile histidine triad gene is associated with poor prognosis in early stage esophageal squamous cell carcinoma . Eur. J. Cancer42 ( 7 ), 972 – 980 ( 2006 ).
- Bibikova M , BarnesB , TsanCet al. High density DNA methylation array with single CpG site resolution . Genomics98 ( 4 ), 288 – 295 ( 2011 ).
- Stirzaker C , TaberlayPC , StathamAL , ClarkSJ . Mining cancer methylomes: prospects and challenges . Trends Genet.30 ( 2 ), 75 – 84 ( 2014 ).
- Díez-Villanueva A , MallonaI , PeinadoMA . Wanderer an interactive viewer to explore DNA methylation and gene expression data in human cancer . Epigenetics Chromatin8 ( 1 ), 22 ( 2015 ).
- Huang W-Y , HsuS-D , HuangH-Yet al. MethHC: a database of DNA methylation and gene expression in human cancer . Nucleic Acids Res.43 , 856 – 861 ( 2015 ).
- Koch A , De MeyerT , JeschkeJ , Van CriekingeW . MEXPRESS: visualizing expression, DNA methylation and clinical TCGA data . BMC Genomics16 ( 1 ), 636 ( 2015 ).
- Szász AM , LánczkyA , NagyÁet al. Cross-validation of survival associated biomarkers in gastric cancer using transcriptomic data of 1,065 patients . Oncotarget7 ( 31 ), 49322 – 49333 ( 2016 ).
- Aguirre-Gamboa R , Gomez-RuedaH , Martínez-LedesmaEet al. SurvExpress: an online biomarker validation tool and database for cancer gene expression data using survival analysis . PLoS ONE8 ( 9 ), e74250 ( 2013 ).
- Aguirre-Gamboa R , TrevinoV . SurvMicro: assessment of miRNA-based prognostic signatures for cancer clinical outcomes by multivariate survival analysis . Bioinformatics30 ( 11 ), 1630 – 1632 ( 2014 ).
- Cheng PF , DummerR , LevesqueMP . Data mining The Cancer Genome Atlas in the era of precision cancer medicine . Swiss Med. Wkly145 , 1 – 5 ( 2015 ).
- Goswami CP , NakshatriH . PROGgeneV2: enhancements on the existing database . BMC Cancer14 , 970 ( 2014 ).
- Anaya J . OncoLnc: linking TCGA survival data to mRNAs, miRNAs, and lncRNAs . PeerJ Comput. Sci.2 , e67 ( 2016 ).
- Goswami CP , NakshatriH . PROGmiR: a tool for identifying prognostic miRNA biomarkers in multiple cancers using publicly available data . J. Clin. Bioinforma2 ( 1 ), 23 ( 2012 ).
- Chandrashekar DS , BashelB , BalasubramanyaSAHet al. UALCAN: a portal for facilitating tumor subgroup gene expression and survival analyses . Neoplasia (United States)19 ( 8 ), 649 – 658 ( 2017 ).
- Li J , HanL , RoebuckPet al. TANRIC: an interactive open platform to explore the function of IncRNAs in cancer . Cancer Res.75 ( 18 ), 3728 – 3737 ( 2015 ).
- Hothorn T , LausenB . On maximally selected rank statistics . R News2 ( 1 ), 3 – 5 ( 2002 ).
- Hothorn T , LausenB . On the exact distribution of maximally selected rank statistics . Comput. Stat. Data Anal.43 , 121 – 137 ( 2003 ).
- Metsalu T , ViloJ . ClustVis: a web tool for visualizing clustering of multivariate data using Principal Component Analysis and heatmap . Nucleic Acids Res.43 ( W1 ), W566 – W570 ( 2015 ).
- R Core Team . R: a language and environment for statistical computing ( 2016 ). https://www.r-project.org/ .
- Therneau TM . A package for survival analysis in S. R package version 2.38 ( 2015 ).
- Kassambara A , KosinskiM . Survminer: drawing survival curves using ggplot2. R package version 0.2.2 ( 2016 ). https://cran.r-project.org/web/packages/survminer/survminer.pdf .
- Kolde R . pheatmap: pretty heatmaps. R package version 1.0.2 ( 2015 ). https://cran.r-project.org/web/packages/pheatmap/pheatmap.pdf .
- Bell JT , TsaiPC , YangTPet al. Epigenome-wide scans identify differentially methylated regions for age and age-related phenotypes in a healthy ageing population . PLoS Genet.8 ( 4 ), e1002629 ( 2012 ).
- El-Maarri O , BeckerT , JunenJet al. Gender specific differences in levels of DNA methylation at selected loci from human total blood: a tendency toward higher methylation levels in males . Hum. Genet.122 ( 5 ), 505 – 514 ( 2007 ).
- Dick KJ , NelsonCP , TsaprouniLet al. DNA methylation and body-mass index: a genome-wide analysis . Lancet383 ( 9933 ), 1990 – 1998 ( 2014 ).
- Carreras-Torres R , HaycockPC , ReltonCLet al. The causal relevance of body mass index in different histological types of lung cancer: a Mendelian randomization study . Sci. Rep.6 , 31121 ( 2016 ).
- White MC , HolmanDM , BoehmJE , PeipinsLA , GrossmanM , Jane HenleyS . Age and cancer risk . Am. J. Prev. Med.46 ( 3 ), S7 – S15 ( 2014 ).
- Farach-Carson MC , LinS-H , NaltyT , SatcherRL . Sex Differences and Bone Metastases of Breast, Lung, and Prostate Cancers: Do Bone Homing Cancers Favor Feminized Bone Marrow?Front. Oncol.7 , 163 ( 2017 ).
- Faruk Aykan N , YildizI , SenFet al. Effect of increased body mass index (BMI) on time to tumour progression (TTP) in unresectable metastatic colorectal cancer (mCRC) patients treated with bevacizumab-based therapy . Med Oncol.30 ( 3 ), 679 ( 2013 ).
- Božić T , LinQ , FrobelJet al. DNA-methylation in C1R is a prognostic biomarker for acute myeloid leukemia . Clin. Epigenetics.7 , 116 ( 2015 ).
- Stirzaker C , ZotenkoE , SongJZet al. Methylome sequencing in triple-negative breast cancer reveals distinct methylation clusters with prognostic value . Nat. Commun.6 , 1 – 11 ( 2015 ).
- Stelzer G , RosenN , PlaschkesIet al. The GeneCards Suite: from gene data mining to disease genome sequence analyses . Curr. Protoc. Bioinforma54 , 1.30.1 – 1.30.33 ( 2016 ).
- Forbes SA , BeareD , BindalNet al. COSMIC: high-resolution cancer genetics using the catalogue of somatic mutations in cancer . Curr. Protoc. Hum. Genet.91 , 10.11.1 – 10.11.37 ( 2016 ).
- Thomas PD . Expansion of the gene ontology knowledgebase and resources: the gene ontology consortium . Nucleic Acids Res.45 ( D1 ), D331 – D338 ( 2017 ).
- You YJ , ChenYP , ZhengXX , MeltzerSJ , ZhangH . Aberrant methylation of the PTPRO gene in peripheral blood as a potential biomarker in esophageal squamous cell carcinoma patients . Cancer Lett.315 ( 2 ), 138 – 144 ( 2012 ).
- Yu M , LinG , ArshadiNet al. Expression profiling during mammary epithelial cell three-dimensional morphogenesis identifies PTPRO as a novel regulator of morphogenesis and ErbB2-mediated transformation . Mol. Cell. Biol.32 ( 19 ), 3913 – 3924 ( 2012 ).
- Li S , LiR , ChenYet al. Aberrant PTPRO methylation in tumor tissues as a potential biomarker that predicts clinical outcomes in breast cancer patients . BMC Genet.15 ( 1 ), 67 ( 2014 ).
- Ricketts CJ , HillVK , LinehanWM . Tumor-specific hypermethylation of epigenetic biomarkers, including SFRP1, predicts for poorer survival in patients from the TCGA kidney renal clear cell carcinoma (KIRC) project . PLoS ONE9 ( 1 ), e85621 ( 2014 ).
- Creighton C , MorganM , GunaratnePet al. Comprehensive molecular characterization of clear cell renal cell carcinoma . Nature499 ( 7456 ), 43 – 49 ( 2013 ).
- Morris MR , MaherER . Epigenetics of renal cell carcinoma: the path towards new diagnostics and therapeutics . Genome Med.2 ( 9 ), 59 ( 2010 ).
- Joosten SC , DeckersIA , AartsMJet al. Prognostic DNA methylation markers for renal cell carcinoma: a systematic review . Epigenomics9 , 1243 – 1257 ( 2017 ).
- Bady P , SciuscioD , DiserensA-Cet al. MGMT methylation analysis of glioblastoma on the Infinium methylation BeadChip identifies two distinct CpG regions associated with gene silencing and outcome, yielding a prediction model for comparisons across datasets, tumor grades, and CIMP-status . Acta Neuropathol.124 ( 4 ), 547 – 560 ( 2012 ).
- Fisel P , KruckS , WinterSet al. DNA methylation of the SLC16A3 promoter regulates expression of the human lactate transporter MCT4 in renal cancer with consequences for clinical outcome . Clin Cancer Res.19 ( 18 ), 5170 – 5181 ( 2013 ).
- Wang Z-R , WeiJ-H , ZhouJ-Cet al. Validation of DAB2IP methylation and its relative significance in predicting outcome in renal cell carcinoma . Oncotarget7 ( 21 ), 31508 – 31519 ( 2016 ).
- Hao X , LuoH , KrawczykMet al. DNA methylation markers for diagnosis and prognosis of common cancers . Proc. Natl Acad. Sci. USA114 ( 28 ), 7414 – 7419 ( 2017 ).
- Mandrekar JN , MandrekarSJ . Cutpoint determination methods in survival analysis using SAS® . In : SUGI 28 Proceedings . SAS Users Group International , 261 – 228 ( 2003 ).