
Abstract
Aim: The present study investigated the link between peripheral DNA methylation (DNAm), cognitive impairment and brain aging. Methods: We tested the association between blood genome-wide DNAm profiles using the Illumina 450K arrays, cognitive dysfunction and brain MRI measures in selected participants of the Whitehall II imaging sub-study. Results: Eight differentially methylated regions were associated with cognitive impairment. Accelerated aging based on the Hannum epigenetic clock was associated with mean diffusivity and global fractional anisotropy. We also identified modules of co-methylated loci associated with white matter hyperintensities. These co-methylation modules were enriched among pathways relevant to β-amyloid processing and glutamatergic signaling. Conclusion: Our data support the notion that blood DNAm changes may have utility as a biomarker for cognitive dysfunction and brain aging.
DNA methylation (DNAm) changes have been linked with the pathophysiology of brain aging, Alzheimer’s disease (AD) and other types of dementia [Citation1,Citation2]. Considering the relative stability of DNAm and the fact that it is directly modulated by both underlying genetic sequence and environmental exposures it appears as a promising peripheral biomarker for brain-related changes [Citation3]. Peripheral changes in mRNA and proteins that are downstream of DNAm regulation further support this concept [Citation4,Citation5]. Studies have shown differences in blood DNAm when comparing AD subjects with controls [Citation6], but interestingly when looking at specific genes there is little overlap between brain and blood DNAm changes in AD [Citation7,Citation8]. However, a good peripheral biomarker does not have to mirror disease-associated changes in the brain; it could also simply represent a peripheral response to central pathology. At present, there is limited data available on the potential utility of peripheral DNAm as a marker for cognitive decline before the onset of dementia. One study of patients with Type 2 diabetes mellitus who later developed presymptomatic dementia highlighted leukocyte DNAm changes that were comparable to changes identified in blood in AD patients and could thus potentially represent early markers of dementia [Citation9]. Recently DNAm epigenetic clocks have been developed, which provide a measure of epigenetic age, based on DNAm levels at 353 CpG sites [Citation10] and 71 CpG sites [Citation11], respectively. A number of studies have utilized the epigenetic age in blood, based on the DNAm epigenetic clock, to show correlations with cognitive function, white matter hyperintensities (WMH), Parkinson’s disease, Down syndrome and all-cause mortality [Citation12–16].
Considering the limited access to brain tissue in living humans, multimodal MRI has been widely used to study brain aging in vivo. MRI measures of reduced brain volume, reduced white matter integrity and increased WMH have been linked with the risk for developing dementia [Citation17,Citation18]. As such, brain imaging changes are useful surrogate markers of brain health and aging. Here, we investigated the potential utility of DNAm profiling as a peripheral marker for cognitive decline and brain health in the Whitehall II imaging sub-study [Citation19], which provides a valuable source of longitudinal data to explore factors hypothesized to affect brain health and cognitive aging.
Materials & methods
Participants
Forty-eight participants were selected from subjects recruited to the Whitehall II imaging sub-study between May 2012 and December 2014 [Citation19]. All participants were members of the Whitehall II study, a prospective occupation cohort study established in 1985 [Citation20]. For the imaging sub-study based at the University of Oxford, a sample of participants in the 2012–2013 clinical examination was selected at random from the whole Whitehall cohort. Ethical approval was obtained from the University of Oxford Central University Research Ethics Committee, and the University College London Medical School Committee on the Ethics of Human Research. Informed written consent was obtained from all participants [Citation19].
In 2012–2016, participants of the Whitehall II imaging sub-study invited to Oxford had a clinical interview and cognitive assessment, followed by a multimodal 3T MRI scan (full details are provided in Supplementary Methods) and subsequently blood samples were taken. The detailed study protocol has been previously published elsewhere [Citation19]. We assessed cognitive impairment using the Montreal Cognitive Assessment (MoCA) [Citation21], and studied 24 cognitively impaired participants (MoCA <26), who would qualify for a clinical diagnosis of mild cognitive impairment (MCI), alongside 24 age and gender matched cognitively normal participants (MoCA >26), who were free from other comorbidities such as depression (Supplementary Table 1). A range of MRI measures were obtained, including total brain volume, left hippocampal volume (LHV), right hippocampal volume (RHV), cerebrospinal fluid volume (CSF), white matter volume (WM), gray matter volume (GM), fractional anisotropy (FA), mean diffusivity (MD) and WMH, with full details provided in the Supplementary Methods.
DNA methylation profiling
Samples (peripheral blood mononuclear cells [PBMCs]) were drawn using the Vacutainer CPT tubes (Becton Dickinson, NJ, USA). Following sample collection each tube was immediately inverted eight times to mix anticoagulant and processed within 2 h of collection. CPT tubes were centrifuged at 1600 × g for 30 min to separate serum from peripheral white blood cells and red blood cells. PBMCs were washed with phosphate buffered saline (PBS), counted, cryopreserved using Cell Freezing Medium (5% DMSO/11% human serum albumin in phosphate buffered saline) and stored at -80°C until DNA isolation took place. DNA was isolated from all samples simultaneously using the QIAamp DNA Mini Kit (Qiagen, Venlo, The Netherlands) according to the manufacturer’s protocol and tested for degradation and purity before analysis. From each sample, 500 ng of genomic DNA was bisulfite treated using the EZ-96 DNA Methylation-Gold™ Kit (Zymo Research, CA, USA) according to the manufacturer’s protocol. A total of 48 samples were processed using the Illumina Infinium Human Methylation 450 K BeadChip (HM450K; Illumina, CA, USA) according to the protocol supplied by the manufacturer. Intensity values generated by the Illumina iScanner were imported into R statistical software v3.3.2 using the ‘readEPIC’ function in the Bioconductor package wateRmelon v1.18 [Citation22]. Data quality control and normalization were conducted using the methylumi [Citation23], wateRmelon [Citation22] and minfi [Citation24] R packages according to the pipeline previously described [Citation7]. After the quality control steps, one sample was dropped from the analysis due to possessing an XXY genotype.
Statistical analyses
A linear regression model was conducted to identify differentially methylated positions (DMPs) associated with cognition, while controlling for covariates. We used the MoCA [Citation21] to determine cognitive impairment (full details provided in Supplementary Methods). Cellular composition of peripheral blood cells was measured using an online calculator (https://dnamage.genetics.ucla.edu), and included in the model as a covariate together with gender, age and processing batch (chip and position on array). We have previously established the multiple testing threshold (experiment-wide significance) for epigenome-wide association (EWAS) data generated on the HM450K array as p < 2.2E-07 [Citation25]. To identify differentially methylated regions (DMRs) we used the comb-p software tool [Citation26], to identify greater than or equal to three adjacent significant DMPs in a 1000 bp sliding window. The comb-p algorithm corrects the DMP p-values for autocorrelation between probes and then scans the genome for peaks of association around a seed signal (set to p < 5.0E-05). For each region it calculates the Stouffer–Liptak-corrected p-value, which is then adjusted for multiple testing using Šidák’s correction [Citation25,Citation26]. Next, we separately tested the association between blood cell composition and the methylation status of the top 20 MoCA-associated DMPs. We also performed candidate gene analysis, testing the associations between MoCA and neuroimaging variables (LHV, RHV, total brain volume, CSF, WM, GM, FA, MD, WMH) and the methylation of 45 CpGs that are included in the 450K array that are related to genes previously associated with AD (20 CpGs in ABCA7, 7 CpGs in TREM2, 18 CpGs in SNCA; [Citation27–29]). For the targeted gene analysis we used Bonferroni correction for multiple testing (α <1.1E-03) and used the same covariates described above.
Our secondary analysis focused on identifying the relationship between accelerated aging in blood (based on the Horvath and Hannum epigenetic clock age measures) and neuroimaging variables. The Horvath-predicted age based on 353 CpG probes and the Hannum-predicted age based on 71 CpG probes were generated using online calculators (https://dnamage.genetics.ucla.edu) [Citation10,Citation11]. The variables ‘AAHOAdjCellCounts’ and ‘AAHAAdjCellCounts’ derived from the online calculator were used in linear regression models as independent variables, and MoCA and MRI measures (LHV, RHV, GM, WM, CSF, FA, MD, WMH) were used as dependent variables. Cell type composition, gender, age, smoking, alcohol consumption and premorbid IQ (test of premorbid function) were used as covariates in the model. Bonferroni correction was used for the DNAm clock analyses to adjust for multiple testing with level of significance set at α <5.5E-03.
Our final analysis used weighted gene co-methylation network analysis (WGCNA) [Citation28] to group together highly correlated probes. First, we calculated the variance of methylation values across all 47 samples for each probe. Next, we excluded probes showing variance lower than the median of calculated variance in the entire dataset (variance <5.86E-04). A signed network was constructed using the automatic one-step blockwise modules function within the WGCNA package, based on a block size of 5000 and using a soft threshold parameter of six. Each module was then labeled with a unique color identifier according to size. Module-trait associations were examined using Pearson’s correlation coefficients to examine associations between the module eigengene (ME) values and cognitive and MRI outcomes (full details provided in Supplementary Methods) including MoCA total scores, and various MRI measures as described in section 2.1. The association between modules and the covariates that had been used for our initial linear regression analyses, including gender, age, batch effects and cell type compositions was also examined. Subsequently, the module membership (MM) of each probe was calculated as the correlation between DNAm and ME values. To incorporate cognitive performance (MoCA scores) in the WGCNA modules we calculated the gene significance (GS) of each probe. Thus GS describes the strength of the correlation between the DNAm of each probe and the MoCA scores while MM quantifies the extent to which a gene conforms to the characteristics of a module (i.e., correlates with ME) [Citation29]. Subsequently, the correlation between MM and GS for each probe was computed. The correlation between MM and GS for each probe indicates how central a given probe is to the determined module and how associated it is with the MoCA scores. Gene ontology (GO) and KEGG pathway enrichment analysis was conducted for the CpG sites that were grouped in the modules showing significant associations with the outcomes. The missMethyl package in R (v1.9) [Citation30] was used for this analysis, which adjusts for the number of CpGs associated with each gene in the HM450K array.
Results & discussion
Blood DNA methylation signatures are associated with cognitive impairment
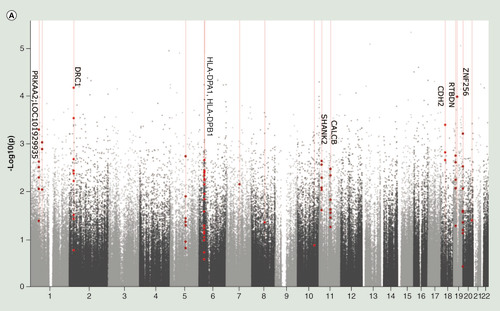
We identified a number of MoCA-associated DMPs (), but none reached the multiple testing threshold for EWAS data (p < 2.2E-07) [Citation25]. Our most significant DMP resided in BNC1 (cg26429925; standardized regression coefficient = -0.75, p = 4.71E-06). Differential methylation of BNC1, which encodes a zinc finger protein basonuclein, has been previously found in frontal cortex of AD subjects compared with controls [Citation31], and upregulation of BNC1 has been observed in a novel chimeric model of AD [Citation32].
Our subsequent regional analysis identified eight DMRs (each containing more than or equal to three DMPs), which were significantly associated with MoCA scores, with a Sidak-corrected p < 0.05 ( & A). The eight identified DMRs were annotated to the HLA-DPA1/HLA-DPB1, DRC1, PRKAA2, CALCB, CDH2, RTBDN, ZNF256 and SHANK2 genes. The top DMR we identified resided in genes encoding subunits of the human leukocyte antigen (HLA) DP receptor, which is involved in the immune response. Alterations in the immune profile of leukocytes have been previously described in MCI patients [Citation29]. Moreover increased RNA expression of HLA-DPA1 and HLA-DPB1 in frontal cortex and hippocampus has been associated with the transition from MCI to AD [Citation33]. It is unclear whether in our study the observed methylation changes in this DMR could affect gene expression. However, considering that they span the whole gene, including the transcription start site, it is likely that these methylation changes alter transcription. Interestingly, methylation changes in a probe of the SHANK2 gene, which is involved in the structural and functional organization of the dendritic spine and synaptic junction, have been previously reported in a study comparing blood DNAm profiles of AD subjects to nondemented controls [Citation7].
We did not find any associations between cell composition and MoCA scores. With regards to candidate gene analysis the most remarkable finding was a negative association between methylation at cg25748868 in TREM2 and WMH (standardized regression coefficient = -11,3, p = 3.9-E03); however, this did not survive Bonferroni correction for multiple testing (a <1.1E-03) and neither did any of the other tested comparisons (full data not shown). WMH load has been consistently associated with AD; TREM2 hypomethylation and overexpression have been previously observed when comparing blood samples of AD and controls, while increased TREM2 methylation and hydroxymethylation have been observed in AD brain [Citation34–38]. Overall it is likely that previously identified associations between cell composition and Parkinson’s disease as well as methylation and expression changes in ABCA7, TREM2 and SNCA with AD and SNCA methylation with dementia with Lewy bodies are specific for those conditions and thus not present in our dataset [Citation27,Citation34,Citation39–41].
Table 1. Differentially methylated loci in peripheral blood mononuclear cells associated with Montreal Cognitive Assessment.
Table 2. Differentially methylated loci in peripheral blood mononuclear cells associated with Montreal Cognitive Assessment.
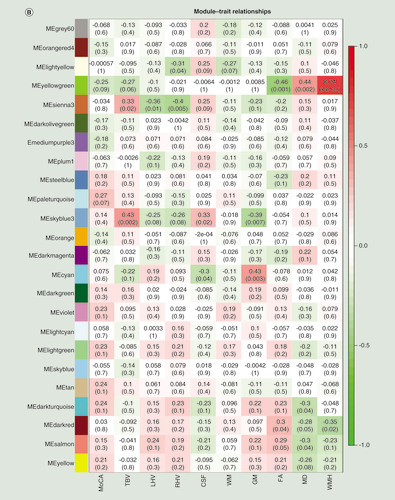
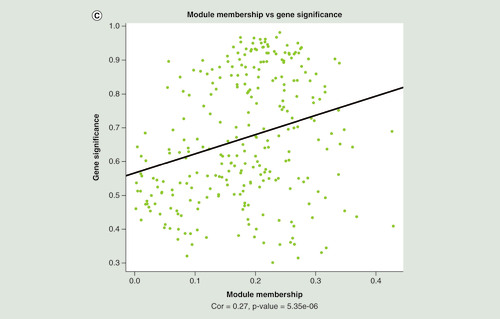
(A) Manhattan plot of differentially methylated regions (DMRs) associated with Montreal Cognitive Assessment. Red dots indicate the chromosomal location of individual probes within each DMR. The University of California Santa Cruz gene symbols corresponding to DMRs with more than three probes after Sidak correction for multiple testing are assigned to the chromosomal locations. (B) Heatmap of module–trait correlations for the remaining 24 modules, after excluding modules with significant association with the covariates of cell composition, batch, age, gender, smoking and IQ. Shown are the correlations of Montreal Cognitive Assessment, total brain volume, left hippocampal volume, right hippocampal volume, cerebrospinal fluid volume, white matter volume, gray matter volume, fractional anisotropy, mean diffusivity and white matter hyperintensities with each module. For each module–trait pair the upper value is the Pearson correlation coefficient, while the lower (bracketed) value is the correlation p-value. The cell color represents the strength and direction of the correlation. Modules are assigned an arbitrary color by the analysis software according to their size. (C) The correlation between module membership and gene significance for each probe in the ‘yellowgreen’ module.
CSF: Cerebrospinal fluid volume; FA: Fractional anisotropy; GM: Grey matter volume; LHV: Left hippocampal volume; MD: Mean diffusivity; ME: Module eigengene; MoCA: Montreal Cognitive Assessment; RHV: Right hippocampal volume; WM: White matter volume.
(A) Manhattan plot of differentially methylated regions (DMRs) associated with Montreal Cognitive Assessment. Red dots indicate the chromosomal location of individual probes within each DMR. The UCSC gene symbols corresponding to DMRs with more than three probes after Sidak correction for multiple testing are assigned to the chromosomal locations. (B) Heatmap of module–trait correlations for the remaining 24 modules, after excluding modules with significant association with the covariates of cell composition, batch, age, gender, smoking and IQ. Shown are the correlations of Montreal Cognitive Assessment, total brain volume, left hippocampal volume, right hippocampal volume, cerebrospinal fluid volume, white matter volume, gray matter volume, fractional anisotropy, mean diffusivity and white matter hyperintensities with each module. For each module–trait pair the upper value is the Pearson correlation coefficient, while the lower (bracketed) value is the correlation p-value. The cell color represents the strength and direction of the correlation. Modules are assigned an arbitrary color by the analysis software according to their size. (C) The correlation between module membership and gene significance for each probe in the ‘yellowgreen’ module.
CSF: Cerebrospinal fluid volume; FA: Fractional anisotropy; GM: Grey matter volume; LHV: Left hippocampal volume; MD: Mean diffusivity; ME: Module eigengene; MoCA: Montreal Cognitive Assessment; RHV: Right hippocampal volume; WM: White matter volume.
Accelerated blood DNAm age is associated with MRI alterations
Our linear regression analyses showed a significant association between chronological age and various imaging measures, as to be expected (Supplementary Table 2). We also observed a significant association between accelerated DNAm age (based on the Hannum epigenetic age clock) and two MRI measures (Supplementary Table 2). Increased DNAm age (based on the Hannum epigenetic clock) was associated with global measures of increased FA (p = 8.99E-04) and reduced MD (p = 8.33E-04), with these associations being in the opposite direction to the associations between global FA and MD with chronological age. Our findings seem paradoxical as reduced FA and increased MD have been associated with aging and symptomatic neurodegeneration and could be chance findings. Alternatively, epigenetic aging associated with increased FA and decreased MD could be linked with comparable findings in presymptomatic carriers of familial AD mutations, where it has been suggested that such findings could reflect earlier axonal insults in the pathway toward subsequent neurodegeneration such as neuroinflammatory changes leading to neuronal and glial swelling [Citation42,Citation43]. Nevertheless most studies indicated no change or decreased FA and increased MD in preclinical familial AD [Citation42].
No associations were observed between the Horvath epigenetic clock and any of the imaging variables tested and neither of the epigenetic clocks were associated with cognitive function or presence of cognitive impairment. In comparison to the study by Raina et al., we found no associations between accelerated DNAm age and WMH [Citation15].
Weighted gene co-methylation network analysis
WGCNA was used to construct clusters of highly correlated probes. For the current HM450K dataset, we identified 41 modules, with each assigned a unique color (Supplementary Table 3). Of those 41 modules, 16 were significantly associated with at least one of the covariates such as gender, age, cell composition estimates (based on Horvath epigenetic calculator; [Citation10]) or premorbid IQ. The gray module is considered to be ‘background’ CpG sites that are not clustered into any module, and were thus disregarded from further analyses. From the remaining 24 modules (B), the ‘yellowgreen’ module, which contained 278 probes, showed the greatest association with WMH, after correcting for multiple tests (r = 0.74, p = 2.28E-09). A positive correlation between MM and GS for each of the 278 probes in the ‘yellowgreen’ module was found with respect to MoCA scores (r = 0.27, p = 5.35E-06; C). The GO and KEGG enrichment analysis for the probes in the ‘yellowgreen’ module highlighted many pathways associated with the pathophysiology of cognitive dysfunction and dementia (Supplementary Tables 4 & 5), for example, the GO terms ‘main axon’ (GO:0044304: p = 4.37E-03) and ‘β-amyloid binding’ (GO:0001540: p = 0.0109), and the KEGG pathways ‘glutamatergic synapse’ (hsa04727: p = 4.79E-04) and ‘Alzheimer’s disease’ (hsa05010: p = 0.0491). DNAm and hydroxymethylation changes in genes involved in these pathways, such as axon and glutamatergic synapse have been previously linked to brain aging and cognition in experimental models [Citation44,Citation45].
Conclusion
The current study has identified DNAm changes in PBMCs that correlate with age-related cognitive dysfunction, measures of white matter integrity and WMH. We have identified eight DMRs that were associated with age-related dysfunction, with the most significant being related to immune response. Another identified DMR, SHANK2, has also been previously found to be differentially methylated when comparing blood DNAm profiles of AD cases and controls, and could represent an early dementia biomarker. We have also identified links between accelerated aging based on the Hannum epigenetic clock and MRI measures of white matter integrity and have found associations between WMH and methylation of genes involved in neurodegenerative processes.
Advantages of this study are related to the unique combination of multimodal MRI imaging, cognitive assessments and genome-wide DNAm analysis in a well characterized cohort with available extensive sociodemographic data giving the ability to control for confounders such as premorbid functioning. One of the main limitations of this pilot study is the relatively small sample size for EWAS. Therefore, any results will need to be replicated in larger independent cohorts. Future research will also need to assess the timing and specificity of such changes and expand research in more robust sequencing methods as the current arrays only cover a small proportion of DNAm sites. Moreover, the current approach does not distinguish between DNAm and hydroxymethylation and other DNA modifications. Additional limitations are related to the use of blood for methylomic profiling and the limited overlap with brain profiles and hence limited utility in providing novel mechanistic insights with regards to improving our understanding of the pathophysiology of cognitive dysfunction. This is further supported by the fact that we have detected correlations between brain WMH and methylation of genes involved in some but not all aspects of neurodegenerative processes [Citation46–48]. This could be due to several factors, such as the effect of cell differentiation, developmental programming and tissue specificity of methylation profiles [Citation49]. Moreover, the rapid turnover of peripheral cells may not mirror the cumulative environmental exposures and hence possible epimutations that a post mitotic neuron can accumulate over time. Alternatively, technical limitations, such as the limited coverage of total CpGs by the 450K array may fail to detect cross-tissue overlap that could be driven by genetic or early life factors [Citation50].
Overall, these findings suggest that DNAm changes in blood could have potential utility as a peripheral biomarker for age-related cognitive dysfunction and associated structural brain changes. Considering the need for robust biomarkers for early detection of dementia to test effective treatments in a timely manner, more research in the field of epigenetics and MCI is warranted.
Differentially methylated regions in eight genes are associated with cognitive dysfunction.
Epigenetic clock age is associated with fractional anisotropy and mean diffusivity.
White matter hyperintensities co-methylated modules are enriched in pathways involved in β-amyloid processing and glutamatergic signaling.
Supplemental application 1
Download MS Word (116.3 KB)Supplemental application 2
Download MS Word (44.6 KB)Acknowledgements
The authors thank the Whitehall II cohort participants for their time.
Supplementary data
To view the supplementary data that accompany this paper please visit the journal website at:
Financial & competing interests disclosure
The study was funded by the National Institute for Health Research (NIHR) Academic Clinical Fellowship programme (L Chouliaras), the Oxfordshire Health Services Research Committee (L Chouliaras), the Oxford University Clinical Academic Graduate School (L Chouliaras), the UK Medical Research Council (MRC; G1001354; K P Ebmeier; K013351; M Kivimäki) and also as part of the Joint Programme – Neurodegenerative Disease Research grant for the EPI-AD consortium (MR/N027973/1; K Lunnon, E Pishva), the Gordon Edward Small’s Charitable Trust (SC008962; K P Ebmeier) and the HDH Wills 1965 charitable trust (charity No: 1117747; K P Ebmeier). The authors have no other relevant affiliations or financial involvement with any organization or entity with a financial interest in or financial conflict with the subject matter or materials discussed in the manuscript apart from those disclosed.
No writing assistance was utilized in the production of this manuscript.
Additional information
Funding
References
- Delgado-Morales R , EstellerM . Opening up the DNA methylome of dementia . Mol. Psychiatry22 ( 4 ), 485 – 496 ( 2017 ).
- Lardenoije R , IatrouA , KenisGet al. The epigenetics of aging and neurodegeneration . Prog. Neurobiol.131 , 21 – 64 ( 2015 ).
- van den Hove DLA , KenisG , RuttenBP . Epigenetic dysregulation in Alzheimer’s disease: cause or consequence?Epigenomics6 ( 1 ), 9 – 11 ( 2014 ).
- Baird AL , WestwoodS , LovestoneS . Blood-based proteomic biomarkers of Alzheimer’s disease pathology . Front. Neurol.6 , 236 ( 2015 ).
- Lunnon K , KeohaneA , PidsleyRet al. Mitochondrial genes are altered in blood early in Alzheimer’s disease . Neurobiol. Aging53 , 36 – 47 ( 2017 ).
- Wen K-X , MilicJ , El-KhodorBet al. The role of DNA methylation and histone modifications in neurodegenerative diseases: a systematic review . PLoS ONE doi:10.1371/journal.pone.0167201 ( 2016 ).
- Lunnon K , SmithR , HannonEet al. Methylomic profiling implicates cortical deregulation of ANK1 in Alzheimer’s disease . Nat. Neurosci.17 ( 9 ), 1164 – 1170 ( 2014 ).
- Yu L , ChibnikLB , YangJet al. Methylation profiles in peripheral blood CD4+ lymphocytes versus brain: the relation to Alzheimer’s disease pathology . Alzheimers Dement.12 ( 9 ), 942 – 951 ( 2016 ).
- Lunnon K , SmithRG , CooperI , GreenbaumL , MillJ , BeeriMS . Blood methylomic signatures of presymptomatic dementia in elderly subjects with Type 2 diabetes mellitus . Neurobiol. Aging36 ( 3 ), 1600.e1 – 1600.e4 ( 2015 ).
- Horvath S . DNA methylation age of human tissues and cell types . Genome Biol.14 ( 10 ), R115 ( 2013 ).
- Hannum G , GuinneyJ , ZhaoLet al. Genome-wide methylation profiles reveal quantitative views of human aging rates . Mol. Cell.49 ( 2 ), 359 – 367 ( 2013 ).
- Chen BH , MarioniRE , ColicinoEet al. DNA methylation-based measures of biological age: meta-analysis predicting time to death . Aging8 ( 9 ), 1844 – 1865 ( 2016 ).
- Marioni RE , ShahS , McRaeAFet al. The epigenetic clock is correlated with physical and cognitive fitness in the Lothian Birth Cohort 1936 . Int. J. Epidemiol.44 ( 4 ), 1388 – 1396 ( 2015 ).
- Horvath S , GaragnaniP , BacaliniMGet al. Accelerated epigenetic aging in Down syndrome . Aging Cell.14 ( 3 ), 491 – 495 ( 2015 ).
- Raina A , ZhaoX , GroveMLet al. Cerebral white matter hyperintensities on MRI and acceleration of epigenetic aging: the atherosclerosis risk in communities study . Clin. Epigenetics9 ( 1 ), 21 ( 2017 ).
- Starnawska A , TanQ , LenartAet al. Blood DNA methylation age is not associated with cognitive functioning in middle-aged monozygotic twins . Neurobiol. Aging50 , 60 – 63 ( 2017 ).
- Suri S , TopiwalaA , MacKayCE , EbmeierKP , FilippiniN . Using structural and diffusion magnetic resonance imaging to differentiate the dementias . Curr. Neurol. Neurosci. Rep.14 ( 9 ), 475 ( 2014 ).
- Valkanova V , EbmeierKP . Neuroimaging in dementia . Maturitas79 ( 2 ), 202 – 208 ( 2014 ).
- Filippini N , ZsoldosE , HaapakoskiRet al. Study protocol: the Whitehall II imaging sub-study . BMC Psychiatry14 ( 1 ), 159 ( 2014 ).
- Marmot M , BrunnerE . Cohort profile: the Whitehall II study . Int. J. Epidemiol.34 ( 2 ), 251 – 256 ( 2005 ).
- Nasreddine Z , PhillipsN , BédirianVet al. The Montreal Cognitive Assessment, MoCA: a brief screening tool for mild cognitive impairment . J. Am. Geriatr. Soc.53 ( 4 ), 695 – 699 ( 2005 ).
- Pidsley R , WongCCY , VoltaM , LunnonK , MillJ , SchalkwykLC . Adata-driven approach to preprocessing Illumina 450K methylation array data . BMC Genomics.14 ( 1 ), 293 ( 2013 ).
- Triche TJ , WeisenbergerDJ , Van Den BergD , LairdPW , SiegmundKD . Low-level processing of Illumina Infinium DNA methylation BeadArrays . Nucleic Acids Res.41 ( 7 ), e90 ( 2013 ).
- Aryee MJ , JaffeAE , Corrada-BravoHet al. Minfi: a flexible and comprehensive Bioconductor package for the analysis of Infinium DNA methylation microarrays . Bioinformatics30 ( 10 ), 1363 – 1369 ( 2014 ).
- Hannon E , DempsterE , VianaJet al. An integrated genetic-epigenetic analysis of schizophrenia: evidence for co-localization of genetic associations and differential DNA methylation . Genome Biol.17 ( 1 ), 176 ( 2016 ).
- Pedersen BS , SchwartzDA , YangIV , KechrisKJ . Comb-p: software for combining, analyzing, grouping and correcting spatially correlated p-values . Bioinformatics28 ( 22 ), 2986 – 2988 ( 2012 ).
- Yoshino Y , MoriT , YoshidaTet al. Elevated mRNA expression and low methylation of SNCA in Japanese Alzheimer’s disease subjects . J. Alzheimers Dis.54 ( 4 ), 1349 – 1357 ( 2016 ).
- Langfelder P , HorvathS . WGCNA: an R package for weighted correlation network analysis . BMC Bioinformatics9 ( 1 ), 559 ( 2008 ).
- Lunnon K , IbrahimaZ , ProitsiPet al. Mitochondrial dysfunction and immune activation are detectable in early Alzheimer’s disease blood . J. Alzheimers Dis.30 ( 3 ), 685 – 710 ( 2012 ).
- Phipson B , MaksimovicJ , OshlackA . MissMethyl: an R package for analyzing data from Illumina’s HumanMethylation450 platform . Bioinformatics32 ( 2 ), 286 – 288 ( 2015 ).
- Bakulski KM , DolinoyDC , SartorMAet al. Genome-wide DNA methylation differences between late-onset Alzheimer’s disease and cognitively normal controls in human frontal cortex . J. Alzheimers Dis.29 ( 3 ), 571 – 588 ( 2012 ).
- Espuny-Camacho I , ArranzAM , FiersMet al. Hallmarks of Alzheimer’s disease in stem-cell-derived human neurons transplanted into mouse brain . Neuron93 ( 5 ), 1066 – 1081.e8 ( 2017 ).
- Parachikova A , AgadjanyanMG , CribbsDHet al. Inflammatory changes parallel the early stages of Alzheimer disease . Neurobiol. Aging28 ( 12 ), 1821 – 1833 ( 2007 ).
- Ozaki Y , YoshinoY , YamazakiKet al. DNA methylation changes at TREM2 intron 1 and TREM2 mRNA expression in patients with Alzheimer’s disease . J. Psychiatr. Res.92 , 74 – 80 ( 2017 ).
- Smith AR , SmithRG , CondliffeDet al. Increased DNA methylation near TREM2 is consistently seen in the superior temporal gyrus in Alzheimer’s disease brain . Neurobiol. Aging47 , 35 – 40 ( 2016 ).
- Celarain N , Sánchez-Ruiz de GordoaJ , ZelayaMVet al. TREM2 upregulation correlates with 5-hydroxymethycytosine enrichment in Alzheimer’s disease hippocampus . Clin. Epigenetics8 , 37 ( 2016 ).
- Marnane M , Al-JawadiOO , MortazaviSet al. Periventricular hyperintensities are associated with elevated cerebral amyloid . Neurology86 ( 6 ), 535 – 543 ( 2016 ).
- Thal DR , AttemsJ , EwersM . Spreading of amyloid, tau, and microvascular pathology in Alzheimer’s disease: findings from neuropathological and neuroimaging studies . J. Alzheimers Dis.42 , S421 – S429 ( 2014 ).
- Yamazaki K , YoshinoY , MoriTet al. Gene expression and methylation analysis of ABCA7 in patients with Alzheimer’s disease . J. Alzheimers Dis.57 ( 1 ), 171 – 181 ( 2017 ).
- Horvath S , RitzBR . Increased epigenetic age and granulocyte counts in the blood of Parkinson’s disease patients . Aging7 ( 12 ), 1130 – 1142 ( 2015 ).
- Funahashi Y , YoshinoY , YamazakiKet al. DNA methylation changes at SNCA intron 1 in patients with dementia with Lewy bodies . Psychiatry Clin. Neurosci.71 ( 1 ), 28 – 35 ( 2017 ).
- Mak E , GabelS , MiretteHet al. Structural neuroimaging in preclinical dementia: from microstructural deficits and grey matter atrophy to macroscale connectomic changes . Ageing Res. Rev.35 , 250 – 264 ( 2017 ).
- Ryan NS , KeihaninejadS , ShakespeareTJet al. Magnetic resonance imaging evidence for presymptomatic change in thalamus and caudate in familial Alzheimer’s disease . Brain136 ( Pt 5 ), 1399 – 1414 ( 2013 ).
- Ianov L , RivaA , KumarA , FosterTC . DNA methylation of synaptic genes in the prefrontal cortex is associated with aging and age-related cognitive impairment . Front. Aging Neurosci.2 ( 9 ), 249 ( 2017 ).
- Irier H , StreetRC , DaveRet al. Environmental enrichment modulates 5-hydroxymethylcytosine dynamics in hippocampus . Genomics104 ( 5 ), 376 – 382 ( 2014 ).
- De Jager PL , SrivastavaG , LunnonKet al. Alzheimer’s disease: early alterations in brain DNA methylation at ANK1, BIN1, RHBDF2 and other loci . Nat. Neurosci.17 ( 9 ), 1156 – 1163 ( 2014 ).
- Lunnon K , SmithR , HannonEet al. Methylomic profiling implicates cortical deregulation of ANK1 in Alzheimer’s disease . Nat. Neurosci.17 ( 9 ), 1164 – 1170 ( 2014 ).
- Iwata A , NagataK , HatsutaHet al. Altered CpG methylation in sporadic Alzheimer’s disease is associated with APP and MAPT dysregulation . Hum. Mol. Genet.23 ( 3 ), 648 – 656 ( 2014 ).
- Jakovcevski M , AkbarianS . Epigenetic mechanisms in neurological disease . Nat. Med.18 ( 8 ), 1194 – 1204 ( 2012 ).
- Dedeurwaerder S , DefranceM , CalonneE , DenisH , SotiriouC , FuksF . Evaluation of the Infinium Methylation 450 K technology . Epigenomics3 ( 6 ), 771 – 784 ( 2011 ).