
Abstract
Aim: Decidualization is essential for embryo implantation and placental development. We aimed to obtain transcriptome and epigenome profiles for primary endometrial stromal cells (ESCs) and in vitro decidualized cells. Materials & methods: ESCs isolated from human endometrial tissues remained untreated (D0), or decidualized for 4 days (D4) and 8 days (D8) in the presence of 8-bromo-cAMP and progesterone. Results: Among the epigenetic modifications examined (DNA methylation, H3K27ac, H3K9me3 and H3K27me3), the H3K27ac patterns changed most dramatically, with a moderate correlation with gene expression changes, upon decidualization. Subsets of up- and down-regulated genes upon decidualization were associated with reciprocal changes of H3K27ac and H3K27me3 modifications at their promoter region, and were enriched with genes essential for decidualization such as WNT4, ZBTB16, PROK1 and GREB1. Conclusion: Our dataset is useful to further elucidate the molecular mechanisms underlying decidualization.
Endometrium, the inner layer of uterus, is essential for successful conception. It undergoes a cycle of regeneration, proliferation, differentiation and desquamation several 100-times during the reproductive age under the control of the ovarian steroidal hormones [Citation1,Citation2]. These dynamic morphological and functional changes during the menstrual cycle are thought to be epigenetically regulated. Endometrium is mainly composed of fibroblastic stromal and glandular epithelial cells. Decidualization, the transformation of endometrial stromal cells (ESCs) into secretory decidual cells, is essential for embryo implantation and placental development, and is dependent on the postovulatory increase of progesterone and local cyclic AMP production levels in humans [Citation2,Citation3]. Defective decidualization has been implicated with spontaneous miscarriages [Citation4,Citation5], pre-eclampsia [Citation6,Citation7] and endometriosis [Citation8–10]. Further delineation of molecular mechanisms operating decidualization is fundamental to develop therapeutic methodologies for these pathogenic conditions.
ESCs can be readily isolated from endometrium tissue and cultured. In the presence a mixture of ovarian hormones such as progesterone and estrogen, the cells undergo morphologic and biochemical changes and acquire characteristics of decidual cells [Citation11]. These decidualized cells, in vitro model of decidualization, have been widely used to examine molecular mechanisms underlying decidual transformation [Citation1].
Epigenetic regulation of gene expression is essential for the development and cellular differentiation [Citation12,Citation13]. The responsiveness of ESCs to the hormonal cues is considered to be potentiated by genome-wide chromatin remodeling followed by the coordinated action of decidua-specific transcriptional networks [Citation14–16]. Decidualization marker genes, PRL and IGFBP1, are known to be associated with epigenetics changes at their promoter regions, increased levels of H3K27ac (an active chromatin mark) and decreased levels of H3K27me3 (a repressive chromatin mark) [Citation17–19].
Genome-wide histone modification patterns of ESCs and decidualized cells have been analyzed by two studies. One study [Citation17] characterized the changes of H3K27me3 patterns between ESCs and decidualized cells at gene promoter regions by chromatin immunoprecipitation (ChIP) coupled with DNA microarray analysis, and identified 3008 genomic regions including the IGFBP1 promoter region as regions showing a significant change of H3K27me3. Another study [Citation20] investigated genome-wide changes in four types of histone modifications (H3K4me3, H3K27ac and H3K4me1 as active marks and H3K27me3 as an inactive mark) associated with decidualization in ESCs using ChIP with next generation sequencing (ChIP-seq). The latter study demonstrated that the main changes in histone modifications upon decidualization are increases of H3K27ac and H3K4me3 at proximal and distal promoter regions, and identified only two and five regions as those with increased and decreased H3K27me3 signals, respectively, from genomic regions between -10 and +10 kb from transcription start sites (TSS) of the genes [Citation20].
In this study, to further capture the epigenetic dynamics and to understand its roles during decidualization, we conducted transcriptome and epigenome profiling for ESCs and decidualized cells. Epigenetic modifications, we investigated, include DNA methylation and three histone modifications, H3K27ac, H3K27me3 and H3K9me3 (a repressive chromatin mark). We confirmed relatively limited changes of repressive epigenetic modifications and the striking changes of H3K27ac levels correlated with gene expression changes in decidualization. We also revealed contribution of H3K27me3 changes at the promoter region of a portion of genes that are drastically up- and downregulated upon decidualization. As far as we are aware of, ChIP-seq data for H3K9me3 have been obtained for human ESCs and decidualized cells for the first time. We did not observe H3K9me3 changes at the promoters of up- and downregulated genes upon decidualization.
Materials & methods
Ethics
Donors of endometrial tissues provided written informed consent prior to endometrial tissue biopsy which was conducted in accordance with a protocol approved by the Institutional Review Boards at Juntendo University and the National Center for Child Health and Development.
Cell culture
Endometrial biopsies were obtained using the Pipelle Curette (CooperSurgical, CT, USA) from the uterine fundus from women of reproductive age without endometriosis who underwent laparoscopic cystectomy due to ovarian cyst. Characteristics of donor individuals are provided as Supplementary Table 1. ESCs were isolated as reported previously [Citation21] from endometrial tissues. After enzymatic digestion of minced tissues with 200 μg/ml collagenase B4 (SERVA, Heidelberg, Germany) in a shaking incubator for 2 h at 37°C, cells were separated by filtration through a 40 μm nylon mesh. The dispersed fragments were collected by centrifugation, resuspended in MF-start medium and seeded on culture dishes. The residual tissue fragments and cell clumps were collected into a new 50 ml tube using Accumax (Innovative Cell Technologies, CA, USA) and 0.25% Trypsin/EDTA (Gibco, catalog number 25200-056, Thermo Fisher Scientific, NY, USA) and then incubated for 10 min at room temperature with continuous pipetting. Cells separated by filtration through a 40 μm nylon mesh were collected by centrifugation, seeded in tissue culture dishes and incubated in phenol red-free DMEM containing glutamine, antibiotics and 10% dextran-coated charcoal-stripped fetal bovine serum (FBS) at 37°C, 95% air and 5% CO2. ESCs were passaged serially (three-times) until they reached to 10 cm dishes with 80% confluency. ESCs in a 10 cm dish were collected and subjected to immunostaining using fluorescently labeled anti-CD13 antibody followed by flow cytometry analysis to determine the percentage of the CD13-positive cells. ESCs in nine dishes were divide into three groups (three each dishes) to obtain decidualized cells (D4 and D8) and control D0 cells. D8 cells were cultured in the differentiation medium, which contains 1 μM MPA (Medroxyprogesterone 17 acetate, Sigma), 0.5 mM 8-Br-cAMP (Sigma, Tokyo, Japan), 2% charcoal-stripped FBS in DMEM/F12 medium (Thermo Fisher Scientific, Tokyo, Japan), for 8 days for decidualization. D4 cells were cultured in the cell maintenance medium, DMEM/F12 medium supplemented with 2% charcoal-stripped FBS for 4 days, and in the differentiation medium for the subsequent 4 days. D0 cells were cultured in the cell maintenance medium for 8 days (). Medium was changed every other day for all types of cells in the 8-day culture period.
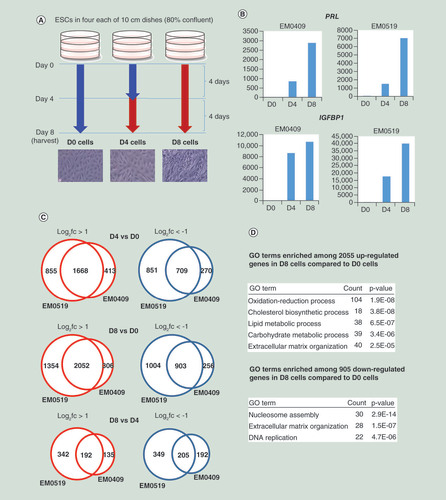
(A) Cell culture scheme for in vitro decidualization. Detailed procedures are described in the ‘Materials & methods’ section. Blue and red arrows indicate the periods of cell culture with cell maintenance medium and differentiation medium, respectively. Microscopic photographs (×200) of cells are shown. (B) Series of cells (D0, D4 and D8) from two donors (EM0409 and EM0519) were assessed for the expression levels of PRL and IGFBP1 upon decidualization (D4 and D8) relative to those in control D0 cells by quantitative RT-PCR (one point measurement per sample). (C) Numbers of differentially expressed genes upon decidualization. (D) Representative GO terms enriched in up- and downregulated genes upon decidualization.
GO: Gene ontology.
Nucleic acid isolation & quantitative RT-PCR
For each of three cell types (D0, D4 and D8), cells in one dish and two dishes were subjected to nucleic acid extraction and chromatin isolation, respectively. Genomic DNA and total RNA were isolated from cells using AllPrep DNA/RNA Kit (Qiagen, Tokyo, Japan). Quantitative RT-PCR was performed as described previously [Citation22] using the following PCR primers: 5′-AAGCTGTAGAGATTGAGGAGCAAAC-3′ and 5′-AAGCTGTAGAGATTGAGGAGCAAAC-3′ for PRL, 5′- CGAAGGCTCTCCATGTCACCA-3′ and 5′-TGTCTCCTGTGCCTTGGCTAAAC-3′ for IGFBP1, and 5′- GCGGAAGGGTACAGCCAAT-3′ and 5′- GCAGCCGGCGCAAA -3′ for L19. The expression levels of IGFBP1 and PRL were normalized by that of L19.
RNA-sequencing & data analysis
Libraries for RNA-sequencing (RNA-seq) were prepared using NEBNext rRNA Depletion Kit (NEB, Tokyo, Japan: #E6318) and NEBNext Ultra Directional RNA Library Prep Kit (NEB # E7420S) from 750 ng of total RNA as a starting material. Paired end reads (101bp x2) obtained by the HiSeq2500 platform (Illumina, CA, USA) were trimmed for adapter sequences using cutadapt-1.7.1 and for low-quality bases at ends using a custom script, and mapped to the human reference genome (hg19) by Tophat2.1.1 (http://ccb.jhu.edu/software/tophat/index.shtml). After the removal of PCR duplicates using picard-tools-1.109, the resultant bam files were subjected to transcript assembly and quantification using Cufflinks 2.2.1 (http://cole-trapnell-lab.github.io/cufflinks/) with a gene annotation file (.gtf file) obtained from Illumina iGenomes website (https://support.illumina.com/sequencing/sequencing_software/igenome.html) (archive-2012-03-09-03-24-41). Gene expression values were calculated as fragments per kilobase of exon per million mapped fragments (FPKM). FPKM values smaller than 0.3 were regarded as ‘not expressed’ and transformed to 0.3. Gene ontology (GO) analysis was performed using the database for annotation, visualization and integrated discovery (https://david.ncifcrf.gov/) using the official gene symbols of differentially expressed RefSeq genes extracted from the genes_fpkm. tracking file (Cuffdiff output). FPKM values and positional information of TSSs from the tss_fpkm. tracking file (Cuffdiff output) were used for integrative analyses of transcriptome and histone modification profiles.
DNA methylation profiling
Genome-wide DNA methylation profiles of endometrial stromal (D0) and decidualized cells (D4 and D8) were obtained using an Illumina Infinium HumanMetylation 450 BeadChip as described previously [Citation23]. The image data obtained using an iScan system (Illumina) were processed with the GenomeStudio software (Methylation Analysis Module version 1.9.0, Illumina) with background subtraction and control normalization options. Methylation levels for each of over 480,000 CpG sites were calculated as a β-value (=intensity of the methylated allele/[intensity of the unmethylated allele + intensity of the methylated allele + 100]), ranging from 0 (completely unmethylated) to 1 (completely methylated). Probes with a missing β-value or a high detection p-value (>0.01) were excluded for further analysis.
Chromatin immunoprecipitation
Cells were collected from three 10 cm dishes, cross-linked with 1% formaldehyde for 10 min at 37°C, and 2 M glycine solution was added to the cell suspension (final concentration 0.125 M). The fixed cells were resuspended in SDS lysis buffer (ChIP Reagent, Nippon Gene Co., Ltd., Tokyo, Japan) and the lysate was sonicated to fragment chromatin using a S220 Focused-ultrasonicator (Covaris, MA, USA). The chromatin was purified by centrifugation and immunoprecipitated with Dynabeads M-280 sheep antimouse IgG (Veritas Life Sciences, Allentown, PA) conjugated to mouse IgG (Abcam, Tokyo, Japan: ab37415), anti-H3K9me3 antibodies (CMA318), anti-H3K27me3 (CMA323) or anti-H3K27ac (CMA309) in 1xRIPA (150 mM) buffer with protease inhibitor (ChIP Reagent) 4–6 h at 4°C. The chromatin bound with beads was washed with 1×RIPA (150 mM) buffer, 1×RIPA (500 mM) buffer and TE buffer. After washing, the chromatin bound with beads was incubated in ChIP direct elution buffer (ChIP Reagent) for overnight at 65°C (for reverse cross-linking), followed by the incubation with proteinase K for 2 h at 55°C. The DNA immunoprecipitated from the supernatant was purified using AMPure XP beads (Beckman Coulter, IN, USA) according to the manufacturer’s instructions.
ChIP sequencing (ChIP-seq) & data analysis
ChIP-seq and input libraries were prepared from 0.1 to 1.0 ng of ChIP DNA samples (from D0, D4 and D8 cells) and 1.0 ng of input DNA samples (from D4 cells), respectively, using NEBNext Ultra II DNA Library Prep Kit for Illumina (NEB, E7645S). Single end reads (51 bp) were obtained by the HiSeq2500 platform (Illumina). Reads from each of ChIP-seq and input libraries were first trimmed for adapter sequences using cutadapt-1.7.1 and for low-quality bases at ends using a custom script, and aligned to the human reference genome (hg19) using the Burrows-Wheeler Aligner 0.6.2 (http://bio-bwa.sourceforge.net/). PCR duplicates were removed using picard-tools-2.8.1 (http://broadinstitute.github.io/picard/). The resultant bam files (including multihit reads) of the pairs of ChIP and input libraries were subjected to peak detection using MACS2 (https://github.com/taoliu/MACS) with the broad peak calling option for H3K27me3 and H3K9me3. For further analyses of H3K27ac peaks, genomic regions of peaks in bed format detected in six samples (D0, D4 and D8 cells of EM0409 and EM0519) were merged as one bed file using the merge command of bedtools2.26.0 (http://bedtools.readthedocs.io/en/latest/). Mapped reads of H3K27ac ChIP-seq libraries and input libraries were counted for each of merged peaks using the annotate command of bedtools2.26.0. For further analyses of H3K9me3 and H3K27me3 data, mapped reads of all ChIP and input libraries and were counted for each of 1000-bp windows of the hg19 reference genome with the annotate command of bedtools2.26.0. Windows whose maximal count among three samples (D0, D4 and D8) is smaller than 20 were removed for further analyses. Read counts for peak regions (H3K27ac and input data) and 1000-bp windows (H3K9me3, H3K27me3 and input data) were counted. ChIP read counts were divided by the input read counts of the corresponding peak region or window. The resultant enrichment scores were subjected to quantile normalization using the normalizeQuantiles function in the limma package of R (https://www.r-project.org/). The quantile-normalized enrichment scores of H3K27ac and H3K27me3 for the 2000 upstream regions of RefSeq TSSs were calculated in the same manner.
MACS2, seqMINER (https://github.com/zhanxw/seqminer), ngs.plot (https://github.com/shenlab-sinai/ngsplot) and custom R scripts were used to analyze ChIP-seq data. Integrative Genomics Viewer (IGV, http://software.broadinstitute.org/software/igv/) was used to visualize ChIP-seq peaks together with RNA-seq data.
Data repository
Files for FPKM values calculated by Cufflinks 2.2.1 from RNA-seq data, peak call files (hg19) produced by MACS2 from ChIP-seq data, bigWig files (hg19) for ChIP-seq and RNA-seq read coverages are available at the Dyrad Digital Repository (https://doi.org/10.5061/dryad.97s68c2).
Results
Transcriptome & epigenome profiling for ESCs & decidualized cells
We obtained ESCs and decidualized cells (D4 and D8) through the cell culture conditions shown in from two donor individuals (EM0409 and EM0519). The percentage of CD13-positive cells among the isolated ESCs determined by immune-staining followed by flow cytometry analysis was >85% (data not shown). The differentiation status of the cells was confirmed by quantitative RT-PCR for two decidualization marker genes, PRL and IGFBP1 [Citation2]. Both genes were dramatically upregulated (839–39,743 folds) in D4 and D8 cells as expected (). We subsequently obtained transcriptome and methylome profiles, and histone modification (HM) profiles for H3K27ac (an active chromatin mark), and for H3K9me3 and H3K27me3 (repressive chromatin marks). We obtained high-quality data for the majority (99.6%) of 482,421 CpG loci that are covered by the HumanMethylation450 BeadChip array platform. We mapped sequence reads obtained from RNA-seq and ChIP-seq libraries to the hg19 human reference genome as described in the ‘Materials & methods’ section, and examined the library metrics such as mapping and PCR duplicate rates to confirm their data quality (Supplementary Table 2). We also assessed the quality of ChIP-seq data by visual inspection of peak shapes using IGV (http://software.broadinstitute.org/software/igv/) and peak calling results using MACS2 (https://github.com/taoliu/MACS) (Supplementary Table 2). We subjected all transcriptome and epigenomic profiles to the subsequent data analyses except for one, the H3K27ac profile of EM0519_D8 cells due to its low-peak numbers.
Gene expression changes upon decidualization
We counted the numbers of differentially expressed genes upon decidualization. Among the 14,962 RefSeq genes that were expressed (FPKM >0.3) in at least one of the six samples (D0, D4 and D8 cells from two donors), 1646 (10.9%) and 2055 (13.6%) genes were commonly upregulated (FPKM fold-change >2.0) in D4 and D8 compared with D0, and 712 (4.7%) and 905 (6.0%) genes were commonly downregulated (fold-change <0.5) ( & Supplementary Table 3). We compared our data with those of a previous microarray-based expression study for decidualization [Citation24], and confirmed that 45 out of top 50 upregulated and 34 out of top 50 downregulated genes reported by Takano et al. [Citation24] were also found to be differentially expressed in our study. GO analysis using database for annotation, visualization and integrated discovery 6.7 (https://david-d.ncifcrf.gov/) detected several each of statistically significantly enriched GO terms among both upregulated and downregulated genes ( & Supplementary Table 4). The detected GO terms include those recapitulating the well-defined features of decidualization [Citation2], such as upregulation of genes involved in ‘cholesterol biosynthetic process’ (for steroid hormone production), downregulation of genes involved in ‘DNA replication’ (for cell cycle arrest), and up- and downregulation of genes involved in ‘extracellular matrix organization’. The consistency of gene expression (GE) patterns upon decidualization between this and previous studies assures the suitability of the in vitro differentiated cells obtained in this study for epigenomic profiling.
Limited DNA methylation changes upon decidualization
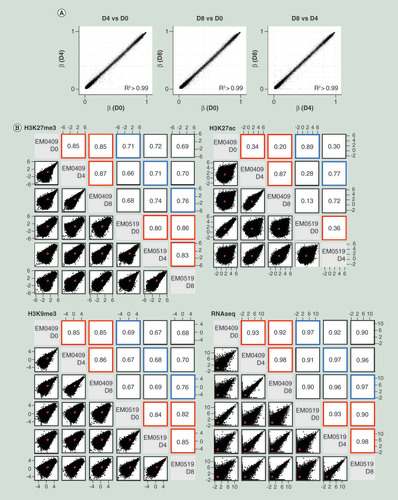
We obtained DNA methylation profiles for 480,825 CpG sites of cells from the donor EM0409. When methylation β-value differences (Δ β) >0.2 and <-0.2 were considered as differentially methylated, only 18 (0.004%) and 337 (0.07%) CpG sites were hyper- and hypomethylated in decidualized (D8) cells compared with control D0 cells, respectively (). DNA methylation profiles of the cells from the donor EM0519 also showed similar methylation patterns (data not shown). These results indicate that the majority of the GE changes observed upon decidualization ( & ) are independent of CpG methylation alterations.
(A) Comparisons of genome-wide DNA methylation profiles among D0, D4 and D8 cells from the EM0409 donor. (B) Scatter plots and Pearson correlation coefficients for genome-wide histone modification profiles (H3K27me3, H3K27ac, and H3K9me3) and transcriptome (RNA-seq) profiles. Comparisons were made for all possible pairwise combination among five (H3K27ac) or six samples. Normalized mapped read counts per 1000-bp window for H3K9me3 and H3K27me3, normalized mapped read counts per peak for H3K27ac, and FPKM values for RNA-seq were plotted and assessed for their correlation using the pairs.panels function in the psych package of R. The correlation ellipse is shown in red in each plot. Correlation coefficients from the comparison of the same cell type between donors are boxed in blue, those from the comparison of different cell types (D0, D4 or D8) derived from the same donor are boxed in red.
Histone modification profiles of ESCs & decidualized cells
We initially assessed the extents of reproducibility between two biological replicates and of differences upon decidualization for GE and HM profiles (). The scatter plots represent comparisons of normalized enrichment scores (calculated as described in the materials & methods) for 64,497 merged peaks for H3K27ac, 1,280,496 windows for H3K27me3 and 920,113 windows for H3K9me3 (window size: 1000 bp). Pearson correlation coefficients of the comparisons between biological replicates (boxed in blue) for HMs ranged from 0.68 (D4, H3K9me3) to 0.89 (D0, H3K27ac), demonstrating overall high reproducibility. In the comparisons among D0, D4 and D8 cells from the same donor, the distributions of mapped read counts per window were highly correlated for H3K9me3 and H3K27me3, with correlation coefficients between 0.80 and 0.86. In contrast, the distributions of mapped read counts per peak for H3K27ac were different between control D0 cells and decidualized (D4, D8) cells, with correlation coefficients between 0.20 and 0.36. When differential enrichment thresholds of fold-change >2 and fold-change <0.5 were used for increase and decrease upon decidualization, the ratios of peaks or 1000 bp windows that were differentially enriched in D4 compared with D0 in both series were 15.4 and 16.7% for H3K27ac peaks, 0.3 and 0.7% for H3K27me3 windows, and 0.3 and 0.3% for H3K9me3 (counts and ratios for individual sets are listed in Supplementary Table 5). These results indicate that H3K27ac patterns change most dramatically upon decidualization among the three HMs examined.
Correlation of gene expression & histone modification changes in ESCs & decidualized cells
We subsequently examined the extent of correlation of GE changes and HM changes at gene promoter regions. Fold-changes of FPKM values for TSSs in D4 relative to those in D0, and fold-changes of normalized enrichment scores of histone modifications in D4 relative to those in D0, were assessed for their correlation. Only TSSs whose FPKM values were greater than 0.3 in D0 or D4 were subjected to the analysis. When HM peaks or windows located within 2000 bp distance from a TSS were assessed for EM0409 (), the Spearman correlation coefficients between GE changes and HM changes were 0.54 (H3K27ac), -0.22 (H3K27me3) and 0.16 (H3K9me3), suggesting a moderate positive correlation of H3K27ac levels and a weak negative correlation of H3K27me3 levels with GE changes. Similar results were obtained for EM0509 (Supplementary Table 6).
(A) Correlation analyses of GE changes (log2 fold-change (fc) of FPKM values) and HM changes (log 2 fc of enrichment scores) at the gene promoter regions (-2000 to 0 bp regions relative to TSS) in D4 cells compared with D0 cells for H3K27ac (left), H3K27me3 (middle), and H3K9me3 (right). The numbers of TSSs subjected to the correlation analysis were, 17,462, 11,162 and 6250 among 23,553 TSSs. (B) Average profiles of three histone modifications along gene structure drawn using the ngs.plot software package for four gene groups categorized by GE levels (no, low, middle and high). (C) Average profiles of three histone modifications along the structures of up- and downregulated genes in D0, D4 and D8 cells of EM0409. In panels (B) and (C), 2000 bp upstream, gene body (from TSS to transcription end site), and 2000 bp downstream regions were subjected to count reads. and the averages of the reads per million values of genes were plotted for 101 subwindows.
GE: Gene expression; HM: Histone modification; TSS: Transcription start site.
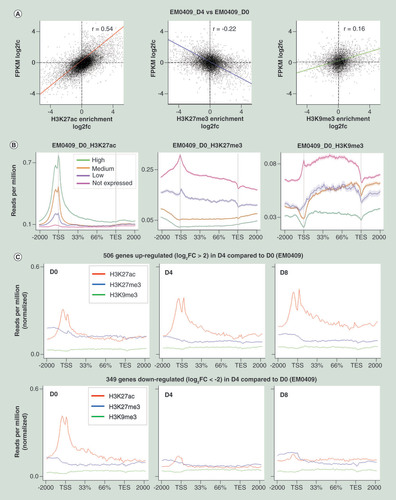
We also drew average profiles of three HMs along gene structure for four subcategories of genes depending on their GE levels: no expression, FPKM ≤0.3; low, 0.3< FPKM ≤1; middle, 1< FPKM ≤10; high, FPKM >10) (). In case of EM0409_D0 (22,493 genes in total), the ratios of four subcategories were 39.1% (no), 7.4% (low), 27.2% (middle) and 26.2% (high). H3K27ac levels at the TSS regions were proportional to GE levels, and H3K27me3 and H3K9me3 levels were inversely related to GE levels at the promoter regions and gene bodies. These patterns are consistent with well-established features of H3K27ac being an active promoter mark and H3K27me3/H3K9me3 being repressive marks. The other five ESC and decidualized cells showed highly similar patterns with those of EM0409_D0 (data not shown).
To delineate HM changes along the genes with GE alterations upon decidualization, we drew average profiles of HMs for 506 and 349 genes that were up- (fold-change >4) and down-regulated (fold-change <0.25) in D4 cells compared with D0 cells ( & Supplementary Figure 1). For between-sample comparisons of HM profiles, we normalized their reads per million values (determined by ngs.plot) by the ratio of the median of quantile-normalized enrichment scores to the median of enrichment scores before quantile-normalization. The average H3K27ac levels at the TSS regions became higher among up-regulated genes and lower among downregulated genes in D4 and D8 cells compared with D0 cells. The average H3K27me3 level among upregulated genes became noticeably lower in D4 than in D0 cells, suggesting the possibility that gain of H3K27ac and loss of H3K27me3 occurred simultaneously at a subset of the upregulated promoter regions. Such reciprocal changes have been previously described at the promoters of decidualization marker genes, IGFBP1 and PRL [Citation17–19].
Selection of up- & downregulated gene promoters upon decidualization accompanied with reciprocal changes of H3K27ac & H3K27me3 levels
Reciprocal changes of H3K27ac and H3K27me3 modifications at a gene promoter are expected to be associated with a drastic change in GE levels: the tight repression in ESCs and highly elevated expression upon decidualization (or vice versa). We obtained quantile-normalized enrichment scores of H3K27ac and H3k27me3 in 2000 bp upstream regions of 21,753 RefSeq TSSs as described in the ‘Materials & methods’ section, and selected the following TSS sets: 664 TSSs with H3K27ac enrichment score (27ac_ES) ≥2 and H3K27me3 ES (27me3_ES) ≥0.5 as those accompanied with H3K27ac increase only (orange), 306 TSSs with 27ac_ES ≥2 and 27me3_ES < 0.5 as those accompanied with H3K27ac increase and H3K27me3 decrease (red), 816 TSSs with 27ac_ES < 0.5 and 27me3_ES < 2 as those accompanied with H3K27ac decrease only (light blue), and 220 TSSs with 27ac_ES < 0.5 and 27me3_ES ≥ 2 as those accompanied with H3K27ac decrease and H3k27me3 increase. The extents of expression fold-changes of genes associated with reciprocal HM changes (red and blue) tended to be larger than those of genes associated with H3K27ac change alone (orange and light blue) at the promoter regions ( & B) with statistical significance (Supplementary Figure 2). Scatter plot representation of FPKM values of those genes in D0 and D4 cells () also demonstrated the presence of a subset of genes that are tightly repressed in one cell type and highly expressed in the other.
(A) Box plot representation of gene expression fold-changes of all 21,753 TSSs, TSSs accompanied with H3K27ac change only (orange and light blue), and TSSs accompanied with reciprocal changes of H3K27ac and H3K27me3 in EM0409 cell series (red and blue). The 21,753 TSSs were selected as those whose FPKM value is greater than 0.3 in one or more of three cell types (D0, D4 and D8). (B) Scatter-plot representation of log2-transformed FPKM values in EM0409_D0 (x-axis) and EM0409_D4 (y-axis) cells. The color assignment for dots and lines is the same as that in panel A. Lines represent the median of log2-transformed FPKM fold-changes of each of subcategories. (C) Heatmap representation of the H3K27ac and H3K27me3 enrichment levels of 23 upregulated and 8 downregulated promoters accompanied with reciprocal changes of H3K27ac and H3K27me3. These were selected as those fulfilling the FPKM log2 fold-change criteria of >4 or <-4. #1 and #2 correspond to EM0409 and EM0519. The heatmap color scales are shown at the bottom. (D) Visualization of histone modification and gene expression alterations for six loci. Read count (per 25bp-window) data (in .tdf format) were created using the count function of IGVtools (https://software.broadinstitute.org/software/igv/igvtools) from the mapped results of ChIP-seq and RNA-seq data (.bam files), and visualized using the Integrative Genomics Viewer (http://software.broadinstitute.org/software/igv/). The asterisk in the panels for WNT4, ZBTB16, HSD11B1 and ADRA2A indicates the approximate position of the genomic interval showing reciprocal changes of H3K27ac and H3K27me3 upon decidualization.
TSS: Transcription start site.
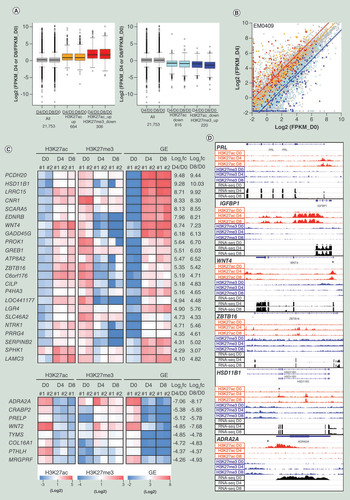
We hypothesized that genes whose promoter exhibits reciprocal alterations of H3K27ac and H3K27me3 upon decidualization are enriched with those having essential functions in decidualization, and searched for such promoters. The numbers of the H3K27ac peaks and H3K27me3 whose enrichment levels were higher (fold-change >2) and lower (fold-change <0.5) in D4 compared with D0 commonly in two series (EM0409 and EM0519) were 9951 and 9384, respectively (Supplementary Table 6). The center base position of the overlapped regions of the H3K27ac peaks of EM0409_D4 and EM0519_D4 was padded with 2000 bp on both sides. Among the resultant 4000 bp intervals, 4548 had an overlap (≥1 bp) with an H3K27me3-decreased window. Among those H3K27ac-increased/H3K27me3-decreased regions, 1304 regions were flanked by a TSS located within 5000 bp distance. Among those, 572 regions whose associated gene was upregulated (fold-change >2) in D4 compared with D0 in both EM0409 and EM0519 were selected as candidates. We visually inspected the HM patterns of a portion of these 572 candidates using IGV, and realized that regions with low levels of H3K27me3 in D0 cells and regions with low levels of H3K27ac in D4 cells were included among them. Therefore, we excluded the regions with the H3K27me3 enrichment score less than the tenth percentile value in D0 cells and the regions with the H3K27ac enrichment score less than the tenth percentile value in D4 cells. The resultant 417 regions were regarded as candidates for upregulated promoters with the increase of H3K27ac and the decrease of H3K27me3 marks. Similarly, among the 10,788 regions whose H3K27ac level decreased (fold-change <0.5) commonly in EM0409 and EM0519, 249 regions had an overlap with one of the 3790 regions whose H3K27me3 level increased (fold-change >2) commonly. Among those, 75 regions, being flanked by a TSS of the downregulated (fold-change <0.5) genes within 5000 bp distance, were selected as candidates for downregulated promoters with the decrease of H3K27ac and the increase of H3K27me3 marks. It should be also noted that the padded 4000 bp intervals of H3K27ac-increased or -decreased regions were partially overlapped each other when multiple H3K27ac peaks existed within a 2000-bp interval. After eliminating such redundantly counted regions, we identified 125 upregulated and 45 downregulated RefSeq gene promoters that are accompanied with reciprocal changes of H3K27ac and H3K27me3 modifications upon decidualization (Supplementary Table 8). Among those, 23 upregulated and 8 downregulated promoters were further selected as those fulfilling the FPKM log2 fold-change criteria of >4 or <-4, and are shown in . The H3K27ac, H3K27me3, and RNA-seq profiles in D0, D4 and D8 cells of EM0409 visualized using IGV are shown for six loci in . PRL and IGFBP1 represent loci previously reported to be associated with reciprocal changes of H3K27ac and H3K27me3 [Citation17–19]. Although the decrease of the H3K27me3 levels in D4 cells compared with those in D0 cells was visually discernible at the promoter regions of the PRL and IGFBP1 genes(), those regions fell slightly short of our selection criteria described above. The other four loci, WNT4, ZBTB16, HSD11B1 and ADRA2A, were selected as examples of the loci that fulfilled our criteria ( & Supplementary Table 8).
Discussion
We successfully obtained genome-wide histone modification profiles of H3K27ac, H3K27me3 and H3K9me3 for human ESCs and decidualized cells by ChIP-seq analysis. The H3K9me3 profiles were obtained for these cells for the first time. The roles of these three histone modifications have been very well established by a large number of past studies including consortium projects [Citation25]. H3K27ac marks active promoters and enhancers, and therefore represents an indicator of gene expression [Citation25]. H3K27me3 and H3K9me3 are repressive marks associated with polycomb repression and heterochromatin, respectively [Citation25]. Consistently, we observed a positive correlation between GE changes and H3K27ac changes at promoter regions and a weak negative correlation between GE changes and H3K27me3 changes at promoter regions ().
Although the H3K27ac and H3K27me3 profiles have already been reported previously [Citation17,Citation20], our data for these histone modifications enabled us to have detected larger numbers of peaks and differentially enriched regions upon decidualization. For instance, whereas Tamura et al. [Citation20] reported the numbers of H3K27ac-increased and -decreased regions upon decidualization to be 3705 and 42, respectively, we detected 9951 and 10,788 regions as H3K27ac-increased and -decreased regions upon decidualization (Supplementary Table 5). The high-correlation coefficients (0.89 and 0.77) of the mapped read counts per peak of the H3K27ac profiles of the biological replicates () demonstrate the reliability of our dataset. Whereas we and Grimaldi et al. [Citation17] detected thousands of H3K27me3-increased and -decreased regions upon decidualization, Tamura et al. [Citation20] detected less than ten of such regions. The authors mentioned the possibility that the differences in the reagents and the culture duration to induce decidualization may underlie the discrepant results between the two studies, Grimaldi et al. and Tamura et al. [Citation20]. According to suggestions during the review procedure, we reanalyzed ChIP-seq data by Tamura et al. [Citation20] using our bioinformatic protocols described in the materials & methods, and detected peaks using MACS2 (Supplementary Table 2). The numbers of H3K27ac peaks detected for four samples were 9071, 2677, 18764 and 497. The number of H3K27me3 peaks detected with the broad option of MACS2 was zero for all four samples. These low-peak numbers indicate overall low signal-to-noise ratios of ChIP-seq data by Tamura et al.
There are many bioinformatic tools available to detect differential regions for histone modification enrichment. A recent comprehensive comparison of 14 tools for differential ChIP-seq analysis [Citation26] has revealed that these tools show a great variety in the type of signal detected with a low level of agreement, and therefore warned that the choice of the differential peak detection tools will crucially impact the outcome. These tools are diverse in many critical points such as the method of normalization and statistical test, requirement for prior peak detection by external algorithms and biological replicates, and the types of peaks (sharp, broad or both) for which the tool was designed. In this study, for differential peak detection for H3K27me3 and H3K9me3, we did not use the existing differential ChIP-seq analysis tools and analyzed normalized read counts (per 1000 bp window) obtained using bedtools, R and custom shell scripts. We preferred our own analysis than the existing tools because the majority of them were not compatible with our data after quantile normalization. For the differential peak detection for H3K27me3 and H3K9me3, we applied the window size (1000 bp) used in Tamura et al. [Citation20], and did not examine the effects of window sizes on the differential peak detection.
In this study, we first observed that H3K27ac patterns changed most dramatically upon decidualization, and were correlated with GE changes. Subsequently, we noticed that, although the alterations of the repressive histone modifications (H3K9me3 and H3K27me3) were much more limited than those of H3K27ac, the average level of H3K27me3 associated with upregulated genes upon decidualization became lower in decidualized cells (D4 and D8) than ESCs (D0) (). These observations led us to search for gene promoter regions whose up- and downregulation upon decidualization is associated with reciprocal changes of H3K27ac and H3K27me3. Genes driven by such promoters were expected to be tightly repressed in ESCs and to get drastically upregulated in a manner dependent of cAMP and progesterone actions, or vice versa. We observed such a tendency especially in the genes upregulated upon decidualization (, Supplementary Figure 2 & Supplementary Table 9). Importantly, the 90 genes upregulated upon decidualization with reciprocal changes of H3K27ac and H3K27me3 at their promoter ( & Supplementary Table 8) include at least four genes that have been shown to be functionally essential for decidualization, namely, WNT4 [Citation27], ZBTB16 [Citation28], PROK1 [Citation29] and GREB1 [Citation30]. siRNA knockdown of these genes has been shown to inhibit steroid hormone-induced decidualization of human ESCs [Citation27–30]. Because the majority of 90 genes has not been tested for their roles in decidualization, systematic functional characterization of these genes (e.g., siRNA knockdown screening) is effective for identifying additional critical genes for decidualization, and to deepen our understanding of its molecular mechanisms.
The 90 upregulated genes ( & Supplementary Table 8A) also contain genes known to be critical for decidualization and its functions (such as HSD11B1, CNR1 and EDNRB) and genes potentially possessing as-yet-unknown important functions in decidualization such as SCARA5. The progesterone-dependent induction of HSD11B1 encoding hydroxysteroid 11-β dehydrogenase 1 leads to cortisol biosynthesis in decidualized cells and transcriptional regulation of glucocorticoid receptor and mineralocorticoid receptor-mediated gene networks [Citation31]. CNR1 encodes cannabinoid receptor I. Endocannabinoid signaling is proposed to modulate decidualization [Citation32], and to be critical in regulating decidual senescence and parturition timing [Citation33,Citation34]. EDNRB encodes endothelin receptor B, which binds members of the endothelin family proteins that regulate endometrial blood flow [Citation35]. EDNRB has been proposed as a factor involved in endometrial receptivity [Citation36], a temporally unique sequence of factors that make the endometrium receptive to embryonic implantation [Citation37]. SCARA5 is known to encode a ferritin receptor mediating nontransferrin iron delivery [Citation38]. The observed expression pattern of this gene, tight suppression in ESCs and high expression in decidualized cells, suggests an unknown role of ferritin-mediated regulation in decidualization.
Grimaldi et al. [Citation17] has shown by ChIP-qPCR that the H3K27me3 levels near the TSS of the PRL and IGFBP1 genes decreased to approximately 40 and 25% levels 4 days after induction of decidualization compared with the levels before induction of decidualization, and decreased to further lower levels (less than 10 and 5%, respectively) 8 days after induction of decidualization. In addition to the drastic increase of H3K27ac levels at the promoter regions of PRL and IGFBP1 genes, we also observed the decrease of H3K27me3 levels at these promoter regions upon decidualization ( & Supplementary Table 7). However, because the H3K27me3 levels of the PRL and IGFBP1 promoter regions in D0 cells were not higher than the selection criterion applied, these genes were not selected as genes with reciprocal changes of H3K27ac and H3K27me3 at their promoter region in this study.
The 38 downregulated genes upon decidualization with reciprocal changes of H3K27ac and H3K27me3 at their promoter also contain genes whose appropriate expression is critical for decidualization. Co-culture of endometrial cells overexpressing CRABP2 with trophoblast spheroids has been reported to impair spheroid expansion [Citation39]. Parathyroid hormone-like hormone encoded by the PTHLH gene has been shown to represses decidualization of human uterine fibroblast cells [Citation40]. These previous studies support the functional importance of downregulation of CRABP2 [Citation41] and PTHLH upon decidualization for successful pregnancy. Functional characterization of the other downregulated genes such as ADRA2A (encoding Adrenoceptor α2A) and WNT2 may lead to identify novel signaling pathways or further fine-tuning mechanisms of known signaling pathways essential for decidualization.
Array-based DNA methylation profiling of approximately 48,000 CpG sites for ESCs (D0) and decidualized cells (D4 and D8) revealed that the alterations of DNA methylation upon decidualization are very limited (), consistent with a previous report [Citation42]. This result does not exclude the possibility of the significant role of DNA methylation at specific loci that may not be covered by the DNA methylation array platform adopted in this study. Interestingly, Lucas et al. [Citation43] recently reported a possible involvement of non-CpG DNA methylation in endometrial decidualization. However, the array-based method utilized in this study is not designed to measure non-CpG methylation in a genome-wide manner. Therefore, it is important to further accumulate sequencing-based whole genome methylome data for ESCs and decidualized cells to elucidate the role of DNA methylation in the epigenetic regulation of decidualization and related diseases.
In the GO analysis for differentially expressed genes upon decidualization, we detected the GO term ‘nucleosome assembly’ as a term highly enriched among downregulated genes ( & Supplementary Table 3) due to the presence of nearly 20 histone genes that express replication-dependent nonpolyadenylated histone mRNAs. These histone genes were expressed in ESCs but were downregulated in decidualized cells as they stopped cell divisions. We were able to detect these nonpoly(A) transcripts in addition to poly(A) transcripts because we adopted a ribosomal RNA depletion protocol in RNA-seq library preparation. Detail analyses of our RNA-seq data may reveal unidentified roles of nonpoly(A) noncoding RNAs in decidualization.
In this study, we successfully obtained genome-wide profiles of an active promoter/enhancer mark (H3K27ac) and repressive chromatin marks (H3K9me3 and H3K27me3) in ESCs and decidualized cells, and mainly focused on their dynamics at gene promoter regions. Our dataset, including RNA sequencing data, provides a foundation to further elucidate molecular mechanisms governing decidualization through identifying critical cis/trans elements such as enhancers, transcription factors, noncoding RNAs and their interactions to promoters.
Although our study successfully obtained GE and three types of HM profiles for ESCs and decidualized cells showing sufficient reproducibility between two biological replicates, our study design has limitations in elucidating intrinsic and environmental factors that possibly affect the epigenomic status of the cells, such as patient history, phases of menstrual cycle from which the cells were originally isolated and the cell culture conditions (passage numbers, types and concentrations of reagents to induce decidualization and duration of their administration). Human genetic variations affect gene expression and disease susceptibility. Expression quantitative trait (eQTL) loci for endometrial gene expression have been identified as 18,595 cis expression regulatory SNPs for 198 genes recently [Citation44]. Genome-wide association studies have identified 12 SNPs (at ten independent loci) associated with endometriosis [Citation45]. Integration of the epigenomic profiles for ESCs and decidualized cells presented here with the datasets of the genetic variations relevant to the endometrial tissue and its related diseases is expected to facilitate elucidating molecular mechanisms through which genetic variants contribute to disease susceptibility. Our dataset (Supplementary Figure 3) serves as the reference for the future studies to examine the effects of genetic variants on the epigenome of ESCs and decidualized cells and for the comparison with GE and HM profiles obtained for ESCs and decidualized cells derived from the endometrial tissues of the patients with endometrial disorders such as endometriosis, recurrent miscarriage and implantation failure.
Supplemental Information 1
Download Zip (2.1 MB)Supplemental Table 1
Download PDF (53.6 KB)Supplemental Table 1
Download PDF (109.8 KB)Supplemental Table 1
Download MS Excel (557.1 KB)Supplemental Table 1
Download PDF (105.2 KB)Supplemental Table 1
Download PDF (82.3 KB)Supplemental Table 1
Download PDF (61.7 KB)Supplemental Table 1
Download MS Excel (677.9 KB)Supplemental Table 1
Download PDF (424.2 KB)Acknowledgements
The authors thank N Watanabe and A Matsumoto for their technical assistance to flow cytometry analysis and cell culture, respectively.
Financial & competing interests disclosure
This research was supported by AMED under Grant number JP17gm0510011 and JP17ek0109278 to K Hata and JSPS KAKENHI (Grant number JP17K08689) to K Nakabayashi. The authors have no other relevant affiliations or financial involvement with any organization or entity with a financial interest in or financial conflict with the subject matter or materials discussed in the manuscript apart from those disclosed.
The authors would like to thank Dr Clifford Andrew Kolba for English language editing.
Additional information
Funding
References
- Rock J , BartlettMK . Biopsy studies of human endometrium: criteria of dating and information about amenorrhea, menorrhagia, and time of ovulation . J. Am. Med. Assoc.108 ( 24 ), 2022 – 2028 ( 1937 ).
- Gellersen B , BrosensJJ . Cyclic decidualization of the human endometrium in reproductive health and failure . Endocr. Rev.35 ( 6 ), 851 – 905 ( 2014 ).
- Gellersen B , BrosensJ . Cyclic AMP and progesterone receptor cross-talk in human endometrium: a decidualizing affair . J. Endocrinol.178 ( 3 ), 357 – 372 ( 2003 ).
- Salker M , TeklenburgG , MolokhiaMet al. Natural selection of human embryos: impaired decidualization of endometrium disables embryo-maternal interactions and causes recurrent pregnancy loss . PLoS ONE5 ( 4 ), e10287 ( 2010 ).
- Brosens JJ , SalkerMS , TeklenburgGet al. Uterine selection of human embryos at implantation . Sci. Rep.4 , 3894 ( 2014 ).
- Garrido-Gomez T , DominguezF , QuiñoneroAet al. Defective decidualization during and after severe preeclampsia reveals a possible maternal contribution to the etiology . Proc. Natl Acad. Sci. USA114 ( 40 ), E8468 – E8477 ( 2017 ).
- Conrad KP , RabaglinoMB , Post UiterweerED . Emerging role for dysregulated decidualization in the genesis of preeclampsia . Placenta60 , 119 – 129 ( 2017 ).
- Aghajanova L , HorcajadasJA , WeeksJLet al. The protein kinase A pathway-regulated transcriptome of endometrial stromal fibroblasts reveals compromised differentiation and persistent proliferative potential in endometriosis . Endocrinology151 ( 3 ), 1341 – 1355 ( 2010 ).
- Klemmt PA , CarverJG , KennedySHet al. Stromal cells from endometriotic lesions and endometrium from women with endometriosis have reduced decidualization capacity . Fertil. Steril.85 ( 3 ), 564 – 572 ( 2006 ).
- Yin X , PavoneME , LuZet al. Increased activation of the PI3K/AKT pathway compromises decidualization of stromal cells from endometriosis . Clin. Endocrinol. Metab.97 ( 1 ), E35 – E43 ( 2012 ).
- Tabanelli S , TangB , GurpideE . In vitro decidualization of human endometrial stromal cells . J. Steroid Biochem. Mol. Biol.42 ( 3-4 ), 337 – 344 ( 1992 ).
- Zhou VW , GorenA , BernsteinBE . Charting histone modifications and the functional organization of mammalian genomes . Nat. Rev. Genet.12 ( 1 ), 7 – 18 ( 2011 ).
- Creyghton MP , ChengAW , WelsteadGGet al. Histone H3K27ac separates active from poised enhancers and predicts developmental state . Proc. Natl Acad. Sci. USA107 ( 50 ), 21931 – 21936 ( 2010 ).
- Munro SK , FarquharCM , MitchellMDet al. Epigenetic regulation of endometrium during the menstrual cycle . Mol. Hum. Reprod.16 ( 5 ), 297 – 310 ( 2010 ).
- Garrido-Gomez T , DominguezF , LopezJAet al. Modeling human endometrial decidualization from the interaction between proteome and secretome . J. Clin. Endocrinol. Metab.96 ( 3 ), 706 – 716 ( 2011 ).
- Zelenko Z , AghajanovaL , IrwinJCet al. Nuclear receptor, coregulator signaling, and chromatin remodeling pathways suggest involvement of the epigenome in the steroid hormone response of endometrium and abnormalities in endometriosis . Reprod. Sci.19 ( 2 ), 152 – 162 ( 2012 ).
- Grimaldi G , ChristianM , SteelJHet al. Down-regulation of the histone methyltransferase EZH2 contributes to the epigenetic programming of decidualizing human endometrial stromal cells . Mol. Endocrinol.25 ( 11 ), 1892 – 1903 ( 2011 ).
- Tamura I , AsadaH , MaekawaRet al. Induction of IGFBP-1 expression by cAMP is associated with histone acetylation status of the promoter region in human endometrial stromal cells . Endocrinology153 ( 11 ), 5612 – 5621 ( 2012 ).
- Tamura I , SatoS , OkadaMet al. Importance of C/EBPβ binding and histone acetylation status in the promoter regions for induction of IGFBP-1, PRL, and Mn-SOD by cAMP in human endometrial stromal cells . Endocrinology155 ( 1 ), 275 – 286 ( 2014 ).
- Tamura I , OhkawaY , SatoTet al. Genome-wide analysis of histone modifications in human endometrial stromal cells . Mol. Endocrinol.28 ( 10 ), 1656 – 1669 ( 2014 ).
- Masuda A , KatohN , NakabayashiKet al. An improved method for isolation of epithelial and stromal cells from the human endometrium . J. Reprod.62 ( 2 ), 213 – 218 ( 2016 ).
- Yoshida W , TomikawaJ , InakiMet al. An insulator element located at the cyclin B1 interacting protein 1 gene locus is highly conserved among mammalian species . PLoS ONE10 ( 6 ), e0131204 ( 2015 ).
- Miyata T , SonodaK , TomikawaJet al. Genomic, epigenomic, and transcriptomic profiling towards identifying omics features and specific biomarkers that distinguish uterine leiomyosarcoma and leiomyoma at molecular levels . Sarcoma2015 , 412068 ( 2015 ). doi:10.1155/2015/412068 .
- Takano M , LuZ , GotoTet al. Transcriptional cross talk between the forkhead transcription factor forkhead box O1A and the progesterone receptor coordinates cell cycle regulation and differentiation in human endometrial stromal cells . Mol. Endocrinol.21 ( 10 ), 2334 – 2349 ( 2007 ).
- Roadmap Epigenomics Consortium , KundajeA , MeulemanWet al.Integrative analysis of 111 reference human epigenomes . Nature518 ( 7539 ), 317 – 330 ( 2015 ).
- Steinhauser S , KurzawaN , EilsR , HerrmannC . A comprehensive comparison of tools for differential ChIP-seq analysis . Brief Bioinform.17 ( 6 ), 953 – 966 ( 2016 ).
- Li Q , KannanA , DasAet al. WNT4 acts downstream of BMP2 and functions via β-catenin signaling pathway to regulate human endometrial stromal cell differentiation . Endocrinology154 ( 1 ), 446 – 457 ( 2013 ).
- Kommagani R , SzwarcMM , VasquezYMet al. The promyelocytic leukemia zinc finger transcription factor is critical for human endometrial stromal cell decidualization . PLoS Genet.12 ( 4 ), e1005937 ( 2016 ).
- Macdonald LJ , SalesKJ , GrantVet al. Prokineticin 1 induces Dickkopf 1 expression and regulates cell proliferation and decidualization in the human endometrium . Mol. Hum. Reprod.17 ( 10 ), 626 – 636 ( 2011 ).
- Camden AJ , SzwarcMM , ChadchanSBet al. Growth regulation by estrogen in breast cancer 1 (GREB1) is a novel progesterone-responsive gene required for human endometrial stromal decidualization . Mol. Hum. Reprod.23 ( 9 ), 646 – 653 ( 2017 ).
- Kuroda K , VenkatakrishnanR , SalkerMSet al. Induction of 11β-HSD 1 and activation of distinct mineralocorticoid receptor- and glucocorticoid receptor-dependent gene networks in decidualizing human endometrial stromal cells . Mol. Endocrinol.27 ( 2 ), 192 – 202 ( 2013 ).
- Almada M , AmaralC , Diniz-da-CostaMet al. The endocannabinoid anandamide impairs in vitro decidualization of human cells . Reproduction152 ( 4 ), 351 – 361 ( 2016 ).
- Sun X , DengW , LiYet al. Sustained endocannabinoid signaling compromises decidual function and promotes inflammation-induced preterm birth . J. Biol. Chem.291 ( 15 ), 8231 – 8240 ( 2016 ).
- Bariani MV , Domínguez RubioAP , CellaMet al. Role of the endocannabinoid system in the mechanisms involved in the LPS-induced preterm labor . Reproduction150 ( 6 ), 463 – 472 ( 2015 ).
- Economos K , MacDonaldPC , CaseyML . Endothelin-1 gene expression and protein biosynthesis in human endometrium: potential modulator of endometrial blood flow . J. Clin. Endocrinol. Metab.74 ( 1 ), 14 – 19 ( 1992 ).
- Gibson DA , SimitsidellisI , CousinsFLet al. Intracrine androgens enhance decidualization and modulate expression of human endometrial receptivity genes . Sci. Rep.28 ( 6 ), 19970 ( 2016 ).
- Elnashar AM , Aboul-EneinGI . Endometrial receptivity . Middle East Fertil. Soc. J.9 ( 1 ), 10 – 24 ( 2004 ).
- Li JY , ParagasN , NedRMet al. Scara5 is a ferritin receptor mediating non-transferrin iron delivery . Dev. Cell16 ( 1 ), 35 – 46 ( 2009 ).
- Lee J , OhJS , ChoC . Impaired expansion of trophoblast spheroids cocultured with endometrial cells overexpressing cellular retinoic acid-binding protein 2 . Fertil. Steril.95 ( 8 ), 2599 – 2601 ( 2011 ).
- Sherafat-Kazemzadeh R , SchroederJK , KesslerCAet al. Parathyroid hormone-like hormone (PTHLH) represses decidualization of human uterine fibroblast cells by an autocrine/paracrine mechanism . J. Clin. Endocrinol. Metab.96 ( 2 ), 509 – 514 ( 2011 ).
- Ozaki R , KurodaK , IkemotoYet al. Reprogramming of the retinoic acid pathway in decidualizing human endometrial stromal cells . PLoS ONE 201712 , e0173035 ( 2017 ).
- Dyson MT , RoqueiroD , MonsivaisDet al. Genome-wide DNA methylation analysis predicts an epigenetic switch for GATA factor expression in endometriosis . PLoS Genet.10 ( 3 ), e1004158 ( 2014 ).
- Lucas ES , DyerNP , MurakamiKet al. Loss of endometrial plasticity in recurrent pregnancy loss . Stem Cells34 ( 2 ), 346 – 356 ( 2016 ).
- Zondervan KT , RahmiogluN , MorrisAPet al. Beyond endometriosis genome-wide association study: from genomics to phenomics to the patient . Semin. Reprod. Med.34 ( 4 ), 242 – 54 ( 2016 ).
- Fung JN , GirlingJE , LukowskiSWet al. The genetic regulation of transcription in human endometrial tissue . Hum. Reprod.32 ( 4 ), 893 – 904 ( 2017 ).