
Abstract
Aim: To test whether DNA samples stored for a prolonged period (20 years) under various storage conditions could be used for comparative methylation studies using reduced representation bisulfite sequencing. Patients & methods: Five groups of human blood DNA samples (n = 5–6/group) were compared. The groupings were based on the anticoagulant used and storage temperature and duration. Results: Methylation profiles of defined genomic regions in the DNA or blood samples archived for 20 years were similar across all storage temperatures, including 4°C. The level of intersample similarity in archived samples was not significantly different than that in recently collected samples. Conclusion: Archived samples, including DNA stored at 4°C for 20 years, are suitable for comparative studies of DNA methylation.
Epigenetic modifications are chromatin-based mechanisms that alter gene expression without changes to the DNA sequence. They are considered key to explain differential gene expressions across different cell types in the same organism and define gene–environment interactions. DNA methylation is the most widely studied epigenetic modification [Citation1–4]. In the human genome, methylation changes generally occur at the cytosine residue of cytosine-phosphate-guanine (CpG) dinucleotides. Addition of methyl (-CH3) groups to the DNA can change transcriptional activities and regulate gene expression. A growing number of human diseases have been found to be associated with aberrant DNA methylation, therefore, identification of specific DNA methylation marks associated with a disease can hold great promise for the development of novel diagnostic, prognostic, and/or predictive markers [Citation5–7].
The number of studies evaluating DNA methylation changes are rapidly increasing and are highly dependent on analyzing archived DNA samples (often for decades) collected prior to the availability of DNA sequencing techniques for methylation analyses. In addition, DNA may have been extracted from blood collected for different parent study demands, for example, blood collection tubes containing various anticoagulants, such as ethylenediaminetetraacetic acid (EDTA) or acid-citrate-dextrose (ACD). Blood samples or the extracted DNA may have been stored at -20°C, -80°C, or in liquid nitrogen. Some studies store DNA samples at 4°C for a variety of reasons including avoidance of freeze–thaw cycles. Duration of storage can vary from a few days to decades. Different methods of sample collection, storage conditions, and storage durations may have a potential to affect methylation profiles [Citation8]. In addition, DNA methylation analyses methods have also evolved with reduced representation bisulfite sequencing (RRBS) being one of the most commonly used techniques at the present time in contrast to methylation chip studies of the past.
Hebels et al. reported that there were no systematic influences of anticoagulant (ACD, EDTA, or heparin), storage temperature conditions (-80°C or liquid N2), or storage duration (13–17 years) on the DNA yield or quality of methylation profiles provided that DNA samples were from the buffy coats and stored at -80°C within 8h of extraction [Citation9,Citation10]. DNA methylation was analyzed with methylation chips in this study. However, it is unknown whether DNA samples stored for varying durations of time under 4°C, especially after years of storage, could still maintain stable methylation profiles when DNA methylation is measured by bisulfite sequencing. In the present study, we compared methylation profiles of DNA (measured by bisulfite sequencing) extracted from peripheral frozen or fresh blood samples collected in EDTA- or ACD-containing tubes and stored up to a period of 20 years at 4 or -20°C.
Methods
Subjects
Subjects involved in the current study were taken from a parent study entitled “Genes for Hypertension in African Americans”. The parent study included approximately 3000 African-American subjects between the ages of 18 and 55 years recruited between 1994 and 2007. After the subjects provided an informed consent, they were evaluated during a screening visit (for a subsequent elaborate phenotyping study) at which time blood samples were collected for DNA extraction along with some baseline phenotypic measurements. The study was approved by the local Institutional Review Board. After 18–20 years, some of the subjects returned to participate in a follow-up study (present day) and blood samples were obtained from these subjects and DNA was extracted [Citation11].
Sample grouping
Representative DNA samples from the above subjects were divided into five groups (Groups 1–5, n = 5–6/group) based on storage temperature, storage duration, and the anticoagulant used: Group 1 (G1, n = 6): Blood samples were collected, in vacutainers with EDTA as the anticoagulant, from subjects recruited in 1996. DNA was extracted on the day of collection from the whole blood using Puregene Blood Core Kit A (Qiagen, Venlo, The Netherlands; Catalog# 1042604), and has been stored at 4°C since 1996 until the time of DNA library preparation and methylation sequencing in 2016; Group 2 (G2, n = 6): This group contains DNA from the same subjects as in G1, extracted in 1996. In 2009, however, a small amount of DNA was diluted to 10 ng/μl concentration and aliquoted into a new tube to conduct another study (after 13 years at 4°C). The diluted DNA was subsequently stored at -20°C sealed in 96-well plates until library preparation for methylation sequencing in 2016; Group 3 (G3, n = 6): During the above-mentioned screening visit, blood was also collected from the same subjects as G1 in 1996 in vacutainers containing ACD as the anticoagulant, however, DNA was not extracted at the time of collection. These whole-blood-containing tubes were stored at -80°C since the day of collection. In 2016, these whole blood samples were thawed quickly in a 37°C water-bath and genomic DNA was extracted using the Puregene Blood Core Kit A (Qiagen, Venlo, The Netherlands; catalog # 1042604) according to manufacturer’s instructions. Libraries were prepared from this DNA for methylation sequencing in 2016; Group 4 (G4, n = 5): In late 2015, subjects who were studied in 1990s were recalled to the translational research unit for a follow-up assessment during which time blood was collected in tubes with EDTA as anticoagulant and DNA was extracted on the same day of collection (<4 h from the time of collection). DNA was stored at -20°C until libraries were prepared in 2016 (<3 months from DNA extraction); Groups 5 (G5, n = 5): In late 2015, blood was also collected in yellow-top (ACD as anticoagulant) tubes and DNA extracted on the same day of collection (<4 h from the time of collection). DNA was stored at 4°C until libraries were prepared in 2016 (<3 months from DNA extraction). Details of sample storage are described in .
Table 1. Classification of groups (G1–G5) based on storage durations and conditions.
We selected archived samples from the year 1996 for G1–G3 as these were some of our oldest samples. Our assumption is that if the DNA methylation integrity is preserved in these older samples, it is likely that the integrity of more recent samples would be preserved as well. Samples in G1–G3 were from the same subjects.
DNA methylation profiling
Sequencing analysis was performed on DNA samples from all groups (G1–G5). RRBS method was used to quantify methylation levels at single-base resolution. A total of 28 DNA samples were prepared as 33 libraries with five samples from G1, G2, or G3 replicated to control for the variation across sequencing lanes (). Libraries for RRBS were generated according to protocols described by Gu et al. [Citation12], followed by sequencing (per Illumina protocols) with modifications to allow multiplexing [Citation13]. The libraries underwent cluster generation using TruSeq PE Cluster Kit v4-cBot-HS and 100 cycles of paired-end sequencing using TruSeq SBS Kit v4-HS (Illumina, San Diego, CA, USA). 33 libraries were sequenced in three lanes. In each lane, libraries were multiplexed in a 350-Gb flowcell on an Illumina HiSeq 2500 sequencer.
Analysis of methylation sequencing data
Methylation sequence reads were obtained from Illumina HiSeq 2500 with paired-end reads of 100 bp in read length. Prior to the analysis, the raw sequences were processed and trimmed as previously described [Citation13,Citation14]. The trimmed short reads were mapped to the human reference genome (hg19) downloaded from the UCSC Genome Browser (http://hgdownload.soe.ucsc.edu/goldenPath/hg19/database/) using Bismark (v0.16.1) [Citation15]. Short read aligner bowtie2 (2.2.4) was used in the analyses [Citation16]. For each CpG site, the 5mC rate was calculated as the percentage of unconverted cytosines in each library. Bisulfite conversion rates were estimated from the number of unconverted cytosines at Klenow filled-in 3′MspI sites of sequencing reads that were short enough to read through these sites.
We divided genomic regions of interest into five groups including transcription start site (TSS), promoter, gene body, CpG islands (CGI), and CGI shore. TSS regions were defined as 1 kb upstream or downstream of the TSS of a transcript (UCSC gene annotation, hg19). Predicted positions of promoter regions were obtained from the UCSC Genome Browser. The gene body was defined as a region between the start and end of a transcript. The genomic positions of CGI for hg19 were downloaded from the UCSC Genome Browser. CpG shores were defined as ±2 kb flanking the islands.
Statistical analysis
All statistical analysis was performed using the R statistical package. Hierarchical clustering analysis (HCA) was applied to detect batch effects from different sequencing runs. ComBat [Citation17], an empirical Bayesian method which could robustly handle high-dimensional data when sample sizes are small, was applied to adjust the batch effects of data from three different sequencing runs. Correlation analysis was performed to evaluate strength of relationships between methylation profiles within same subjects under different storage conditions and different subjects within same storage conditions. Pair-wise Wilcoxon rank-sum test was used to test differences in correlation coefficients between two groups. The significance of difference was determined with Benjamin–Hochberg (BH) adjusted false-discovery rate (FDR) of <0.05. Kruskal–Wallis rank-sum test was performed to test the differences between more than two groups. Significance level was set at p < 0.05.
Results
DNA methylation profiles with batch effect adjustment
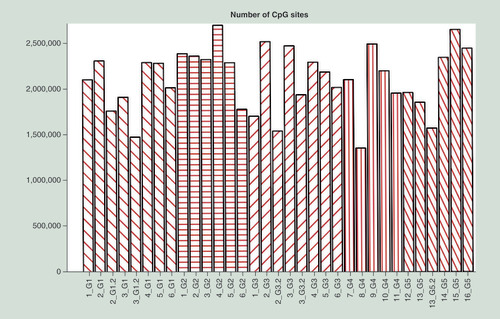
DNA methylation patterns were profiled in five groups of DNA samples using the RRBS protocol. The average bisulfite conversion rate was 99.6%. Approximately 25.1 million reads from each sample were uniquely mapped to the reference genome (hg19) (Supplementary Tables 1 & 2). On average, 2.11 million (range: 1.35–2.70 million) CpG sites were covered by at least ten reads in each library ().
CpG: Cytosine-phosphate-guanine
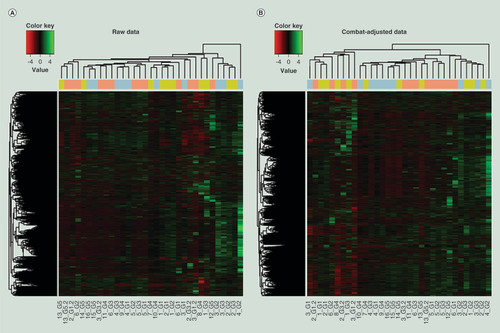
HCA using raw DNA methylation data (A) showed that samples tended to cluster into groups from the same sequencing run, suggesting systematic batch effects among sequencing lanes. Therefore, we applied ComBat to adjust for batch effect among sequencing lanes. HCA was done again on ComBat-adjusted methylation data. As shown in B, DNA samples were largely mixed across different sequencing runs, suggesting that batch effects were mitigated. Therefore, the downstream data analysis was conducted on ComBat-adjusted methylation profiles.
Each row represents a CpG site and each column depicts methylation data from a subject sample. The horizontal color bar at the top of the graph indicates grouping of samples based on RRBS runs (green – Lane A, blue – Lane B and pink – Lane C). (A) Heat map based on raw DNA methylation profiles from G1–G5. (B) Heat map based on ComBat-adjusted DNA methylation profiles from G1–G5.
CpG: Cytosine-phosphate-guanine; RRBS: Reduced representation bisulfite sequencing.
Comparison of DNA methylation profiles of samples stored for approximately 20 years under different storage conditions (Groups 1–3)
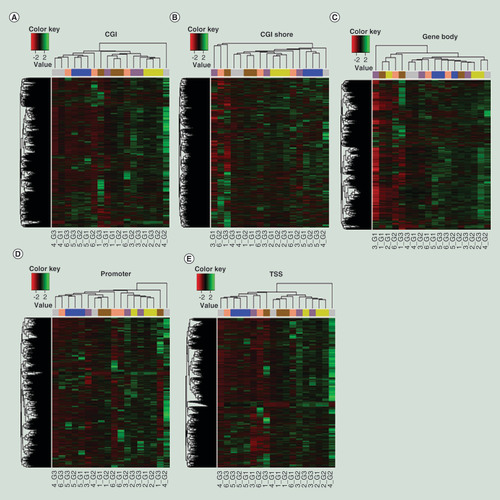
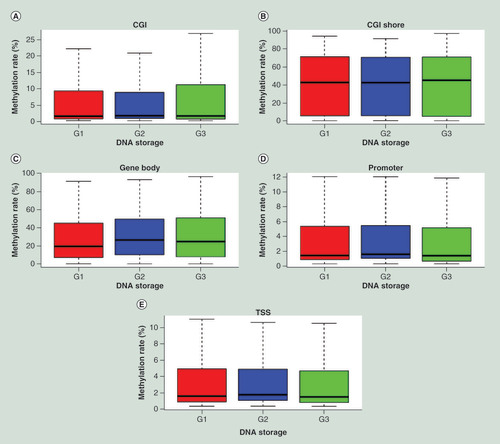
To determine if a sample has similar DNA methylation profiles after 20 years of storage at 4°C, 4/-20°C in the form of DNA, or -80°C in the form of frozen blood, samples from groups G1–G3 (n = 6/group) were examined. Samples in these groups were obtained from the same subjects. HCA was applied to methylation levels at different genomic regions (TSS, promoter, gene body, CGI, and CGI shore). Heat maps indicate that DNA samples under different storage conditions from the same subject tend to have similar DNA methylation patterns regardless of the genomic region analyzed (A–E). We then evaluated the strength of correlation between methylation profiles of DNA samples under three different storage conditions (G1–G3) for a given subject and between different subjects under the same storage conditions. On an average, the correlation coefficients () between DNA methylation profiles of the same subject under different storage conditions (G1–G3) were around 0.995 at CGI, 0.985 at CGI shore, 0.973 at gene body, 0.982 at promoter, and 0.988 at TSS. The correlation coefficients of methylation profiles between different storage conditions from the same subjects were generally higher than those between any two subjects. Methylation levels in each type of genomic region for the same sample across storage conditions were further compared. The median methylation level was approximately 2% at CGI, 40% at CGI shore, 30% at gene body, 1.5% at promoter, and 2% at TSS and was similar within the same subject’s DNA across storage conditions examined. The data from a representative subject (1_G1, G2 and G3) are shown in A–E. The other five subjects are shown in Supplementary Figures 1–5. Methylation levels in each type of genomic region were also similar across subjects. The results of these analyses indicate that DNA methylation profiles are similar between the DNA samples stored in three different conditions when examined after 20 years of storage.
Heat maps based on ComBat-adjusted DNA methylation profiles in CGI (A), CGI shore (B), gene body (C), promoter (D) and TSS (E) genomic regions. Each color in the top horizontal bar indicates a different subject.
CGI: Cytosine-phosphate-guanine island; CpG: Cytosine-phosphate-guanine; TSS: Transcription start site.
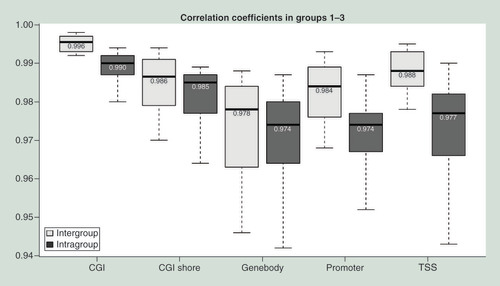
Boxplots with correlation coefficients based on ComBat-adjusted methylation profiles of DNA samples between storage conditions (G1–G3) for a given subject and between different subjects under the same storage condition. Intergroup: Same subjects in different groups. Intragroup: Different subjects in the same group.
CGI: Cytosine-phosphate-guanine island; TSS: Transcription start site.
Boxplots based on ComBat-adjusted DNA methylation profiles of subject 1’s DNA sample under different storage conditions (G1–G3) in CGI (A), CGI shore (B), gene body (C), promoter (D) and TSS (E) regions.
CGI: Cytosine-phosphate-guanine island; TSS: Transcription start site.
Comparison of DNA methylation profiles of samples stored for different durations (Groups 1–5)
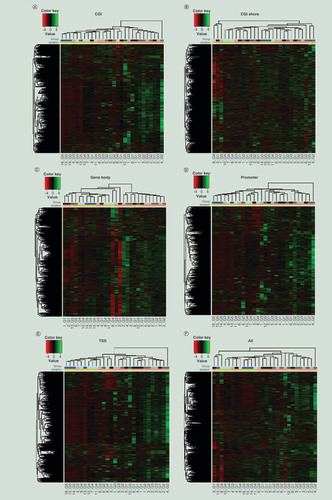
To determine if the storage duration has an impact on methylation, DNA methylation profiles of samples from all five groups (G1–G3: 20 years [archived] and G4–G5: <3 months [recent]) were compared by applying HCA to methylation levels at different genomic regions (TSS, promoter, gene body, CGI, and CGI shore). Heat maps indicate that these DNA samples are likely to cluster based on storage duration (archived vs recent) regardless of the genomic region analyzed (A–F).
Heat map based on ComBat-adjusted DNA methylation profiles in CGI (A), CGI shore (B), gene body (C), promoter (D), TSS (E), and all genomic regions (F) of G1–G5. Each color in horizontal bars indicates different groups (Top: grey – G1, medium grey – G2, light grey – G3, light blue – G4, blue – G5) and storage durations and (Bottom: yellow – recent and pink – archived).
CGI: Cytosine-phosphate-guanine island, TSS: Transcription start site.
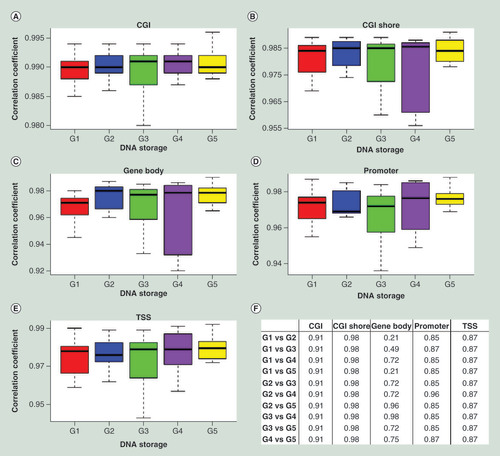
The differences in methylation profiles between archived and recent samples may be due to several factors. However, if the degree of similarity across samples from long-term storage is comparable to that from recent samples, we can conclude that even if DNA methylation is altered during long-term storage, it is altered in a way that is consistent across samples. To assess the similarity between archived and recent samples, the strength of correlation between DNA methylation profiles of different samples was calculated under each of the five storage conditions. Average correlation coefficients of DNA methylation profiles of different subjects across storage conditions G1–G5 were 0.988 at CGI, 0.980 at CGI shore, 0.970 at gene body, 0.971 at promoter, and 0.975 at TSS. As shown in A–E, the distribution of correlation coefficients of DNA methylation levels between different subjects in each storage condition at different genomic regions was similar across all five storage conditions. BH-adjusted FDRs of pair-wise Wilcoxon rank-sum test (F) were all greater than 0.05, indicating no statistically significant difference between any two storage conditions (G1–G5) at all genomic regions. Furthermore, BH-adjusted FDR of Kruskal–Wallis rank-sum test was 0.87 at CGI, 0.87 at CGI shore, 0.87 at gene body, 0.87 at promoter, and 0.87 at TSS. These correlation data indicate that the degrees of similarity in DNA methylation profiles between samples are not statistically significantly different among various storage durations tested, including archived (20 years) and recent (<3 months) samples. This supports the validity of studies comparing samples from long-term storage.
(A–E) Boxplots of correlation coefficients between methylation profiles of DNA samples between individuals under the same storage condition (G1–G5) among genomic regions CGI, CGI shore, gene body, promoter and TSS. G1 G2 G3 G4 G5. See for abbreviations of genomic regions. (F) Benjamin–Hochberg-adjusted FDR of pair-wise Wilcoxon rank-sum test of correlation coefficients between methylation profiles of DNA samples between individuals under the same storage condition (G1–G5).
CGI: Cytosine-phosphate-guanine island; FDR: False-discovery rate; TSS: Transcription start site.
Comparison of DNA methylation profiles of samples from Groups 3 & 4
Strength of correlations between methylation profiles of DNA extracted from blood collected in ACD vacutainer and archived at -80°C for 20 years (G3) and recent blood samples collected in ACD vacutainer and stored at 4°C for a few hours (G4) were compared. As shown in A–E, the average correlation coefficients of DNA methylation in CGI, CGI shore, gene body, promoter, and TSS from individuals in G3 were 0.990, 0.984, 0.977, 0.975, and 0.978, respectively. The corresponding average correlation coefficients from G4 were 0.990, 0.981, 0.966, 0.971, and 0.974. The similar correlation coefficients of DNA methylation profiles of samples in G3 and G4 indicate there were no systematic differences between these two groups. The same conclusion was also supported by pair-wise Wilcoxon rank-sum test with BH-adjusted FDR of 0.779, 0.745, 0.140, 0.507, and 0.507, respectively. These results suggest that duration of storage of samples collected in ACD does not significantly impact methylation profiles or, if it does, DNA methylation profiles were altered consistently across samples.
Comparison of DNA methylation profiles of samples collected with different anticoagulants (Groups 4 & 5)
Methylation rates were compared initially by HCA in DNA samples extracted from blood collected with two different anticoagulants (G4: ACD and G5: EDTA). Heat maps (A–F) showed that these samples clustered by the anticoagulant group (G4 or G5), suggesting that methylation profiles differ based on the type of anticoagulant used. As shown in A–E, the average correlation coefficients of DNA methylation in CGI, CGI shore, gene body, promoter, and TSS from subjects in G4 were 0.988, 0.974, 0.955, 0.960 and 0.970. The corresponding average correlation coefficients from subjects in G5 were 0.988, 0.983, 0.975, 0.967, and 0.973. However, there were no significant differences in correlation coefficients between the groups as evidenced by pair-wise Wilcoxon rank-sum test with BH-adjusted FDR of 0.820, 0.820, 0.820, 0.820, and 0.820. Although DNA methylation profiles were not identical with different anticoagulants (ACD and EDTA), there were no statistically significant differences between the correlation coefficients of the two groups.
Heat map based on ComBat-adjusted DNA methylation profiles in CGI (A); CGI shore (B); gene body (C); promoter (D); TSS (E) and all the genomic regions (F) of G4 and G5. Each color in the top horizontal bar indicates different anticoagulant group (blue – G4 [ACD] and pink – G5 [EDTA]).
ACD: Acid-citrate-dextrose; CGI: Cytosine-phosphate-guanine island; EDTA: Ethylenediaminetetraacetic acid; TSS: Transcription start site.
![Figure 8. Methylation profiles at various genomic regions differ based on the anticoagulant used (acid-citrate-dextrose vs ethylenediaminetetraacetic) at the time of blood sample collection.Heat map based on ComBat-adjusted DNA methylation profiles in CGI (A); CGI shore (B); gene body (C); promoter (D); TSS (E) and all the genomic regions (F) of G4 and G5. Each color in the top horizontal bar indicates different anticoagulant group (blue – G4 [ACD] and pink – G5 [EDTA]).ACD: Acid-citrate-dextrose; CGI: Cytosine-phosphate-guanine island; EDTA: Ethylenediaminetetraacetic acid; TSS: Transcription start site.](/cms/asset/4bd0c158-ac7b-4955-9ee4-173a8a39bf4d/iepi_a_12323850_f0008.jpg)
Discussion
In this study, we found that within the same subject, DNA extracted on the same day of blood sample collection and stored at 4°C for 20 years showed similar methylation patterns and distribution and high levels of correlation to DNA samples (similarly extracted) stored at -20°C for at least part of the time and DNA extracted from the blood thawed 20 years after it was frozen at -80°C. Importantly, although DNA methylation profiles of archived and recent samples tended to cluster separately, intersubject correlation levels within each group were similarly high in archived and fresh samples. It suggests any alterations of methylation that might occur during long-term storage are consistent across samples. Therefore, archived samples are suitable for comparative methylation studies.
In addition, we found that methylation profiles tended to cluster based on the type of anticoagulant (EDTA or ACD) used at the time of blood draw. However, the correlation coefficients with in each group were not significantly different indicating that differences are consistent across samples. However, it is reasonable to recommend caution while comparing methylation profiles of DNA extracted with different anticoagulants.
Long-term storage of DNA is of vital importance for clinical research, and heterogeneity of DNA storage conditions may impact results of studies, especially those evaluating phenomena unrelated to the DNA sequence, for example, methylation. Freezing is the most common method used for storing the extracted DNA and studies indicate that methylation profiles are not disturbed when libraries are prepared and sequenced from these samples [Citation9]. One study also showed that methylated DNA standards were stable for 5 years at -20°C [Citation18]. However, for a variety of reasons, such as a need to avoid freeze–thaw cycles, lack of freezer storage space and back-up generators, or improper shipping methods, DNA may not have been stored under these ideal conditions. In this study, for the first time, we show that long-term DNA storage at 4°C does not disturb the integrity of samples, as analyzed by RRBS, any more than frozen storage.
The comparison of G1–G3 indicated DNA methylation profiles were similar between the three conditions (frozen vs refrigeration) examined after 20 years of storage. However, the critical question for any study considering usage of samples from long-term storage (e.g., 20 years of storage at 4°C) is whether DNA methylation profiles would be comparable to recently collected samples. To address this question, one would ideally want to divide a sample into aliquots, analyze some aliquots immediately and the other decades later, and compare the data. However, this is impractical. And, in the case of RRBS analysis, it is impossible since the RRBS technique has become available only within the last decade. We reasoned that we could address this question to a significant extent by examining the similarity of methylation profiles between recent samples and archived samples from long-term storage. Small differences noted in methylation profiles between archived and recent samples suggest DNA methylation might have degraded during long-term storage but could also be the result of a variety of factors such as materials, procedures or operators involved in blood collection and processing. However, based on correlations of DNA methylation profiles we observed, we concluded that even if DNA methylation is slightly altered during long-term storage, it is altered in a way that is consistent across samples, which would support the validity of studies comparing samples from long-term storage.
In our comparisons of frozen and fresh blood to extract DNA, we showed that methylation profiles are not disturbed by freezing and subsequent thawing of the whole blood to extract the DNA. In a previous study by Bulla et al., storage of blood samples at room temperature, 4°C, -20°C and -80°C for over a year did not interfere with methylation levels [Citation8]. Another study evaluated archived neonatal dried blood spot samples for methylome profiling and found it suitable even after 26–28 years [Citation19]. Our study extends these findings substantially and indicates that frozen whole blood is viable for methylation analysis for up to 20 years. Few other studies have evaluated methylation levels in tissues under various conditions and came to similar conclusions about the stability of methylation profiles [Citation19–22]. These studies indicate frozen blood can be utilized to extract DNA at a much later time for methylation analysis.
Our study is unique on several fronts including analyses of same subject samples under different conditions (G1–G3), performance of near genome-wide methylation sequencing, as well as comparison with recently collected DNA with DNA collected 20 years prior. Limitations include inability to generalize these findings to non-RRBS-based methods for methylation sequencing, small sample size and that the recent blood samples were not obtained from the same subjects as subjects from whom blood was obtained 20 years ago. In addition, we acknowledge that even though global methylation profiles were not statistically significantly different, targeted methylated sites may show some differences with varying storage conditions and durations. Despite these, our results are robust in showing the stability of DNA methylation profiles under a variety of conditions. However, caution must be exercised while comparing methylation profiles of blood samples collected under different conditions and it is advisable to keep the conditions as similar as possible.
Epigenetic modifications seem to be involved in development and progression of many diseases and study of epigenomics is an emerging field [Citation2,Citation3,Citation23,Citation24]. Large studies are often needed to establish pivotal links and need to use archived DNA samples to investigate if methylation patterns at an earlier stage in life contribute to or are predictive of subsequent disease progression at a later stage in life. Our findings support the suitability of using DNA samples stored for decades under various conditions for epigenetics studies. Use of these DNA samples will allow us to achieve the large sample sizes needed for a properly powered study and take advantage of the availability of years of information on disease progression after DNA collection.
Main objective of our project was to test whether DNA samples stored for prolonged periods under various storage conditions could be used for comparative methylation studies.
We used five groups of human blood or DNA samples (n = 5–6/group) for the study; the groupings were based on the anticoagulant used and storage temperature and duration.
Methylation sequencing was conducted using reduced representation bisulfite sequencing method.
DNA extracted and stored at 4°C for 20 years showed similar methylation patterns and distribution to DNA samples stored at -20°C for at least part of the time or blood samples stored at -80°C for 20 years.
DNA methylation profiles of archived and recent samples tended to cluster separately, indicating some methylation might be lost with longer duration of storage.
Intersubject correlation levels within each group were similarly high in archived and fresh samples suggesting that any alterations in methylation that might occur during long-term storage are consistent across samples.
DNA methylation profiles from blood samples collected with different anticoagulants (acid-citrate-dextrose vs ethylenediaminetetraacetic) also tended to cluster separately, however, intersubject correlation within each group was similarly high indicating consistency across samples.
Caution must be exercised while comparing methylation profiles of blood samples collected under different conditions and it is advisable to only compare DNA samples from similar storage and collection conditions.
The main conclusion of our study is that archived DNA samples, including those stored at 4°C for years, are suitable for comparative methylation studies.
Ethical conduct of research
The authors state that they have obtained appropriate institutional review board approval or have followed the principles outlined in the Declaration of Helsinki for all human or animal experimental investigations. In addition, for investigations involving human subjects, informed consent has been obtained from the participants involved.
Supplemental application 1
Download MS Word (1.3 MB)Supplementary data
To view the supplementary data that accompany this paper please visit the journal website at: www.tandfonline.com/doi/suppl/10.2217/epi-2018-0025
Financial & competing interests disclosure
This work was supported by the American Heart Association (15SFRN23910002). The authors have no other relevant affiliations or financial involvement with any organization or entity with a financial interest in or financial conflict with the subject matter or materials discussed in the manuscript apart from those disclosed.
No writing assistance was utilized in the production of this manuscript.
Additional information
Funding
References
- Bock C . Analysing and interpreting DNA methylation data . Nat. Rev. Genet.13 ( 10 ), 705 – 719 ( 2012 ).
- Egger G , LiangG , AparicioA , JonesPA . Epigenetics in human disease and prospects for epigenetic therapy . Nature429 ( 6990 ), 457 – 463 ( 2004 ).
- Jones PA . Functions of DNA methylation: islands, start sites, gene bodies and beyond . Nat. Rev. Genet.13 ( 7 ), 484 – 492 ( 2012 ).
- Pogribny IP . Epigenetic events in tumorigenesis: putting the pieces together . Exp. Oncol.32 ( 3 ), 132 – 136 ( 2010 ).
- Robertson KD . DNA methylation and human disease . Nat. Rev. Genet.6 ( 8 ), 597 – 610 ( 2005 ).
- Baccarelli A , WrightR , BollatiVet al. Ischemic heart disease and stroke in relation to blood DNA methylation . Epidemiology21 ( 6 ), 819 – 828 ( 2010 ).
- Deneberg S , GrovdalM , KarimiMet al. Gene-specific and global methylation patterns predict outcome in patients with acute myeloid leukemia . Leukemia24 ( 5 ), 932 – 941 ( 2010 ).
- Bulla A , De WittB , AmmerlaanW , BetsouF , LescuyerP . Blood DNA yield but not integrity or methylation is impacted after long-term storage . Biopreserv. Biobank.14 ( 1 ), 29 – 38 ( 2016 ).
- Hebels DG , GeorgiadisP , KeunHCet al. Performance in omics analyses of blood samples in long-term storage: opportunities for the exploitation of existing biobanks in environmental health research . Environ. Health Perspect.121 ( 4 ), 480 – 487 ( 2013 ).
- Ferrer I , MartinezA , BoludaS , ParchiP , BarrachinaM . Brain banks: benefits limitations and cautions concerning the use of post-mortem brain tissue for molecular studies . Cell Tissue Bank.9 ( 3 ), 181 – 194 ( 2008 ).
- Kidambi S , GhoshS , KotchenJMet al. Non-replication study of a genome-wide association study for hypertension and blood pressure in African-Americans . BMC Med. Genet.13 , 27 , PMCID:PMC3349540 ( 2012 ).
- Gu H , SmithZD , BockC , BoyleP , GnirkeA , MeissnerA . Preparation of reduced representation bisulfite sequencing libraries for genome-scale DNA methylation profiling . Nat. Protoc.6 ( 4 ), 468 – 481 ( 2011 ).
- Liu Y , LiuP , YangC , CowleyAWJr , LiangM . Base-resolution maps of 5-methylcytosine and 5-hydroxymethylcytosine in Dahl S rats: effect of salt and genomic sequence . Hypertension63 ( 4 ), 827 – 838 ( 2014 ).
- Geurts AM , MattsonDL , LiuPet al. Maternal diet during gestation and lactation modifies the severity of salt-induced hypertension and renal injury in Dahl salt-sensitive rats . Hypertension65 ( 2 ), 447 – 455 ( 2015 ).
- Krueger F , AndrewsSR . Bismark: a flexible aligner and methylation caller for Bisulfite-Seq applications . Bioinformatics27 ( 11 ), 1571 – 1572 ( 2011 ).
- Langmead B , SalzbergSL . Fast gapped-read alignment with Bowtie 2 . Nat. Methods9 ( 4 ), 357 – 359 ( 2012 ).
- Johnson WE , LiC , RabinovicA . Adjusting batch effects in microarray expression data using empirical Bayes methods . Biostatistics8 ( 1 ), 118 – 127 ( 2007 ).
- Osborne MR , PhillipsDH . Preparation of a methylated DNA standard, and its stability on storage . Chem. Res. Toxicol.13 ( 4 ), 257 – 261 ( 2000 ).
- Huang HS , MatevossianA , JiangY , AkbarianS . Chromatin immunoprecipitation in postmortem brain . J. Neurosci. Methods156 ( 1–2 ), 284 – 292 ( 2006 ).
- Santpere G , PuigB , FerrerI . Low molecular weight species of tau in Alzheimer’s disease are dependent on tau phosphorylation sites but not on delayed postmortem delay in tissue processing . Neurosci. Lett.399 ( 1–2 ), 106 – 110 ( 2006 ).
- Vilahur N , BaccarelliAA , BustamanteMet al. Storage conditions and stability of global DNA methylation in placental tissue . Epigenomics5 ( 3 ), 341 – 348 ( 2013 ).
- Jenkins TG , ShamsiMB , JamesE , AstonKI , CarrellaDT . Thermo stability of DNA methylation marks in human sperm . J. Genet. Genome Res.4 ( 1 ), 30 ( 2017 ).
- Meissner A . Epigenetic modifications in pluripotent and differentiated cells . Nat. Biotechnol.28 ( 10 ), 1079 – 1088 ( 2010 ).
- Reik W . Stability and flexibility of epigenetic gene regulation in mammalian development . Nature447 ( 7143 ), 425 – 432 ( 2007 ).