
Abstract
Aim: The aim of this study was to identify mRNA targets of dysregulated miRNAs through the integrated analysis of miRNA and mRNA expression profiling in pulmonary tuberculosis (PTB) patients versus healthy individuals. Materials & methods: Expression profiles in blood obtained from PTB patients and healthy individuals were analyzed using high-throughput sequencing. Results: Forty-one differentially expressed miRNAs and 2565 mRNAs were obtained. A large number of the differentially expressed mRNAs and miRNAs were related to immune-related pathways, particularly the tuberculosis, phagosome and MAPK signaling pathway. Three hundred and fifty-nine potential target genes were identified for 41 differentially expressed miRNAs. Many of target genes were enriched to phagosome, calcium and insulin signaling pathway. Conclusion: The mRNA–miRNA regulatory networks described here provide new insights for further elucidation of PTB pathogenesis.
Keywords::
Tuberculosis (TB) is a disease with a history interwoven with the evolution and migration of human, as well as with the origins of microbiology. The main etiologic agent of TB is Mycobacterium tuberculosis (Mtb) [Citation1]. Mtb infects 2 billion people around the world, causing nearly 10.4 million new active TB cases and 1.8 million deaths annually [Citation2]. In TB pathogenesis, the host cellular immune response determines whether an infection becomes a latent TB infection or progresses to infectious active TB or extrapulmonary TB [Citation3]. Approximately 90% of infected individuals will remain asymptomatic with latent TB infection. Only 10% of individuals infected with Mtb will develop active disease, suggesting that host immunity is important in regulating progression of TB infection [Citation4,Citation5].
miRNAs, a type of noncoding RNA between 22 and 24 nucleotide (nt), could be important regulators of gene expression at the post-transcriptional level and influence many biological systems including mammalian immune systems [Citation6]. Studies found that miRNAs extensively regulate cell differentiation, development and disease [Citation7]. In mammals, over 60% of mRNAs are thought to be regulated by miRNAs [Citation8]. Studies have found altered gene expression profiles in macrophages and natural killer (NK) cells from individuals with active or latent TB, and individuals with TB infection or healthy individuals. This alteration of cellular composition and related gene expression in patients with TB is likely regulated by miRNAs [Citation9,Citation10]. Several miRNAs regulate T-cell differentiation and function in patients [Citation11,Citation12]. In addition, miRNAs are important for regulating the innate function of macrophages, dendritic cells and NK cells [Citation13]. Some miRNAs in CD4+ T cells are altered in latent and active TB [Citation14]. Novel miRNA combinations can discriminate between individuals with a TB infection and healthy individuals [Citation15,Citation16]. Furthermore, the functions of miRNAs are closely correlated with pulmonary TB pathogenesis, their molecular regulatory mechanism has not been investigated by integrated mRNA and miRNA transcriptome analysis.
In this study, high-throughput sequencing strategy was employed to screen differentially expressed mRNA and miRNAs between individuals with pulmonary tuberculosis (PTB) and healthy individuals with DESeq analysis [Citation17]. Potential target genes of differentially expressed miRNAs were predicted using TargetScan [Citation18] and miRanda [Citation19] algorithms. Enrichment analysis of Gene Ontology (GO) term and KEGG pathways for predicted and differentially expressed genes was conducted to get insights into the functions of mRNAs and miRNAs in PTB pathogenesis. These analyses will contribute to a more comprehensive understanding of the regulatory mechanisms involved in the development and pathogenesis of PTB.
Materials & methods
Patients with PTB & healthy individuals
PTB patients were diagnosed based on clinical manifestations, bacterial culture and radiographic findings. Patients had no major complications such as chronic obstructive pulmonary disease, asthma, lung cancer, pneumonia, diabetes or hypertension. All of patients (aged 26–35 years) had not received any medicines treatment before blood extraction. Healthy individuals had no family history of hereditary diseases or low immune function. Three paired samples were selected for detecting mRNAs with whole transcriptome sequencing and miRNAs with small RNA sequencing. Patients with PTB (two male and one female) and healthy individuals (two male and one female) were recruited from the First People’s Hospital of Zhangjiagang, Jiangsu Province, China.
Blood sample collection & RNA extraction
Fasting early morning blood samples were collected from participants in 3.0-ml tubes with heparin lithium anticoagulant. Within 4 h of collection, leukocytes were isolated from whole blood using extraction kits according to the manufacturer’s instructions (TIANGEN, Beijing, China). Blood cells were transferred into microcentrifuge tubes with TRIzol reagent according to the manufacturer’s protocol (Invitrogen, CA, USA). Total RNAs were quantified by NanoDrop™ ND-2000 (Thermo Fisher Scientific, CA, USA) and RNA integrity was assessed using an Agilent Bioanalyzer 2100 (Agilent Technologies, CA, USA).
Whole transcriptome sequencing for mRNA & bioinformatics analysis
Total RNA was extracted from PTB and healthy samples using TRIzol reagent following the manufacturer’s protocol. RNA integrity was evaluated using an Agilent 2100 Bioanalyzer. Samples with RNA integrity number greater than or equal to nine were used for subsequent analysis. Libraries were constructed using (TruSeq Stranded Total RNA with Ribo-Zero Gold, Illumina, CA, USA) according to the manufacturer’s instructions. Libraries were sequenced on an Illumina sequencing platform (HiSeqTM 4000, Illumina, CA, USA) and 150 bp/125 bp paired-end reads were generated. Sequencing was carried out by the ShangHai Oebiotech Co. (Shanghai, China). Reads from the six samples were mapped to assembled transcripts using Bowtie2, and gene expression was estimated as fragments per kb per million reads [Citation32]. Differentially expressed genes were identified using DESeq software (http://bioconductor.org/packages/release/bioc/html/DESeq.html) [Citation17]. mRNAs showing more than twofold changes with adjusted p < 0.05 were considered differentially expressed. Hierarchical clustering was performed and heat maps created using the R platform (http://www.rproject.org/). GO functional and KEGG pathway enrichment analysis were used to determine major biological processes and pathways of differentially expressed mRNAs with DAVID bioinformatics resources (https://david.ncifcrf.gov/home.jsp). GO terms and KEGG pathways with corrected p-values less than 0.05 were considered significantly enriched.
Small RNA sequencing & bioinformatic analysis
Total RNA was extracted from PTB and healthy blood samples using mirVana RNA Isolation Kits (Applied Biosystems, p/n AM1556, CA, USA) and purified using QIAGEN RNeasy® Kits (QIAGEN, Mainz, Germany). An Agilent 2100 Bioanalyzer was used for quality testing after purification. A total of 5 μg RNA was used for small RNA sequencing by the ShangHai Oebiotech Co. (Shanghai, China).
Basic reads were converted into sequence data (called raw data/reads) by base calling. Low-quality reads were filtered, and reads with 5′-primer contaminants and poly (A) were removed. Reads without 3′-adapter and insert tags, and reads shorter than 15 nt and longer than 41 nt from raw data were filtered to obtain clean reads. For primary analysis, the length distribution of clean sequences in the reference genome was determined. Noncoding RNAs were annotated as rRNAs, tRNAs, snRNAs and snoRNAs. RNAs were aligned and subjected to BLAST (v2.2.28+) search against Rfam (v.10.1) (http://www.sanger.ac.uk/software/Rfam) and GenBank databases (http://www.ncbi.nlm.nih.gov/genbank/). Known miRNAs were identified by aligning against the miRBase (v.21) database (http://www.mirbase.org/), and known miRNA expression patterns in different samples were analyzed. Unannotated small RNAs were analyzed by MiRDeep2 (v.2.0.0.8) to predict novel miRNAs [Citation33]. Based on the hairpin structure of pre-miRNAs and the miRBase database, corresponding miRNA star sequences were identified. Differentially expressed miRNAs were identified with a threshold fold change greater than two and adjusted p-value <0.05. P-values were calculated with the DESeq algorithm in the R package for experiments with biological replicates [Citation17]. GO enrichment and KEGG pathway enrichment analysis of differentially expressed miRNA target genes used R (v3.2.0) based on hypergeometric distribution.
Integration analysis
Targets of differentially expressed miRNAs were predicted TargetScan [Citation18] and miRanda [Citation19] algorithms, with parameter: S ≥ 150 ΔG ≤ -30 kcal/mol and demanding strict 5′-seed pairing. According to differentially expression miRNAs profiles, differentially expression mRNA profiles and miRNA–mRNA interaction mechanisms, Pearson correlation coefficients were computed using R (http://www.R-project.org) to determine the negative correlated between the expression levels of each miRNA and its mRNA targets (correlation was <0 and adjusted p-value was <0.05) [Citation34]. The negative correlated between the expression levels of each miRNA and its mRNA targets were screened out to construct the regulatory network with Cytoscape (version 3.0.1; http://www.cytoscape.org/) according to differentially expressed miRNAs and corresponding target genes.
Results
mRNA sequencing & analysis
To better understand the pathogenic mechanism of PTB, we conducted a comparative transcriptomic analysis of three people with PTB and three healthy individuals. A total of six cDNA libraries, named F1, F4, F5, C1, C2 and C3 were constructed and sequenced. From the libraries, 97,193,002; 97,321,140; 98,293,852; 97,902,050; 98,099,296 and 98,047,510 clean reads were obtained, and 94.55, 94.71, 94.76, 94.76, 94.52 and 94.75% reads were mapped to the reference genome (). Original data were normalized and overall characteristics of data distributions for the six samples are shown as box plots (Supplementary Figure 1A). Raw sequencing data from the six samples were normalized and transformed into log2 values. A scatter plot was created and overall distribution of the two datasets was evaluated in a 2D coordinate system (Supplementary Figure 1B).
Table 1. The summary information of mRNA.
Differentially expressed gene identification
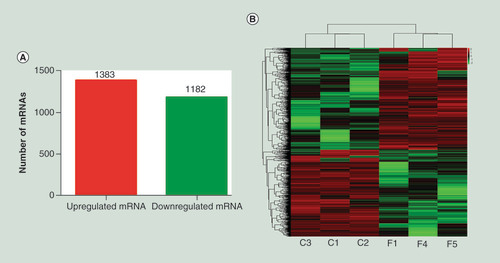
Significant differences in mRNAs between individuals with PTB and healthy individuals were screened for fold change (greater than or equal to twofold change) and adjusted p-value (p < 0.05) determined by DESeq analysis. The number and distribution of mRNAs in the same plane were displayed in volcano plots satisfying both conditions (Supplementary Figure 2). Two thousand five hundred and sixty-five mRNAs were screened out with significant levels of differentially expression comparing PTB patients with healthy individuals (greater than or equal to twofold change; adjusted p < 0.05), with 1383 significantly upregulated and 1182 significantly downregulated (). Using unsupervised hierarchical clustering analysis, a heat map was generated with differentially expressed mRNAs, and the results showed that mRNA expression level in individuals of PTB can be robustly separated from that in healthy individuals ().
(A) Differential expression of mRNAs identified in PTB and healthy individuals. (B) Heat map showing differentially expressed mRNAs comparing individuals with PTB versus healthy individuals. Each row represents one mRNA, and each column represents a sample. Red, upregulation; green, downregulation. C1, C2 and C3, healthy individuals, F1, F4 and F5, individuals with PTB. Six PTB patients (F1, F2, F3, F4, F5 and F6) and six healthy individuals (C1, C2, C3, C4, C5 and C6) were selected for total RNA extraction, but the low quality of RNA samples (F2, F3, F6, C4, C5 and C6) were discarded, so the original number were used in the Figures.
PTB: Pulmonary tuberculosis.
GO term & KEGG pathway enrichment analysis of differentially expressed mRNA
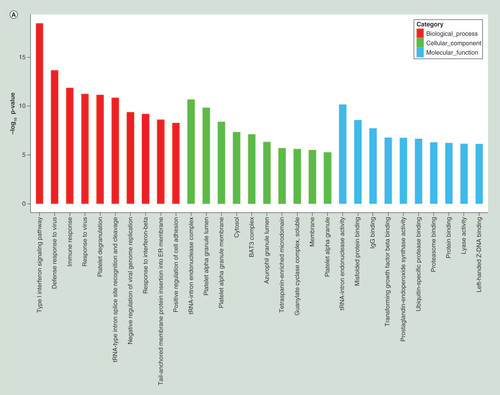
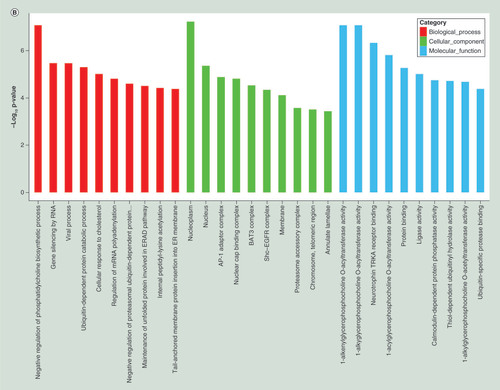
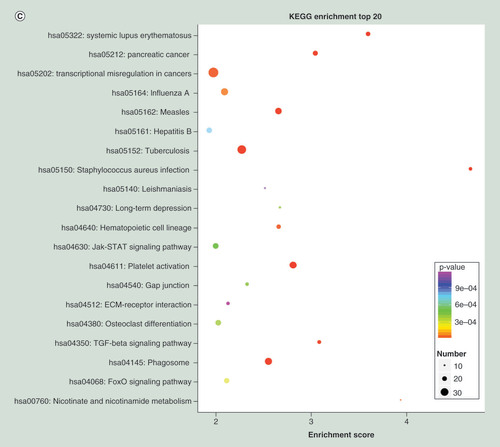
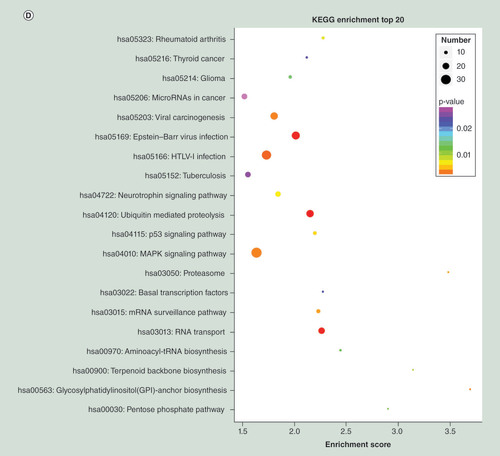
To further understand the function of differentially expressed genes, GO term and KEGG pathway analyses were carried out. Top 20 dysregulated GO processes for each subgroup (biological process, cellular component and molecular function) were analyzed according to enriched, dysregulated mRNAs derived from the gene annotation. Prediction terms with p-value <0.05 were selected and ranked by p-value. Based on routine GO classification algorithms, an enrichment score was used to enrich significant GO terms of differentially expressed genes. GO term enrichment of the upregulated mRNAs included type I interferon signaling pathway, defense response to virus and immune response to virus in biological process; tRNA–intron endonuclease complex, platelet α granule lumen and platelet α granule membrane in cellular component; and tRNA-intron endonuclease activity, misfolded protein binding and IgG binding in molecular function (). GO term enrichment of the downregulated mRNAs included negative regulation of phospholipid biosynthetic process, gene silencing by RNA and viral process in biological process; nucleoplasm, nucleus and AP-1 adaptor complex in cellular component; and 1-alkenylglycerophosphocholine O-acyltransferase activity, 1-alkylglycerophosphocholine O-acyltransferase activity and neurotrophin tyrosine kinase A (TRKA) receptor binding in molecular function (). Using KEGG pathway analysis, the upregulated mRNAs were enriched in transcriptional misregulation in cancers, TB and phagosome (), and the downregulated mRNAs were enriched in MAPK signaling pathway, HTLV-I infection and epstein–Barr virus infection (). The results suggested that these pathways might contribute significantly to PTB pathogenesis.
(A) GO terms for upregulated differentially expressed mRNAs between PTB and healthy individuals. (B) GO terms for downregulated differentially expressed mRNAs between PTB and healthy individuals. (C) Top 20 pathways for upregulated differentially expressed mRNAs between PTB and healthy individuals. (D) Top 20 pathways for downregulated differentially expressed mRNAs between PTB and healthy individuals.
PTB: Pulmonary tuberculosis.
miRNA library construction & identification
To identify miRNAs involved in PTB pathogenesis, six small RNA libraries, F1, F4, F5, C1, C2 and C3, were constructed and sequenced. Acquired raw reads were 25,342,877; 24,678,408; 26,645,820; 23,414,044; 26,357,539 and 22,672,995. After removing low-quality sequencing data, 24,049,448; 23,861,054; 25,883,380; 22,263,514; 25,185,500 and 21,767,699 clean reads were obtained from total reads of F1, F4, F5, C1, C2 and C3 ().
Table 2. The summary information of miRNA.
Identification of putative novel miRNAs
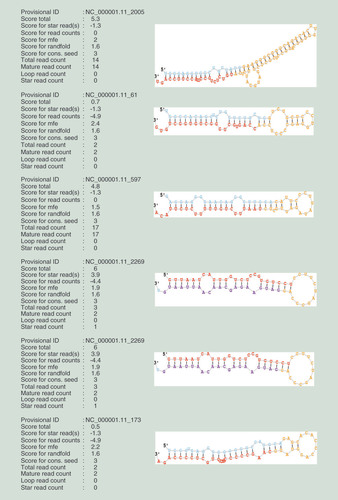
Small RNA sequencing data were aligned with databases, and tRNAs, snRNAs and rRNAs were removed. The obtained sequences were used to predict potential novel miRNAs. Hundreds of novel miRNAs were identified with Mirdeep2 software (Supplementary Table 1) and hairpin structures formed by precursor sequences of four novel miRNAs are illustrated by RNAfold software ().
miRNA differential expression profiles
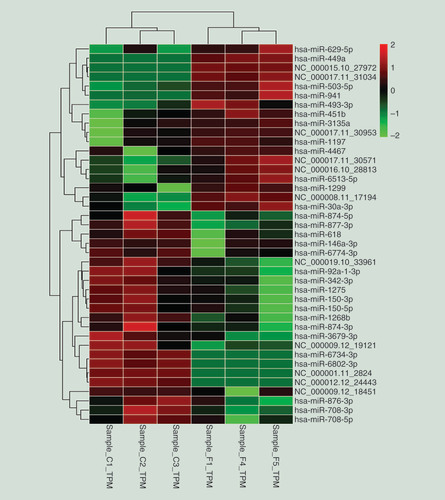
Combining known miRNAs and novel miRNAs identified 2832 miRNAs. Differential expression revealed 41 significantly differentially expressed miRNAs in PTB versus healthy samples (greater than or equal to twofold change; adjusted p < 0.05): 18 upregulated miRNAs and 23 downregulated (). Using unsupervised hierarchical clustering analysis, a heat map was constructed based on differentially expressed miRNAs ().
Table 3. Differential expression of miRNA from the comparative pulmonary tuberculosis with healthy individuals.
Each row represents one miRNA, and each column represents a sample. Red, upregulation; green, downregulation. C1, C2 and C3, healthy individuals, F1, F4 and F5, individuals with PTB.
Target prediction for significantly differentially expressed miRNAs & functional analysis
To provide information about the possible functions of 41 differentially expressed miRNAs, target prediction analysis was conducted by TargetScan and miRanda algorithms. These algorithms identified 359 putative target genes, including genes that participate in positive regulation of cytokine production in the immune response such as interferon and free fatty acid receptor 3.
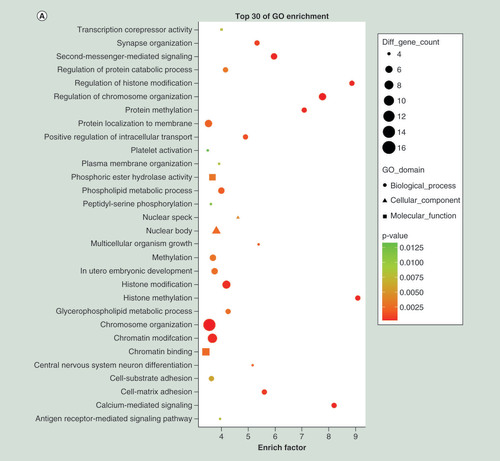
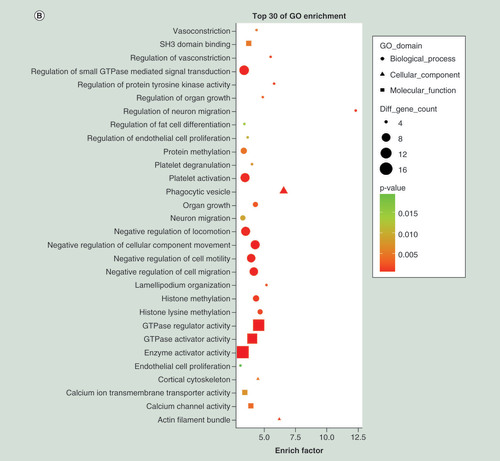
To interpret possible physiological processes and pathways regulated by the identified miRNAs, their putative target genes were subjected to GO term and KEGG pathway analysis. The top 30 enriched GO terms of the downregulated miRNAs were mainly in biological processes (chromosome organization, chromatin modification and histone modification), cellular components (nuclear body and nuclear speck) and molecular function (chromatin binding and phosphoric ester hydrolase activity) (). The top 30 enriched GO terms of the upregulated miRNAs were mainly in biological processes (regulation of small GTPase-mediated signal transduction, platelet activation and negative regulation of locomotion), cellular components (phagocytic vesicle, actin filament bundle and cortical cytoskeleton) and molecular function (enzyme activator activity, GTPase activator activity and GTPase regulator activity) ().
(A) Top 30 Gene Ontology terms for upregulated differentially expressed miRNAs (downregulation of target mRNAs) between PTB and healthy individuals. (B) Top 30 Gene Ontology terms for downregulated differentially expressed miRNAs (upregulation of target mRNAs) between PTB and healthy individuals. (C) Top 30 pathways for upregulated differentially expressed miRNAs (downregulation of target mRNAs) between PTB and healthy individuals. (D) Top 30 pathways for downregulated differentially expressed miRNAs (upregulation of target mRNAs) between PTB and healthy individuals. Gene number: number of target genes in a term or pathway. Rich factor: ratio of number of target genes divided by number of all the genes in a term or pathway.
PTB: Pulmonary tuberculosis.
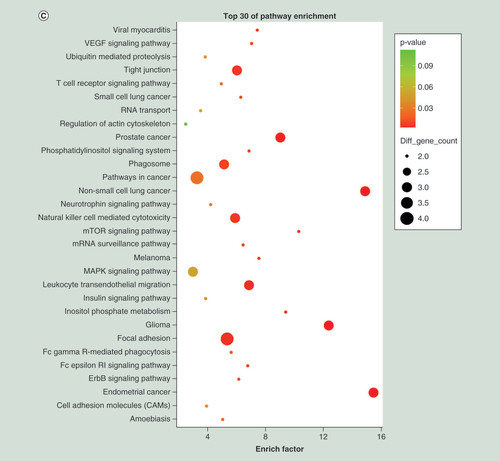
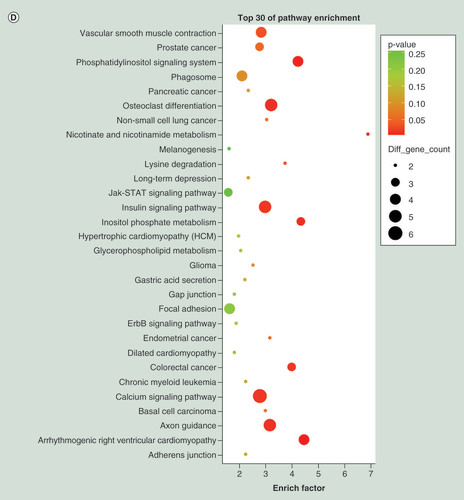
Using KEGG pathway analysis, the upregulated miRNAs were enriched in focal adhesion, tight junction and phagosome pathways (), and the downregulated miRNAs were enriched in calcium signaling pathway, insulin signaling pathway and axon guidance (). The results suggested that these pathways might contribute significantly to PTB pathogenesis.
mRNA–miRNA interaction network
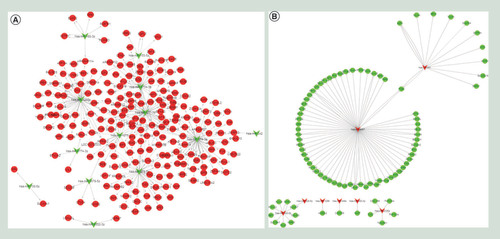
To understand the miRNA regulatory mechanisms underlying the pathogenesis of PTB, interactions between miRNAs and their target mRNAs were investigated. Based on the regulatory mechanism of miRNAs and target genes (mRNAs), we determined a group of negatively correlated upregulated miRNAs and downregulated mRNAs () and another group of positively correlated downregulated miRNAs and upregulated mRNAs () to construct regulatory networks. Three hundred and fifty-nine potential target genes were identified for 41 miRNAs. A series of immunity-related genes including leukocyte immunoglobulin-like receptor, Fc fragment of IgG binding protein and BCL2-like 11 were identified.
Regulatory networks of miRNAs and mRNAs in PTB pathogenesis are illustrated by Cytoscape. Circle nodes, mRNAs; triangle nodes, miRNAs. (A) Positive correlation of miRNAs and mRNAs identified from PTB. (B) Negative correlation of miRNA and mRNA identified from PTB. All of the differentially expressed mRNA (fold change ≥2 and adjusted p < 0.05) was obtained from the whole transcriptome analysis, and the differentially expressed miRNA (fold change ≥2 and adjusted p < 0.05) was obtained from the small RNA sequencing analysis. Pearson correlation coefficients were computed using R (http://www.R-project.org) to determine the negative correlated between the expression levels of each miRNA and its mRNA targets.
PTB: Pulmonary tuberculosis.
Discussion
miRNAs are epigenetic modulators that post-transcriptionally regulate the expression of protein-coding genes. They have emerged as novel regulators in various biological processes and pathogenic conditions such as inflammation, cancer and infectious diseases [Citation20]. They are important gene regulatory factors in multicellular genomes. More than 50–60% of cellular mRNAs are thought to be regulated by miRNAs. One miRNA can target multiple mRNAs, and in turn, one mRNA can be targeted by multiple miRNAs [Citation8,Citation21]. Understanding the complexity of the miRNA network in host–pathogen interactions may open new avenues for identifying biomarkers and improving the efficacy of therapies against TB in humans.
Many miRNAs are altered in peripheral blood cells during active TB, identified by high-throughput sequencing. Numerous candidate miRNAs could be used as biomarkers for human TB [Citation16,Citation22]. Although a large number of miRNAs have been identified in PTB, miRNA–mRNA interactional regulatory mechanisms in the process of PTB are less reported. Screening comparing patients with PTB and healthy individuals (greater than or equal to twofold change; adjusted p < 0.05) identified 2565 mRNAs with significant levels of differential expression, with 1383 significantly upregulated and 1182 significantly downregulated. A series of immunity-related genes including leukocyte immunoglobulin-like receptor, Fc fragment of IgG binding protein and BCL2-like 11 were obtained. Differential expression analysis revealed 41 significantly differentially expressed miRNAs in patients with PTB versus healthy individuals (greater than or equal to twofold change; adjusted p < 0.05), including 18 upregulated miRNAs and 23 downregulated miRNAs. A series of important miRNAs included has-miR-150-3p, has-miR-150-5p, has-miR-874-5p and has-miR-941. Studies show that circulating miR-150, miR-146a and miR-125b identified from childhood TB may have diagnostic value with a combination of differentially expressed miRNAs in childhood TB [Citation23]. Has-miR-3179 and has-miR-19b-2* were identified the most increased and decreased miRNAs in a comparison of sputum samples from patients with TB and controls [Citation24]. In patients with PTB, miR-29 levels were increased in CD4+ T cells with an inverse correlation with IFN-γ mRNA expression [Citation14]. MIR144* levels were upregulated in peripheral blood mononuclear cell (PBMCs) and active TB patients, targeting an autophagy and lysosomal protein (DRAM2), to contribute to the pathogenesis of TB by autophagic inhibition control [Citation25]. Despite numerous studies on differentially expressed miRNAs in PTB, many challenges still exist in accurate normalization of miRNA levels for clinical use among different experiments. These results indicated the possibility that, as indicated in other reports, miRNAs are likely to participate in PTB pathogenesis.
Interaction networks between miRNAs, target genes and transcription factors are critical for an appropriate balance of gene expression in mammalian melanocytes [Citation26]. Our target gene prediction of 41 differentially expressed miRNAs revealed 359 putative target genes. Has-miRNA-4467/ITGB2, has-miR-941/ITGB2, has-miR-1268b/BCL2L11 and has-miR150-3p/ARHGAP11A regulatory axes need to be further investigated in future experiments. A previous study reported miR-150 is underexpressed in active TB [Citation27]. Its primary target is a negative regulator of NK-cell maturation and a reduction of miR-150 levels may indicate development of fewer mature NK cells, which are early innate effector cells controlling invading pathogens [Citation27]. The positive and negative regulation of miRNA–mRNA pairs found in this study provides important clues for PTB pathogenesis.
We comprehensively investigated GO enrichment and KEGG pathways analysis for differentially expressed mRNA and targets of differentially expressed miRNA. With GO enrichment and pathway analysis together, we found 41 differentially expressed miRNAs grouped into 298 KEGG pathways and 2565 differential expression mRNAs grouped into 283 KEGG pathways. Shared by the two methods were 282 KEGG pathways, including important pathways in immunity and metabolism pathway such as MAPK signaling, phagosome, calcium and HTLV-I infection signaling pathway. A previous study reported the activation of MAPK signaling in macrophages by nonpathogenic mycobacteria infection which leads to synthesis of microbicidal molecules, including TNF-α, which mediates inflammatory immune responses and antipathogens [Citation28]. Mannose-capped lipoarabinomannan from Mtb blocks phagosome maturation by inhibiting a signaling cascade of Ca2+, calmodulin and PI3K. The arrest of phagosomal maturation by mannose-capped lipoarabinomannan is an effective mechanism used by mycobacteria for long-term survival in host cells [Citation29]. Protective immunity to M. tuberculosis depends on correct function of T cells and their interaction with macrophages. HTLV-1 preferentially infects T cells and causes chronic T-cell dysfunction, which appears to impair the immune response to specific pathogens [Citation30]. HTLV-1 infection may increase an individual’s susceptibility to active TB [Citation31]. Our results suggested that differentially expressed miRNAs and mRNAs associated with immune pathways might contribute to PTB pathogenesis.
Conclusion
Taken together, our results provide novel insights into PTB pathogenesis. The network and pathway information presented here offer insights for the elucidation of detailed functions of mRNAs and miRNAs in PTB pathogenesis. However, the molecular roles that these dysregulated miRNAs and mRNAs play in PTB are not completely understood here. Future studies are needed to explore the potential mechanism of these dysregulated mRNAs and miRNAs in PTB pathogenesis.
Host immunity is important in regulating progression of tuberculosis infection.
The functions of mRNAs/miRNAs are closely correlated with pulmonary tuberculosis (PTB) pathogenesis.
The whole transcriptome analysis and small RNA sequencing were applied to investigate the differentially expressed mRNAs and miRNAs from PTB patients and healthy individuals.
Two thousand five hundred and sixty-five mRNAs were screened out with significant levels of differential expression comparing PTB patients with healthy individuals (greater than or equal to twofold change; adjusted p < 0.05), with 1383 significantly upregulated mRNAs and 1182 significantly downregulated mRNAs.
Forty-one significantly differentially expressed miRNAs were identified in PTB versus healthy samples (greater than or equal to twofold change; adjusted p < 0.05), with 18 upregulated miRNAs and 23 downregulated miRNAs.
A large number of the differentially expressed mRNAs and miRNAs were related to immune-related pathways, particularly the tuberculosis, phagosome and MAPK signaling pathway.
Three hundred and fifty-nine potential target genes were identified for 41 differentially expressed miRNAs.
Many of target genes were enriched to phagosome, calcium and insulin signaling pathway.
Ethical conduct of research
This study was approved by the Human Ethics Committee of the First People’s Hospital of Zhangjiagang, Jiangsu Province, China. All patients were informed and declared by written informed consent that their samples could be used for research.
Supplemental Figure 1
Download TIFF Image (3.3 MB)Supplemental Figure 1
Download TIFF Image (651 KB)Supplemental Table 1
Download MS Excel (365 KB)Supplementary data
To view the supplementary data that accompany this paper please visit the journal website at: www.tandfonline.com/doi/suppl/10.2217/epi-2018-0028
Financial & competing interests disclosure
This work was supported by Natural Science Foundation of Jiangsu Province (grant no. BK20150300). The authors have no other relevant affiliations or financial involvement with any organization or entity with a financial interest in or financial conflict with the subject matter or materials discussed in the manuscript apart from those disclosed.
No writing assistance was utilized in the production of this manuscript.
Additional information
Funding
References
- Sakamoto K . The pathology of Mycobacterium tuberculosis infection . Vet. Pathol.49 ( 3 ), 423 – 439 ( 2012 ).
- WHO . Global tuberculosis report ( 2016 ). http://apps.who.int/iris/bitstream/10665/250441/1/9789241565394-eng.pdf?ua=1 .
- Smith I . Mycobacterium tuberculosis pathogenesis and molecular determinants of virulence . Clin. Microbiol. Rev.16 ( 3 ), 463 – 496 ( 2003 ).
- Zhang X , LiY , LiXet al. Association of the miR-146a, miR-149, miR-196a2 and miR-499 polymorphisms with susceptibility to pulmonary tuberculosis in the Chinese Uygur, Kazak and Southern Han populations . BMC Infect. Dis.15 , 41 ( 2015 ).
- Khalilullah SA , HarapanH , HasanNA , WinardiW , IchsanI , MulyadiM . Host genome polymorphisms and tuberculosis infection: what we have to say?Egypt. J. Chest. Dis. Tuberc.63 ( 1 ), 173 – 185 ( 2014 ).
- Williams AE . Functional aspects of animal microRNAs . Cell Mol. Life Sci.65 ( 4 ), 545 – 562 ( 2008 ).
- Shivdasani RA . MicroRNAs: regulators of gene expression and cell differentiation . Blood108 ( 12 ), 3646 – 3653 ( 2006 ).
- Friedman RC , FarhKK , BurgeCB , BartelDP . Most mammalian mRNAs are conserved targets of microRNAs . Genome Res.19 ( 1 ), 92 – 105 ( 2009 ).
- Berry MP , GrahamCM , McNabFWet al. An interferon-inducible neutrophil-driven blood transcriptional signature in human tuberculosis . Nature466 ( 7309 ), 973 – 977 ( 2010 ).
- Marin ND , ParisSC , RojasM , GarciaLF . Functional profile of CD4+ and CD8+ T cells in latently infected individuals and patients with active TB . Tuberculosis93 ( 2 ), 155 – 166 ( 2013 ).
- Du C , LiuC , KangJet al. MicroRNA miR-326 regulates TH-17 differentiation and is associated with the pathogenesis of multiple sclerosis . Nat. Immunol.10 ( 12 ), 1252 – 1259 ( 2009 ).
- O’Connell RM , RaoDS , ChaudhuriAA , BaltimoreD . Physiological and pathological roles for microRNAs in the immune system . Nat. Rev. Immunol.10 ( 2 ), 111 – 122 ( 2010 ).
- Taganov KD , BoldinMP , ChangKJ , BaltimoreD . NF-κB-dependent induction of microRNA miR-146, an inhibitor targeted to signaling proteins of innate immune responses . Proc. Natl Acad. Sci. USA103 ( 33 ), 12481 – 12486 ( 2006 ).
- Fu Y , YiZ , LiJ , LiR . Deregulated microRNAs in CD4+ T cells from individuals with latent tuberculosis versus active tuberculosis . J. Cell Mol. Med.18 ( 3 ), 503 – 513 ( 2014 ).
- Cui JY , LiangHW , PanXLet al. Characterization of a novel panel of plasma microRNAs that discriminates between Mycobacterium tuberculosis infection and healthy individuals . PLoS ONE12 ( 9 ), e0184113 ( 2017 ).
- Zhang X , GuoJ , FanSet al. Screening and identification of six serum microRNAs as novel potential combination biomarkers for pulmonary tuberculosis diagnosis . PLoS ONE8 ( 12 ), e81076 ( 2013 ).
- Anders S , HuberW . Differential expression analysis for sequence count data . Genome Biol.11 ( 10 ), R106 ( 2010 ).
- Enright AJ , JohnB , GaulU , TuschlT , SanderC , MarksDS . MicroRNA targets in Drosophila . Genome Biol.5 ( 1 ), R1 ( 2003 ).
- Pasquinelli AE . Non-coding RNA: MicroRNAs and their targets: recognition, regulation and an emerging reciprocal relationship . Nat. Rev. Genet.13 ( 4 ), 271 – 282 ( 2012 ).
- Kim JK , KimTS , BasuJ , JoEK . MicroRNA in innate immunity and autophagy during mycobacterial infection . Cell Microbiol. doi:10.1111/cmi.12687 ( 2017 ) ( Epub ahead of print ).
- Peter ME . Targeting of mRNAs by multiple miRNAs: the next step . Oncogene29 ( 15 ), 2161 – 2164 ( 2010 ).
- Ueberberg B , KohnsM , MayatepekE , JacobsenM . Are microRNAs suitable biomarkers of immunity to tuberculosis?Mol. Cell Pediatr.1 ( 1 ), 8 ( 2014 ).
- Zhou M , YuG , YangX , ZhuC , ZhangZ , ZhanX . Circulating microRNAs as biomarkers for the early diagnosis of childhood tuberculosis infection . Mol. Med. Rep.13 ( 6 ), 4620 – 4626 ( 2016 ).
- Yi Z , FuY , JiR , LiR , GuanZ . Altered microRNA signatures in sputum of patients with active pulmonary tuberculosis . PLoS ONE7 ( 8 ), e43184 ( 2012 ).
- Kim JK , LeeHM , ParkKSet al. MIR144* inhibits antimicrobial responses against Mycobacterium tuberculosis in human monocytes and macrophages by targeting the autophagy protein DRAM2 . Autophagy13 ( 2 ), 423 – 441 ( 2017 ).
- Abdel-Malek Z , ScottMC , SuzukiIet al. The melanocortin-1 receptor is a key regulator of human cutaneous pigmentation . Pigment Cell Res.13 , 156 – 162 ( 2000 ).
- Bezman NA , ChakrabortyT , BenderT , LanierLL . miR-150 regulates the development of NK and iNKT cells . J. Exp. Med.208 ( 13 ), 2717 – 2731 ( 2011 ).
- Roach SK , SchoreyJS . Differential regulation of the mitogen-activated protein kinases by pathogenic and nonpathogenic mycobacteria . Infect. Immun.70 ( 6 ), 3040 – 3052 ( 2002 ).
- Koul A , HergetT , KleblB , UllrichA . Interplay between mycobacteria and host signalling pathways . Nat. Rev. Microbiol.2 ( 3 ), 189 – 202 ( 2004 ).
- Suzuki M , DezzuttiCS , OkayamaAet al. Modulation of T-cell responses to a recall antigen in human T-cell leukemia virus type 1-infected individuals . Clin. Diagn. Lab. Immunol.6 ( 5 ), 713 – 717 ( 1999 ).
- Verdonck K , GonzalezE , SchrootenW , VanhamG , GotuzzoE . HTLV-1 infection is associated with a history of active tuberculosis among family members of HTLV-1-infected patients in Peru . Epidemiol. Infect.136 ( 8 ), 1076 – 1083 ( 2008 ).
- Langmead B , SalzbergSL . Fast gapped-read alignment with Bowtie 2 . Nat. Methods9 ( 4 ), 357 – 359 ( 2012 ).
- Friedlander MR , MackowiakSD , LiN , ChenW , RajewskyN . miRDeep2 accurately identifies known and hundreds of novel microRNA genes in seven animal clades . Nucleic Acids Res.40 ( 1 ), 37 – 52 ( 2012 ).
- Mansson R , TsapogasP , AkerlundM , LagergrenA , GislerR , SigvardssonM . Pearson correlation analysis of microarray data allows for the identification of genetic targets for early B-cell factor . J. Biol. Chem.279 ( 17 ), 17905 – 17913 ( 2004 ).