
Abstract
Aim: An outstanding challenge in epigenome studies is the estimation of cell-type proportions in complex epithelial tissues. Materials & methods: Here, we construct and validate a DNA methylation reference and algorithm for complex tissues that contain epithelial, immune and nonimmune stromal cells. Results: Using this reference, we show that easily accessible tissues such as saliva, buccal and cervix exhibit substantial variation in immune cell (IC) contamination. We further validate our reference in the context of oral cancer, where it correctly predicts an increased IC infiltration in cancer but suppressed in patients with highest smoking exposure. Finally, our method can improve the specificity of differentially methylated CpG calls in epithelial cancer. Conclusion: The degree and variation of IC contamination in complex epithelial tissues is substantial. We provide a valuable resource and tool for assessing the epithelial purity and IC contamination of samples and for identifying differential methylation in such complex tissues.
Epigenetic alterations and DNA methylation (DNAm) changes in particular, are thought to mediate the effects of environmental exposures on disease risk [Citation1–5]. Epigenome-wide association studies (EWAS) aim to identify these DNAm changes [Citation6], mainly, but not exclusively, in easily accessible surrogate tissues such as blood, saliva or buccal swabs [Citation7–10]. Identifying such DNAm alterations is, however, challenging due to cell-type heterogeneity, which can lead to confounding and reverse causality [Citation11]. While a range of statistical methods for cell-type deconvolution and inference of cell-type fractions have been developed [Citation12–16], these methods have only been largely validated in whole blood. Moreover, the degree of cell-type heterogeneity and contamination by immune and other stromal cells in epithelial tissues has not yet been fully assessed, especially in the context of surrogate tissues like saliva, buccal swabs and cervical smears.
Here we address these challenges by constructing and validating a novel DNAm reference for general epithelial tissues. We demonstrate the feasibility of using DNAm data generated as part of the ENCODE project [Citation17] and other studies [Citation18,Citation19] to construct a DNAm reference database, which allows us to obtain estimates of epithelial, immune cell (IC) and non-IC stromal fractions in any given sample. We validate the reference in multiple studies, including whole-genome bisulfite sequencing (WGBS) data from the International Human Epigenome Consortium (IHEC) [Citation20] and matched RNA-seq data from The Cancer Genome Atlas (TCGA) [Citation21]. In addition, alongside this novel DNAm reference, we also present and validate a novel hierarchical strategy for inferring cell-type fractions of individual IC subtypes within epithelial tissues. Using this reference, we demonstrate that all three main surrogate tissues, in other words, buccal, saliva and cervix, exhibit substantial variation in the total IC fraction, with a large proportion of the samples containing more than 70% ICs.
Materials & methods
Construction of a general DNAm reference for epithelial tissues (the EpiFibIC reference)
We aimed to build a reference DNAm database for a general tissue that would allow us to estimate fractions of epithelial, ICs and nonimmune stromal cells from the DNAm profile of a sample, using our EpiDISH algorithm [Citation22], which is a reference-based approach that uses robust partial correlations (RPC) to estimate cell-type fractions. To construct the reference database, we used Illumina 450k data, generated as part of the ENCODE project, from 11 different epithelial cell lines (Hipe, Saec, Hre, Hae, Hrpe, Prec, Hee, Hcpe, Hnpce, Hmec and Hrce), seven different fibroblast lines (Imr90, ProgFib, Ag04449, Ag04450, Ag09319, Bj and Nhdfneo) and a total of 42 purified samples representing all seven major IC types (neutrophils, eosinophils, monocytes, CD4+ and CD8+ T cells, B cells and natural killer [NK] cells) from Reinius et al. [Citation18]. We reasoned that using cell lines, a source of relatively homogenous cells, representing a variety of different epithelial and fibroblast cells, would allow us to identify common epithelial and fibroblast markers. These 450k profiles were used in conjunction with an empirical Bayes framework [Citation23] to select differentially methylated CpGs (DMCs) between the three major cell groupings: epithelial (Epi), fibroblast (Fib) and ICs. Specifically, we performed three comparisons, each one comparing one cell type to the other two. In order to ensure that DMCs between the different cell types are not confounded by cell-culture artefacts, we demanded, besides a false discovery rate (FDR) <0.05, that DMCs also exhibited strongly bi-modal patterns, in other words, exhibiting at least 60% differences in average DNAm between cell types. Specifically, between ICs and the Epi+Fib groupings, we demanded at least a 90% difference in average methylation, between Epi and IC+Fib groupings, we demanded at least a 70% difference, and between Fib and Epi+IC groupings, we demanded a difference of at least 60%. These thresholds were chosen to ensure similar numbers of DMCs in each comparison (247, 233 and 236, respectively with a total of 716 unique CpGs), which in principle helps ensure the stability of the inference to random removal of CpGs [Citation24]. Finally, the DNAm reference was obtained by averaging DNAm values for the 716 DMCs and for each of the three main cell types (Epi, Fib and IC), resulting in a 716 × 3 reference matrix, we call ‘EpiFibIC’. The averaging procedure is justified since we verified that the great majority of the 716 CpGs exhibited very stable (i.e., ultra-low variance) DNAm values within a given cell type.
Estimating the cell-type fractions using hierarchical EpiDISH (HEpiDISH)
In order to estimate cell-type fractions for all nine cell types (epithelial, fibroblast and the seven IC subtypes listed above) in any given sample, we use the following tree based strategy. First, we apply EpiDISH with RPC and the EpiFibIC reference, to obtain cell-type fractions for the epithelial, fibroblast and total IC components. Then, we reapply EpiDISH with RPC to a 188 CpG subset of our previously validated blood reference database (a reference DNAm matrix consisting of 333 CpGs and seven IC cell subtypes) [Citation22] to estimate relative proportions for all seven IC cell subtypes. Finally, these relative proportions for the seven IC cell subtypes are rescaled, by multiplying them with the total IC fraction estimated in the first step to obtain absolute proportions of all seven IC subtypes in the sample of interest. We note that the last steps are only required if there is a need to estimate fractions for the IC cell subtypes. Importantly, we note that: the 333 DMCs of the blood reference share no overlap with the 716 CpGs making up EpiFibIC, as required, since the 333 DMCs in the blood reference were chosen to discriminate different IC cell subtypes from each other; and that inference of the individual IC subtype fractions is performed on a 188 CpG subset of the 333 blood reference DMCs. These 188 CpGs were selected by requiring that their median DNAm value across all seven IC cell subtypes did not differ significantly from the median DNAm values of the epithelial and fibroblast lines. Specifically, from the 333 DMCs, we only selected CpGs that exhibited a median DNAm value larger than 0.7 or less than 0.3 in all three cell types (epithelial, fibroblast and ICs). This ensures that the inference of IC subtype fractions in the second step is not significantly confounded by variation in the epithelial and fibroblast proportions since the baseline DNAm level of these CpGs in the ICs cannot differ from that of the epithelial and fibroblast lines by more than 0.3, while the IC subtype specific DMCs themselves exhibit larger than 0.5 methylation differences between one IC cell subtype and the other six subtypes. Moreover, we verified that these 188 CpGs exhibited fairly stable DNAm value across all epithelial and fibroblast lines, which means that taking the median is likely to be representative. We have found that the hierarchical or tree-based approach outlined above works better than trying to construct one single DNAm reference that encompasses all cell types. Indeed, inferring cell-type fractions for all cell types from a single DNAm reference containing many cell types that belong to widely different developmental lineages can be unstable, and will result in estimated cell-type fractions being more reliable for some cell types than for others. The improvement provided by HEpiDISH stems from the fact that the inference of cell-type fractions is always performed on a smaller number of fundamental cell types, with the DMCs used for inferring fractions at each step optimized to discriminate the relevant cell types (and not optimized for cell types further down the developmental hierarchy). Importantly, the use of RPCs at each step of the inference procedure facilitates this hierarchical approach, since RPCs do not force the regression weights to be positive or to add to one [Citation22]. The positivity and normalization constraints are always imposed a posteriori, as done also in the case of CIBERSORT [Citation22,Citation24]. This therefore allows and justifies the rescaling of the weights at every step of the inference procedure, in order to finally obtain the cell type proportions in the sample of interest.
Validation of the EpiFibIC reference & HEpiDISH
Validation of the EpiFibIC reference, was first carried out against DNAm datasets profiling pure or relatively pure cell types: we validated it in Illumina 450k data of purified monocytes, T cells and B cells from 50 monozygotic twin pairs [Citation25], as this should correctly predict zero fractions for epithelial and fibroblasts and near 100% for the IC subtype. We also validated it on WGBS IHEC data of two samples enriched for breast epithelial cells and four purified samples representing kidney podocytes (a type of epithelial cell) [Citation20], as this should predict higher cell fractions for the epithelial component. Finally, we also validated it against Illumina 450k data from the Stem-Cell-Matrix Compendium2 (SCM2) [Citation19], which had profiled independent epithelial and fibroblast cell lines.
We also validated our EpiFibIC reference and the HEpiDISH algorithm, by performing in silico mixtures of five cell types: the Hibec epithelial cell line from SCM2 (not used in the construction of EpiFibIC), the MRC5 fibroblast cell line from SCM2 (not used in the construction of EpiFibIC), and the CD4+ T cells, B cells and monocytes from Paul et al. [Citation25] (also not used in the construction of EpiFibIC or our blood reference). We performed a total of 1000 in silico mixtures, with the five weights drawn from a Dirichlet distribution, and assessed our method by estimating R2 values between estimated and true mixing proportions. We note that the HEpiDISH strategy was further validated using the same 1000 in silico mixture approach in the context of the breast tissue DNAm reference.
Stability analysis of the EpiFibIC reference
We used three epithelial cell lines (HRPTEC, HREC and HRCEC) and eight fibroblast cell lines (HPLF, 2 HDF, HDFF, HDFA, CCD1079SK, IMR90 and MRC5) from SCM2 as well as the CD4+ T cells, B cells and monocytes pool from several sources (B cells: 56 samples from Absher et al. [Citation26], four from Mamrut et al. and six from Zilbauer et al. [Citation27]; CD4+ T cells: 71 samples from Absher et al., 31 from Limbach et al. [Citation28], six from Mamrut et al., eight from Nestor et al. [Citation29], six from Zilbauer et al. and 214 from Reynolds et al. [Citation30]; monocytes: 28 samples from Absher et al., five from Mamrut et al., 36 from Marabita et al. [Citation31], six from Zilbauer et al. and 1202 from Reynolds et al.) to generate 500 in silico mixtures, with the five weights drawn from a Dirichlet distribution. Before mixing them together, we altered the methylation value of a number of CpGs in our EpiFibIC reference, so as to model the effect of potential errors or dropouts in our reference. The number of altered CpGs varied up to about 550 of the 716 CpGs in the reference. We altered methylation values by shifting the β-values by as much as 0.8 on the β-value scale, in one of the cell types. For a given number of altered CpGs in the reference, we did 100 Monte-Carlo runs, and evaluated performance by computing R2 values between estimated and true mixing cell type proportions.
Validation & consistency against TCGA RNA-seq data
We downloaded and processed level 3 Illumina 450 k and RNA-seqV2 data from TCGA [Citation21]. In total, we considered 12 cancer types and only included normal (N) and cancer (C) samples with both DNAm and RNA-seq data: bladder adenocarcinoma (BLCA): nN = 15; nC = 198, breast adenocarcinoma (BRCA): nN =68; nC = 650, colon adenocarcinoma (COAD): nN =19; nC = 254, head and neck squamous cell carcinoma (HNSC): nN = 20; nC = 396, kidney renal cell carcinoma (KIRC): nN = 24; nC = 297, kidney renal papillary carcinoma (KIRP): nN = 23; nC = 195, liver hepatocellular carcinoma (LIHC): nN = 38; nC = 173, lung squamous cell carcinoma: nN = 8; nC = 275, lung adenocarcinoma (LUAD): nN = 21; nC = 392, prostate adenocarcinoma (PRAD): nN = 33; nC = 276, thyroid carcinoma (THCA): nN = 48; nC = 487) and uterine cervix endometrial carcinoma: nN = 9; nC = 253. Type-2 bias of DNAm data were adjusted with BMIQ [Citation32]. RNA-seq data were offset by 1, log2 transformed and quantile normalized.
We then used EpiDISH (RPC mode, v 1.0.0) with EpiFibIC to estimate the total IC fraction in all of the above samples using their 450 k DNAm profiles. We obtained independent estimates of the relative total IC proportions by applying the ESTIMATE [Citation33] algorithm (v 1.0.13) on the matched RNA-seq profiles. Unless specified, all settings of the software were default. Pearson correlation coefficients (PCCs) between EpiDISH and ESTIMATE results were computed for all samples, cancer samples and normal samples, respectively in each cancer type.
Construction & validation of a DNAm reference for breast
Breast tissue is special in that it contains a significant amount of fat cells [Citation34]. Hence, in addition to the epithelial and fibroblast cell lines and the purified IC cell subtypes used earlier, we repeated the same procedure as before to construct a DNAm reference for four major cell types: epithelial, fibroblast, adipocyte and IC. For fat, we used two adipocyte samples from SCM2 [Citation19]. In all cases, DNAm data were normalized with BMIQ [Citation32], and the reference was constructed using a similar procedure as for EpiFibIC, resulting in a reference over 491 strongly bi-modal DMCs and four representative major cell types (epithelial, fibroblast, fat and IC). In detail, when selecting DMCs, besides FDR <0.05, we demanded a difference in average methylation of at least 90% between ICs and all other cell types, of at least 75% between epithelial cells and all other cell types, of at least 60% between fibroblasts and all other cell types, and finally of at least 50% between fat cells and all others. These thresholds were chosen to ensure approximately similar numbers of DMCs in each comparison. To validate this DNAm reference and HEpiDISH strategy, we generated 1000 in silico mixtures of independent DNAm profiles representing normal mammary epithelial cells, fat cells, mammary fibroblasts and IC-types. Specifically, we used the three normal mammary epithelial cell lines from Lowe et al. [Citation35], six adipocyte samples from Slieker et al. [Citation36], two breast fibroblast samples from Holm et al. [Citation37] and the purified B cells, T cells and monocytes samples from Paul et al. [Citation25]. In all cases, DNAm data were normalized with BMIQ [Citation32], and in silico mixtures were generated by randomly choosing one sample from each of the six cell types and mixing them together with random uniform weights.
DNAm datasets used
The following lists the DNAm datasets used in this manuscript, with their GEO (www.ncbi.nlm.nih.gov/geo) accession numbers or download links. Illumina 450 k data from ENCODE (GSE40699), Illumina 450 k data from SCM2 [Citation19] (GSE31848), Illumina 450 k data of CD4+ T cells, B cells and monocytes from Paul et al. [Citation25] (www.ebi.ac.uk/ega/datasets/EGAD00010001025), Absher et al. [Citation26] (GSE59250), Zilbauer et al. [Citation27] (www.ebi.ac.uk/arrayexpress/experiments/E-MTAB-2145/) and Mamrut et al. (GSE71244), Illumina 450 k data of CD4+ T cells and monocytes from Reynolds et al. [Citation30] (GSE56047), Illumina 450 k data of CD4+ T cells from Limbach et al. [Citation28] (GSE71955) and Nestor et al. [Citation29] (GSE50222), Illumina 450 k data of monocytes from Marabita et al. [Citation31] (GSE43976), Illumina 450 k from 20 normal cervix samples from Farkas et al. [Citation38] (GSE46306), Illumina 450 k data from 152 buccal samples (all women) [Citation9], Illumina 27k data of 152 normal cervical smears [Citation39] (GSE30760), Illumina EPIC data of 150 saliva samples (24 female + 126 male) (GSE111631) and Illumina 450 k data of normal breast tissue (n = 92) [Citation34] (GSE69914). Processed WGBS data from IHEC was downloaded from the IHEC data portal (http://epigenomesportal.ca/ihec/).
Generation of saliva DNAm dataset
Saliva was collected as part of the ethically approved study Saliva To Predict Risk of Disease Using Transcriptomics and Epigenetics (SPIT) study (ISRCTN Registration: 11921553). Patients who were being assessed for esophageal cancer at endoscopy were categorized into risk profiles, from low through to high risk. All fasted for a minimum of 6 h prior to saliva collection, as required for endoscopy. Up to 1 ml saliva was collected into 10 ml collection tubes in which 1 ml of RNAlater was already present. Immediately after collection, the tube was inverted to mix the preservative and saliva. All samples were stored at ambient temperature for 12 h and then stored at -80°C until DNA extraction. DNA extraction was performed using a Zymo spin column system (Zymo Research, CA, USA). Genome-wide DNAm was profiled using the Infinium MethylationEPIC BeadChips (Illumina, CA, USA). Genomic DNA (500 ng) was bisulfite converted using an EZ-96 DNA Methylation MagPrep kit (Zymo Research, CA, USA), using alternative incubation conditions recommended for Infinium arrays (16 cycles of 95° for 30 s, 50° for 60 min). BeadChips were processed by UCL Genomics (UCL, London, UK) using standard recommended protocol. DNA was hybridized to BeadChips and single nucleotide extension followed by immunohistochemistry was performed using a Freedom EVO robot (Tecan, Maennedorf, Switzerland). BeadChips were subsequently imaged using the iScan Microarray Scanner (Illumina). All idat files were then processed with minfi (v.1.22) using the Illumina definition of β-value. Using the detection p-values estimated by minfi, we first computed coverage per probe (fraction of samples with detection p-value <0.05), removing low quality probes (coverage <0.99) and subsequently computing coverage per sample over the good-quality probes, removing low quality samples (coverage <0.95). The small remaining number of missing values were imputed using impute.knn (with k = 5) from the impute R-package [Citation40]. Raw data and all idat files are available from GEO under accession number GSE111631.
Results
Overall strategy & construction of a reference DNAm database for solid tissues
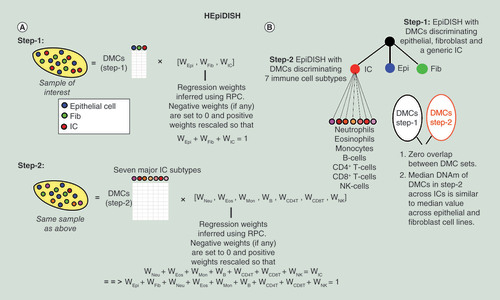
We aimed to construct a reference DNAm database for samples derived from solid epithelial tissues (e.g., cervix, buccal, breast, lung, etc.). Contamination is expected to arise from infiltrating immune/inflammatory cells, as well as from resident stromal cells such as fibroblasts and fat cells. Since there are many types of ICs, we decided to approach the problem using a two-step hierarchical inference procedure, called hierarchical EpiDISH (HEpiDISH), which recognizes the fact that cells are arranged naturally in a developmental tree (Materials & methods, ). In the first step, we use a reference DNAm matrix representing the three main cell types: epithelial cells, fibroblasts (as a model for non-IC stromal cells) and ICs. We use our EpiDISH framework [Citation22], using RPC, to obtain estimates for the proportions of these three cell types in any given sample. In the second step, we reapply EpiDISH using our validated IC reference database encompassing seven different IC subtypes [Citation22] to the same sample to infer relative fractions of all major IC subtypes, which are finally rescaled to yield absolute proportions in the sample of interest. Thus, this hierarchical approach uses a different DNAm reference at each level of the developmental hierarchy (here we consider two levels), which is optimized to estimating relative cell-type fractions at that level. Importantly, we note that the DMCs used in step-1 and step-2 share no overlap and that in step-2 we restrict to DMCs between IC cell subtypes, which in addition exhibit median DNAm values across ICs that are similar to those seen across the epithelial and fibroblast lines.
Flowchart of how HEpiDISH works on a complex epithelial tissue. (A) In the first step, we apply EpiDISH with RPC to estimate cell-type fractions for the epithelial, fibroblast and immune cell (IC) compartments, using a reference DNA methylation (DNAm) matrix designed and optimized to discriminate a general epithelial, fibroblast and IC from each other. In the second step, we reapply EpiDISH but now using a different DNAm reference, defined over differentially methylated CpGs (DMCs) designed and optimized to discriminate the seven major IC subtypes from each other. Inferred weights in the second step are rescaled so that they add to the weight for the total IC fraction estimated in step-1. Finally, all proportions for all nine cell types add to one, as required. (B) Hierarchical tree depiction of HEpiDISH. We note that there is no overlap between the DMCs in the two reference DNAm matrices and that we further demand that DMCs used in step-2, exhibit similar median DNAm values across all three main cell types.
DMC: Differentially methylated CpG; Epi: Epithelial; Fib: Fibroblast; HEpiDISH; Hierarchical EpiDISH; IC: Immune cell; NK: Natural killer; RPC: Robust partial correlation.
In order to construct the DNAm reference database for the three main cell types, we made use of the ENCODE DNAm data of epithelial and fibroblast cell lines [Citation17,Citation41], as these are clonal and therefore of the highest possible purity. To avoid bias toward one particular epithelial tissue-type, we used a reasonable number of different normal epithelial (n = 11) and fibroblast (n = 7) cell lines (). By using many different types of normal epithelial and fibroblast lines, we reasoned that this would also help avoid confounding by cell-culture artefacts, an assumption which we validate a posteriori. For IC subtypes, we used the Illumina 450 k DNAm data from Reinius et al. [Citation18], which included DNAm profiles for neutrophils, eosinophils, monocytes, B cells, NK cells, CD4+ and CD8+ T cells. The reference was constructed using our previously validated procedure [Citation22], which selects DMCs between cell types (epithelial, fibroblast and ICs) that exhibit as strong a bi-modal distribution as possible (). We identified a total of 716 bi-modal DMCs, all of which exhibited at least a 60% difference in average DNAm between cell types, and with 247 of these exhibiting at least a 90% difference (Supplementary Table 1, ). Because of the very large differences in DNAm between cell types and the relatively low variation within a cell type, all these DMCs are highly likely to be true positives and not artefacts of confounding factors. Finally, the reference DNAm database was obtained by separately averaging the DNAm profiles of all epithelial, fibroblast and IC samples, resulting in a matrix of 716 DMCs and three representative cell types, which we call ‘EpiFibIC’. As a sanity check, we verified that all samples used in the reference construction, were predicted to be either near 100% or over 90% representative for the corresponding cell types (Supplementary Figure 1).
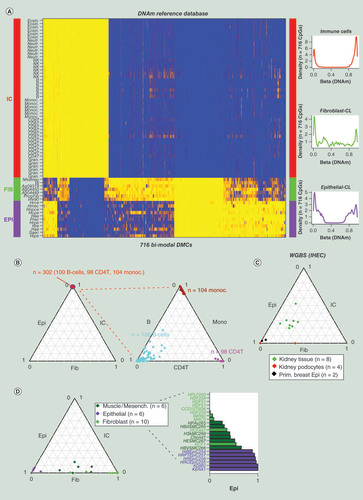
(A) Heatmap of DNAm values over the 716 CpGs and 72 pure samples, representing the reference DNAm database called ‘EpiFibIC’. Blue = high methylation (β > 0.8), yellow = low methylation (β < 0.2). Samples representing IC subtypes, fibroblasts and epithelial cells are indicated by the color bar. Density curves on the right show the distribution of methylation values of the 716 CpGs in each of the three main cell type categories. (B) Validation of EpiFibIC reference in an Illumina 450k dataset encompassing 104 monocytes, 100 B cells and 98 CD4+ T cells), displayed as ternary plots. (C) Validation of EpiFibIC reference in WGBS data from IHEC for four kidney podocytes and two primary breast epithelial samples. Also shown are the cell-type fractions for eight kidney tissue (nonpure) samples. (D) Validation of EpiFibIC reference in Illumina 450 k data from the SCM2 for a number of epithelial and fibroblast cell lines. Also shown are the cell-type fractions for cell lines representing muscle cells.
DNAm: DNA methylation; Epi: Epithelial; Fib: Fibroblast; IC: Immune cell; IHEC: International Human Epigenome Consortium; SCM2: Stem-Cell-Matrix Compendium2; WGBS: Whole-genome bisulfite sequencing.
For the DNAm reference to be used in the second step, we start out with the 333 CpG blood reference matrix encompassing the seven major IC subtypes, previously derived and validated by us [Citation22]. We note that these 333 DMCs share zero overlap with the 716 DMCs of the EpiFibIC reference, and that we further restrict to a subset of 188 DMCs (Supplementary Table 2) which exhibit similar median DNAm values across epithelial, fibroblast and ICs to ensure that the estimation of IC subtype fractions is not confounded by the epithelial and fibroblast cells in the sample (Materials & methods, Supplementary Figure 2). Importantly, we verified that restriction to these 188 DMCs did not appreciably alter the estimated IC type fractions in whole blood, as compared with those derived from the original validated 333 CpG blood DNAm reference (Supplementary Figure 3), or in relation to experimental mixtures of IC subtypes, where the underlying true cell-type fractions are known (Supplementary Figure 4).
Validation & robustness of the EpiFibIC reference
To validate the reference DNAm matrix, we first tested it on a large Illumina 450k dataset of 302 purified blood cell subtypes (100 B cells, 98 CD4+ T cells and 104 monocytes) [Citation25]. As required, applying EpiDISH with RPC to this dataset resulted in all 302 samples having IC fractions equal (or very close) to 1 (). When estimating the fractions for the different IC subtypes, we found excellent agreement with their known subtype (). Only in the case of B cells, did we observe that many samples were predicted to be not that pure, exhibiting non-negligible monocyte or CD4+ T-cell fractions. Using independent FACS based purity estimates [Citation25] we were able to confirm the predictions from our EpiDISH algorithm, as B-cell samples did indeed exhibit a much lower purity and FACS based purity estimates correlated significantly (p < 1e-12) with those from EpiDISH (Supplementary Figure 5). Next, we tested the reference in WGBS data from IHEC [Citation20], selecting epithelial samples of highest possible purity, which included two primary breast epithelial and four purified kidney podocyte samples. In line with their expected high epithelial purity, five of the six samples were predicted to be over 90% epithelial, with one podocyte sample exhibiting a partial fibroblast phenotype (). We also applied EpiDISH to eight nonpure kidney tissue samples, confirming that these samples had a more mixed cellular phenotype with non-negligible fibroblast and IC proportions (). As a further test, we applied EpiDISH with our EpiFibIC reference to Illumina 450 k data from the SCM2, which included many independent epithelial, fibroblast and muscle/mesenchymal cell lines. All epithelial cell lines were predicted to be over 90% epithelial, with most of the fibroblast cell lines also exhibiting a clear fibroblast phenotype (). Cell lines representing different types of muscle cells, exhibited a more intermediate classification between epithelial and fibroblast ().
To further test the robustness and resolution of our DNAm reference, we applied it to 1000 different in silico mixture samples, obtained by mixing together independent samples representing five purified cell types: epithelial, fibroblast and three IC types (B cells, monocytes and CD4+ T cell). We note that none of these samples had been used in the reference construction. We estimated the proportions for each of these five cell types in each of the 1000 in silico mixtures, using our hierarchical two-step procedure (Materials & methods). We observed excellent agreement between predicted and true cell-type fractions with R2 values consistently above 0.9 (). To assess the stability of the inference to random errors in the reference matrix, we simulated a scenario where increasing numbers of DMCs in the reference represent false positives, by altering their DNAm values to render them nondifferentially methylated between cell types (Materials & methods). This demonstrated that by altering even as many as 100 of our 716 DMCs, estimated cell-type fractions were still highly correlated with the true values (R2 ∼ 0.9) ().
(A) Validation of the EpiFibIC reference against 1000 in silico mixtures generated from an epithelial cell line (hepatic biliary epithelium), fibroblast cell line (lung fibroblast) and three immune cell (IC) cell subtypes (CD4+ T cells, monocytes and B cells). True cell-type fractions are plotted against estimated fractions, as obtained using EpiDISH (RPC) with the EpiFibIC reference. R2 values are given. (B) as (A), but now considering the total IC fraction, and plotting the obtained R2 values against an increasing number of perturbations affecting CpGs in the EpiFibIC reference. Specifically, the CpGs in the EpiFibIC reference exhibit a bi-modal distribution, and for a given number of these CpGs we altered/perturbed their methylation values from being unmethylated to methylated or vice versa. (C) Validation of the estimated total IC fractions from EpiDISH+EpiFibIC reference against the weight of the top principal component in four separate EWAS representing buccals, saliva and cervix, with the latter deriving from two independent studies generated with different version of the Illumina Infinium platform. All samples derive from females to avoid confounding by sex of the top principal component. Number of samples and absolute PCC value are given.
DMC: Differentially methylated CpG; EWAS: Epigenome-wide association study; PCC: Pearson correlation coefficient; RPC: Robust partial correlation.
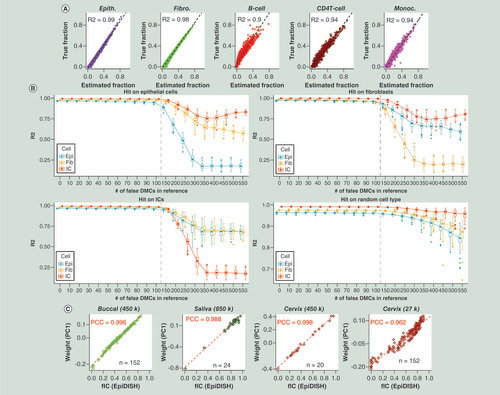
Next, we aimed to assess the performance of our reference on real mixtures of epithelial and IC subtypes. While this is hard due to the inherent difficulty of counting cells in a solid tissue, we posited that a way to reliably assess cell-type fraction estimates is by linear correlation with the weights from the top principal component of a PCA, as: for suitably chosen cohorts (e.g., cohorts representing one ethnic group and one gender) the top component of variation must be associated with cell-type heterogeneity; and it is reasonable to assume that samples are linear mixtures of underlying cell types. We performed this analysis for four separate Illumina DNAm datasets [Citation9,Citation38,Citation39], all profiling white Caucasians of the same gender (women), encompassing three separate tissues (buccal, saliva and cervix). In all cases, we observed excellent agreement between the weight of the top principal component (PC; estimated without using cell-type specific DMCs) and the estimated total IC fraction from EpiDISH (). In fact, for the three datasets generated with either Illumina 450k or 850k versions, the absolute PCC was larger than 0.98 (). Even in an Illumina 27k set profiling cervical samples, for which only 28 of the 716 CpGs in the reference were available, we still observed a remarkably good correlation (PCC = 0.96; ). In the case of saliva, we also profiled samples from men and here too we observed a strong correlation (PCC = 0.96; Supplementary Figure 6). In general, all these results demonstrate the reliability of our reference DNAm matrix and its robustness to large numbers of CpG dropouts.
Consistency with RNA-seq based cell-fraction estimates
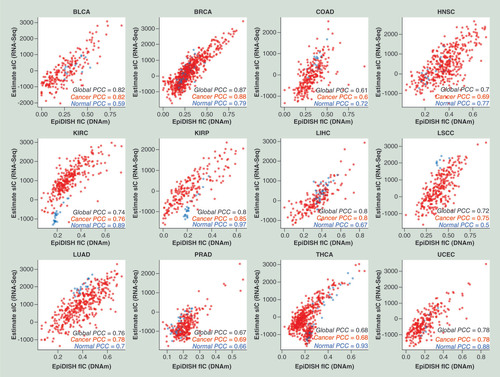
To further demonstrate the validity of our EpiFibIC reference, we would expect consistency with independent cell-type fraction estimates obtained using a different molecular assay, for example, RNA sequencing. To this end, we applied the EpiDISH and ESTIMATE algorithms [Citation33] on the matched Illumina 450k DNAm and RNA-seq profiles of normal-adjacent and cancer samples from 12 cancer types, profiled as part of TCGA [Citation21]. Specifically, we compared the total IC fraction estimated using EpiDISH on the DNAm profile, with the corresponding IC score obtained using ESTIMATE on the matched RNA-seq profile. We observed a remarkably good agreement, for both normal and cancer tissue and across all 12 cancer types ().
Scatterplots of the total IC fraction estimates of RNA-seq TCGA samples obtained using the ESTIMATE algorithm (y-axis) against the corresponding total IC fractions obtained on the matched Illumina 450 k DNAm profiles with the EpiDISH algorithm (using EpiFibICall as reference), for 12 different TCGA cancer types. The PCC between the two scores is given, using all normal and cancer samples, using only normal samples and only cancer samples.
BLCA: Bladder adenocarcinoma; BRCA: Breast adenocarcinoma; COAD: Colon adenocarcinoma; DNAm: DNA methylation; HNSC: Head and neck squamous cell carcinoma; IC: Immune cell; KIRC: Kidney renal cell carcinoma; KIRP: Kidney renal papillary carcinoma; LIHC: Liver hepatocellular carcinoma; LSCC: Lung squamous cell carcinoma; LUAD: Lung adenocarcinoma; PCC: Pearson correlation coefficient; PRAD: Prostate adenocarcinoma; THCA: Thyroid carcinoma; UCEC: Uterine cervix endometrial carcinoma; TCGA: The Cancer Genome Atlas.
Substantial variation in IC contamination in surrogate tissues
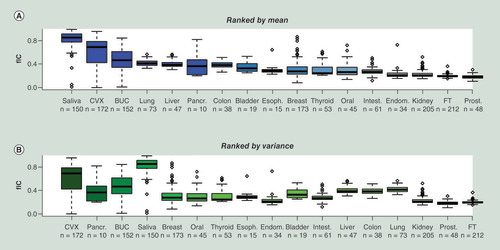
Having validated the EpiFibIC reference, we next explored the degree of IC contamination across epithelial tissues. In addition to buccal swabs, saliva and cervix, we collected Illumina DNAm datasets representing fallopian tube [Citation42] (n = 212), breast [Citation34] (n = 92) and intestine [Citation43] (n = 61), using only histologically normal samples in order to more reliably assess the natural variation in a disease-free context. We also included the tissues for which there were sufficient normal-adjacent samples profiled as part of the TCGA [Citation21]. Interestingly, all three surrogate tissues (saliva, cervix and buccal) ranked highest in terms of the degree of IC contamination (). These same tissues were also highly ranked by variance (), and in fact, ranked highest by the range of total IC fractions. For saliva specially, most of the samples exhibited more than 80% contamination by ICs, yet a few samples also exhibited close to zero IC fractions (). Interestingly, tissues like lung and liver exhibited relatively high levels of IC contamination, but were far less variable than for example cervix, pancreas or breast ().
(A) Boxplots of estimated total IC fractions obtained using EpiDISH with EpiFibIC reference, across several tissue types, with tissues ranked in decreasing order of mean total IC fraction. (B) as (A), but now ranking tissues in decreasing order of variance. Number of samples in each tissue types is given below sample labels.
BUC: Buccal; CVX: Cervix; FT: Fallopian tube; IC: Immune cell.
HEpiDISH reveals lower IC infiltration in smoking-related head & neck cancer
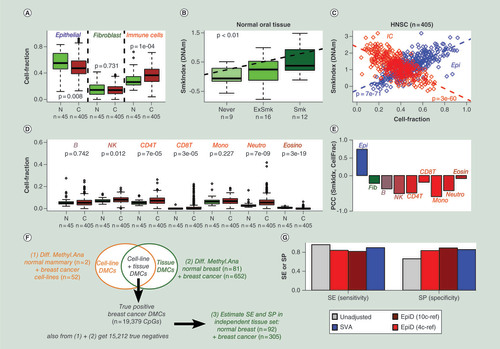
In order to demonstrate and also further validate the utility of our novel DNAm reference and HEpiDISH, we applied it to the DNAm data of 405 HNSCs and 45 normal adjacent tissues, profiled as part of the TCGA [Citation44]. Both normal and cancer samples exhibited considerable IC infiltration, although as expected the epithelial component was the largest (). Comparing estimated cell-type fractions between normal and HNSC, we observed an increased total IC infiltration in cancer, with the fibroblast fraction remaining unchanged (). Of note, HEpiDISH predicted that this increase in IC infiltration in HNSC was driven primarily by increases in the T-cell and neutrophil proportions, with NK cells exhibiting only a marginal increase (). To explore if the variations in cell-type fraction also relate to specific HNSC subtypes, we estimated a smoking index in each cancer sample using our previously validated 1501 CpG smoking DNAm signature, which has been derived from 400 buccal swabs [Citation9]. The importance of using a DNA-based measure of smoking exposure was recently highlighted [Citation45]. Validating the DNAm-based smoking index, it correlated with the epidemiological measure of smoking exposure, despite the relatively small numbers of normal samples (). We observed that the DNAm-based smoking index was strongly anticorrelated with the level of total IC infiltration across the 405 HNSCs (). This not only confirms similar findings obtained in the same TCGA samples using a smoking mutational signature as a smoking index and an mRNA expression based IC infiltration score [Citation45], but serves as strong validation that our total IC fraction estimates are reliable. Of note, we observed similar strong anticorrelations between the smoking index and the level of NK, CD4+ T cell and monocyte/macrophage infiltration (), suggesting that the proportions of these specific cell types are particularly low in smoking-related HNSC.
(A) Variation in the epithelial, fibroblast and total immune cell (IC) fraction (y-axis), as estimated using hierarchical EpiDISH (HEpiDISH), between normal oral tissue (N) and head and neck cancer (C). p-values are from a two-tailed Wilcoxon rank sum test. (B) Validation of a DNAm-based smoking index in the normal oral tissue. p-value is from a linear regression. (C) Correlation and anticorrelation of the same smoking index (y-axis) with the epithelial and total IC fractions (x-axis), respectively, as evaluated across the 405 HNSC. p-values are from a linear regression. (D) as (A), but now for the IC subtype fractions as estimated using HEpiDISH. (E) PCCs between the DNAm-based smoking index and the individual cell-type fractions, as evaluated across the 405 HNSCs. (F) Outline of the strategy used to construct a gold standard list of breast cancer differentially methylated CpGs (DMCs). Briefly, two separate lists of DMCs are derived by comparing breast cancer cell lines to normal breast epithelial lines, and comparing breast cancer tissue to normal breast tissue. By taking the overlap of these two, we obtain a high-confidence set of breast cancer DMCs occurring in the epithelial compartment of the breast. The sensitivity and specificity of an algorithm to detect DMCs independent of changes in cell-type composition can then be estimated using an independent breast cancer tissue dataset. (G) The sensitivity and specificity of four different DMC identification methods: unadjusted analysis, using EpiDISH-estimated cell-type fractions of four main cell types (epithelial, adipose, fibroblast and IC) as dependent covariates, using HEpiDISH-estimated cell-type fractions of ten cell types (epithelial, adipose, fibroblast, neutrophils, monocytes, eosinophils, CD4+ T cells, CD8+ T cells, NK cells and B cells) as dependent covariates, and using SVA.
DMC: Differentially methylated CpG; DNAm: DNA methylation; HNSC: Head and neck squamous cell carcinoma; NK: Natural killer; PCC: Pearson correlation coefficient; SE: Sensitivity; SP: Specificity; SVA: Surrogate variable analysis.
Improved specificity of DMC cells in breast cancer
In order to demonstrate the suitability of our DNAm reference to infer DMCs in the context of solid epithelial tissues, we considered the case of DMCs between normal and cancer, using breast cancer as an example because of the availability of DNAm profiles for large numbers of breast cancer cell lines: although it is hard to define true positive cancer DMCs, we reasoned that an approximate gold standard set of breast cancer DMCs could be constructed by intersecting a list of DMCs derived from a comparison of two normal to 52 breast cancer cell lines (n = 23,258) [Citation46], with a separate list of DMCs derived from the large breast cancer TCGA study [Citation47] consisting of 81 normal samples and 652 breast cancers (). By using cell lines in the first comparison we avoid the limitation of cell-type heterogeneity (as cell lines are relatively pure), and by using tissues in the second comparison we take advantage of the large sample size (81 normal breast tissue samples) while also avoiding potential cell-culture artefacts. Thus, the overlap of DMCs from the two comparisons ought to define a high-confidence set of DMCs occurring within the epithelial compartment of breast cancers and therefore independent of changes in IC and stromal composition. The above strategy resulted in a list of 19,379 true positive breast cancer DMCs, as well as a list of 15,212 true negatives (Supplementary Table 3; ). In order to objectively estimate sensitivity and specificity, we used an independent breast cancer tissue EWAS (92 normal/normal-adjacent samples and 305 primary breast cancers) () [Citation34]. Because breast tissue is known to contain a lot of fat, we extended the DNAm reference matrix to also include adipocytes (Supplementary Table 4) [Citation34]. We validated this new DNAm reference using 1000 in silico mixtures of purified samples representing independent normal mammary epithelial, mammary fibroblast, adipocytes and ICs (Materials & methods). Applying HEpiDISH with our constructed reference to these 1000 mixtures resulted in a strong validation with R2 values consistently above 0.9 (Supplementary Figure 7). Treating all ICs as one covariate in the regression analysis, and therefore using a total of four cell types (epithelial, fibroblast, adipocyte and IC) represented by three independent covariates (e.g., fibroblast, adipocyte + IC) in the adjusted regression models, we obtained a sensitivity of 84% and specificity of 83% (). An unadjusted analysis achieved a higher sensitivity (96%), but at a much lower specificity (66%) (). Including all seven IC subtypes as separate covariates (thus a total of ten cell types and nine independent covariates), HEpiDISH obtained a sensitivity of 82%, but at the advantage of a much higher specificity (89%), in other words, over 20% higher than the unadjusted analysis (). Thus, the increased specificity or lower false-positive rate supports the view that HEpiDISH is able to remove false positives attributable to changes in cell-type composition between normal breast and breast cancer. We also note that although the performance measures of HEpiDISH are similar to those of surrogate variable analysis [Citation48] (a state-of-the-art reference-free approach [Citation49]), that surrogate variable analysis cannot estimate cell-type fractions. Thus, our HEpiDISH + novel DNAm reference can provide reasonably accurate estimates of cell-type fractions, while also controlling for the false-positive rate in complex epithelial tissues.
Discussion
The main aim of this study is to present a resource and strategy for estimating cell-type fractions of main cell subtypes found in complex tissues, extending the success of the reference-based framework [Citation13,Citation22] to tissues other than blood. Although we do not provide detailed reference DNAm databases for individual tissue types, we have demonstrated, using several independent datasets, generated with different technologies, and using in silico mixture experiments (where the mixing proportions are known with certainty), that our EpiFibIC reference is able to reliably estimate fractions of epithelial, total immune and stromal (mainly fibroblasts) cells in these complex tissues. In the case of breast, we successfully extended the reference to also include adipocytes. Importantly, our analysis shows the feasibility to construct reliable DNAm references using cell-line DNAm data as models for pure epithelial cells and fibroblasts, and that these can be successfully combined with noncell line DNAm profiles representing all major IC subtypes.
Using our novel DNAm reference matrix we have been able to demonstrate that many complex tissues exhibit widespread contamination by ICs. This was especially true for easily accessible, surrogate tissues, like saliva, buccal swabs and cervical smears. Thus, these results have profound implications for future EWAS that want to use these tissues to identify DNAm alterations that may be more representative of the alterations that originate in the epithelial or stromal compartments of solid tissues.
Our DNAm reference and algorithm can also be useful in cancer epigenome studies, as shown here in the context of head and neck (HNSC) and breast cancer. In the former case, the total IC infiltration increases in cancer compared with normal tissue while among the HNSCs the total IC fraction was lowest in those patients who according to a DNAm-based smoking index had smoked most, in agreement with a recent study [Citation45]. Moreover, our analysis suggests that while the increased IC infiltration in cancer is due to T cells and neutrophils, that the lower IC fraction seen in smoking-associated HNSC is driven by a lower proportion of NK cells and monocytes/macrophages. This observation may be important for devising immunotherapies [Citation45]. In the context of breast cancer, the reference DNAm matrix can be used not only to estimate the epithelial content of samples, which could be used as a quality control measure or criterion for selecting samples, but also to infer cancer DMCs occurring in the epithelial compartment of the breast tissue. In particular, we have demonstrated that EpiDISH, in combination with our DNAm reference matrix, is able to achieve relatively high sensitivity (>80%) and specificity (∼90%), comparable to state-of-the-art reference-free methods. As a potential future application, the obtained cell-type fractions in complex tissues could be used to also infer the specific cell types responsible for the DMCs, allowing us to determine if the DNAm alterations associated with disease are occurring in one, several, or all of the epithelial, stromal or IC compartments.
Conclusion
In summary, the novel DNAm reference matrix ‘EpiFibIC’ presented here will be useful for a wide range of epigenome studies that need to obtain approximate estimates of the total epithelial, total IC and non-IC stromal fractions in samples representing complex tissues.
We have constructed a DNA methylation reference for complex epithelial tissues and validated it in purified samples, cell lines, in silico mixtures and primary tissue.
Saliva, cervix and buccal tissue exhibit high levels of immune cell contamination, while also exhibiting large inter-individual variance.
Our new DNA methylation reference and hierarchical EpiDISH procedure could be used to identify differentially methylated CpGs in solid tissues.
Author contributions
Statistical analyses were performed by SC Zheng and AE Teschendorff. D Dong contributed to data analysis. AP Webster, A Feber, DG Graham, S Jevons and R Sullivan contributed to the generation of the saliva DNAm data. LB Lovat and S Beck obtained funding for the generation of the saliva DNAm data. M Widschwendter contributed valuable feedback. Manuscript was conceived and written by AE Teschendorff with contributions from SC Zheng.
Ethical conduct of research
The authors state that they have obtained appropriate institutional review board approval or have followed the principles outlined in the Declaration of Helsinki for all human or animal experimental investigations. In addition, for investigations involving human subjects, informed consent has been obtained from the participants involved.
Supplemental Information 1
Download MS Excel (674.6 KB)Supplemental Figure 1
Download PDF (974.1 KB)Acknowledgements
We thank TCGA, ENCODE and IHEC projects and their team members for making their data available.
Financial & competing interests disclosure
This work was supported by NSFC (National Science Foundation of China) grants, grant numbers 31571359 and 31401120, by a Royal Society Newton Advanced Fellowship (NAF project number: 522438, NAF award number: 164914), by Core – The Digestive Disorders Foundation (175481) and the Eve Appeal. The authors are also supported by the European Union’s Horizon 2020 Programme (H2020/2014–2020) under grant agreement number 634570 (project FORECEE) and would also like to acknowledge the support of the NIHR University College London Hospitals (UCLH) Biomedical Research Centre. The authors have no other relevant affiliations or financial involvement with any organization or entity with a financial interest in or financial conflict with the subject matter or materials discussed in the manuscript apart from those disclosed.
No writing assistance was utilized in the production of this manuscript.
Additional information
Funding
References
- Petronis A . Epigenetics as a unifying principle in the aetiology of complex traits and diseases . Nature465 ( 7299 ), 721 – 727 ( 2010 ).
- Feinberg AP , OhlssonR , HenikoffS . The epigenetic progenitor origin of human cancer . Nat. Rev. Genet.7 ( 1 ), 21 – 33 ( 2006 ).
- Van Dongen J , NivardMG , WillemsenGet al. Genetic and environmental influences interact with age and sex in shaping the human methylome . Nat. Commun.7 , 11115 ( 2016 ).
- Dekkers KF , Van ItersonM , SliekerRCet al. Blood lipids influence DNA methylation in circulating cells . Genome Biol.17 ( 1 ), 138 ( 2016 ).
- Herceg Z , GhantousA , WildCPet al. Roadmap for investigating epigenome deregulation and environmental origins of cancer . Int. J. Cancer142 ( 5 ), 874 – 882 ( 2018 ).
- Rakyan VK , DownTA , BaldingDJ , BeckS . Epigenome-wide association studies for common human diseases . Nat. Rev. Genet.12 ( 8 ), 529 – 541 ( 2011 ).
- Wahl S , DrongA , LehneBet al. Epigenome-wide association study of body mass index, and the adverse outcomes of adiposity . Nature541 ( 7635 ), 81 – 86 ( 2017 ).
- Gao X , JiaM , ZhangY , BreitlingLP , BrennerH . DNA methylation changes of whole blood cells in response to active smoking exposure in adults: a systematic review of DNA methylation studies . Clin. Epigenetics7 , 113 ( 2015 ).
- Teschendorff AE , YangZ , WongAet al. Correlation of smoking-associated DNA methylation changes in buccal cells with DNA methylation changes in epithelial cancer . JAMA Oncol.1 ( 4 ), 476 – 485 ( 2015 ).
- Lowe R , GemmaC , BeyanHet al. Buccals are likely to be a more informative surrogate tissue than blood for epigenome-wide association studies . Epigenetics8 ( 4 ), 445 – 454 ( 2013 ).
- Liu Y , AryeeMJ , PadyukovLet al. Epigenome-wide association data implicate DNA methylation as an intermediary of genetic risk in rheumatoid arthritis . Nat. Biotechnol.31 ( 2 ), 142 – 147 ( 2013 ).
- Houseman EA , MolitorJ , MarsitCJ . Reference-free cell mixture adjustments in analysis of DNA methylation data . Bioinformatics30 ( 10 ), 1431 – 1439 ( 2014 ).
- Houseman EA , AccomandoWP , KoestlerDCet al. DNA methylation arrays as surrogate measures of cell mixture distribution . BMC Bioinformatics13 , 86 ( 2012 ).
- Lutsik P , SlawskiM , GasparoniG , VedeneevN , HeinM , WalterJ . MeDeCom: discovery and quantification of latent components of heterogeneous methylomes . Genome Biol.18 ( 1 ), 55 ( 2017 ).
- Onuchic V , HartmaierRJ , BooneDNet al. Epigenomic deconvolution of breast tumors reveals metabolic coupling between constituent cell types . Cell Rep.17 ( 8 ), 2075 – 2086 ( 2016 ).
- Teschendorff AE , ReltonCL . Statistical and integrative system-level analysis of DNA methylation data . Nat. Rev. Genet.19 ( 3 ), 129 – 147 ( 2017 ).
- Gerstein M . Genomics: ENCODE leads the way on big data . Nature489 ( 7415 ), 208 ( 2012 ).
- Reinius LE , AcevedoN , JoerinkMet al. Differential DNA methylation in purified human blood cells: implications for cell lineage and studies on disease susceptibility . PLoS ONE7 ( 7 ), e41361 ( 2012 ).
- Nazor KL , AltunG , LynchCet al. Recurrent variations in DNA methylation in human pluripotent stem cells and their differentiated derivatives . Cell Stem Cell10 ( 5 ), 620 – 634 ( 2012 ).
- International Human Epigenome C , StunnenbergHG , HirstM . The International Human Epigenome Consortium: a blueprint for scientific collaboration and discovery . Cell167 ( 5 ), 1145 – 1149 ( 2016 ).
- Cancer Genome Atlas Research N , WeinsteinJN , CollissonEAet al.The Cancer Genome Atlas Pan-Cancer analysis project . Nat. Genet.45 ( 10 ), 1113 – 1120 ( 2013 ).
- Teschendorff AE , BreezeCE , ZhengSC , BeckS . A comparison of reference-based algorithms for correcting cell-type heterogeneity in epigenome-wide association studies . BMC Bioinformatics18 ( 1 ), 105 ( 2017 ).
- Smyth GK . Linear models and empirical bayes methods for assessing differential expression in microarray experiments . Stat. Appl. Genet. Mol. Biol.3 , 3 ( 2004 ).
- Newman AM , LiuCL , GreenMRet al. Robust enumeration of cell subsets from tissue expression profiles . Nat. Methods12 ( 5 ), 453 – 457 ( 2015 ).
- Paul DS , TeschendorffAE , DangMAet al. Increased DNA methylation variability in Type 1 diabetes across three immune effector cell types . Nat. Commun.7 , 13555 ( 2016 ).
- Absher DM , LiX , WaiteLLet al. Genome-wide DNA methylation analysis of systemic lupus erythematosus reveals persistent hypomethylation of interferon genes and compositional changes to CD4+ T-cell populations . PLoS Genet.9 ( 8 ), e1003678 ( 2013 ).
- Zilbauer M , RaynerTF , ClarkCet al. Genome-wide methylation analyses of primary human leukocyte subsets identifies functionally important cell-type-specific hypomethylated regions . Blood122 ( 25 ), e52 – e60 ( 2013 ).
- Limbach M , SaareM , TserelLet al. Epigenetic profiling in CD4+ and CD8+ T cells from Graves’ disease patients reveals changes in genes associated with T cell receptor signaling . J. Autoimmun.67 , 46 – 56 ( 2016 ).
- Nestor CE , BarrenasF , WangHet al. DNA methylation changes separate allergic patients from healthy controls and may reflect altered CD4+ T-cell population structure . PLoS Genet.10 ( 1 ), e1004059 ( 2014 ).
- Reynolds LM , TaylorJR , DingJet al. Age-related variations in the methylome associated with gene expression in human monocytes and T cells . Nat. Commun.5 , 5366 ( 2014 ).
- Marabita F , AlmgrenM , LindholmMEet al. An evaluation of analysis pipelines for DNA methylation profiling using the Illumina HumanMethylation450 BeadChip platform . Epigenetics8 ( 3 ), 333 – 346 ( 2013 ).
- Teschendorff AE , MarabitaF , LechnerMet al. A beta-mixture quantile normalization method for correcting probe design bias in Illumina Infinium 450 k DNA methylation data . Bioinformatics29 ( 2 ), 189 – 196 ( 2013 ).
- Yoshihara K , ShahmoradgoliM , MartinezEet al. Inferring tumour purity and stromal and immune cell admixture from expression data . Nat. Commun.4 , 2612 ( 2013 ).
- Teschendorff AE , GaoY , JonesAet al. DNA methylation outliers in normal breast tissue identify field defects that are enriched in cancer . Nat. Commun.7 , 10478 ( 2016 ).
- Lowe R , OverhoffMG , RamagopalanSVet al. The senescent methylome and its relationship with cancer, ageing and germline genetic variation in humans . Genome Biol.16 , 194 ( 2015 ).
- Slieker RC , BosSD , GoemanJJet al. Identification and systematic annotation of tissue-specific differentially methylated regions using the Illumina 450 k array . Epigenetics Chromatin6 ( 1 ), 26 ( 2013 ).
- Holm K , StaafJ , LaussMet al. An integrated genomics analysis of epigenetic subtypes in human breast tumors links DNA methylation patterns to chromatin states in normal mammary cells . Breast Cancer Res.18 ( 1 ), 27 ( 2016 ).
- Farkas SA , Milutin-GasperovN , GrceM , NilssonTK . Genome-wide DNA methylation assay reveals novel candidate biomarker genes in cervical cancer . Epigenetics8 ( 11 ), 1213 – 1225 ( 2013 ).
- Teschendorff AE , JonesA , FieglHet al. Epigenetic variability in cells of normal cytology is associated with the risk of future morphological transformation . Genome Med.4 ( 3 ), 24 ( 2012 ).
- Troyanskaya O , CantorM , SherlockGet al. Missing value estimation methods for DNA microarrays . Bioinformatics17 ( 6 ), 520 – 525 ( 2001 ).
- Gerstein MB , KundajeA , HariharanMet al. Architecture of the human regulatory network derived from ENCODE data . Nature489 ( 7414 ), 91 – 100 ( 2012 ).
- Bartlett TE , ChinderaK , McdermottJet al. Epigenetic reprogramming of fallopian tube fimbriae in BRCA mutation carriers defines early ovarian cancer evolution . Nat. Commun.7 , 11620 ( 2016 ).
- Huang KK , RamnarayananK , ZhuFet al. Genomic and epigenomic profiling of high-risk intestinal metaplasia reveals molecular determinants of progression to gastric cancer . Cancer Cell33 ( 1 ), 137 – 150e135 ( 2018 ).
- Cancer Genome Atlas N . Comprehensive genomic characterization of head and neck squamous cell carcinomas . Nature517 ( 7536 ), 576 – 582 ( 2015 ).
- Mandal R , SenbabaogluY , DesrichardAet al. The head and neck cancer immune landscape and its immunotherapeutic implications . JCI Insight1 ( 17 ), e89829 ( 2016 ).
- Zheng SC , BeckS , JaffeAEet al. Correcting for cell-type heterogeneity in epigenome-wide association studies: revisiting previous analyses . Nat. Methods14 ( 3 ), 216 – 217 ( 2017 ).
- Koboldt DC , FultonRS , MclellanMDet al. Comprehensive molecular portraits of human breast tumours . Nature490 ( 7418 ), 61 – 70 ( 2012 ).
- Leek JT , StoreyJD . Capturing heterogeneity in gene expression studies by surrogate variable analysis . PLoS Genet.3 ( 9 ), 1724 – 1735 ( 2007 ).
- Mcgregor K , BernatskyS , ColmegnaIet al. An evaluation of methods correcting for cell-type heterogeneity in DNA methylation studies . Genome Biol.17 ( 1 ), 84 ( 2016 ).