
Abstract
Aim: Charcot foot (CF) is a rare complication of Type 2 diabetes (T2D). Materials & methods: We assessed circulating miRNAs in 17 patients with T2D and acute CF (G1), 17 patients with T2D (G2) and equivalent neuropathy and 17 patients with T2D without neuropathy (G3) using the high-throughput miRNA expression profiling. Results: 51 significantly deregulated miRNAs were identified in G1 versus G2, 37 in G1 versus G3 and 64 in G2 versus G3. Furthermore, we demonstrated that 16 miRNAs differentially expressed between G1 versus G2 could be involved in osteoclastic differentiation. Among them, eight are key factors involved in CF pathophysiology. Conclusion: Our data reveal that CF patients exhibit an altered expression profile of circulating miRNAs
Cardiovascular complications are the leading cause of death in Type 2 diabetes (T2D) patients [Citation1,Citation2]. However, other complications such as neuropathy often develop with time, and hence confer a significant burden on the quality of life and morbidity of affected individuals [Citation3]. Charcot foot (CF) disease is a rare but severe complication of diabetes, which is associated with an increased risk of soft tissue infections, foot ulcers and amputations [Citation4], and a high degree of morbidity and mortality [Citation5]. The condition occurs most commonly in patients with diabetes suffering from severe peripheral neuropathy, often with coexisting sympathetic denervation, causing increased blood flow to the foot and increased bone resorption [Citation6].
Inflammation is always present in CF disease and actively participates in the pathophysiology of the disease as it is the case in most of diabetic foot syndrome [Citation7]. An excessive bone loss has been reported in CF; it is believed to be mediated by an uncontrolled and excessive inflammation [Citation8,Citation9], leading to an increased numbers of osteoclasts and their activity [Citation10]. In patients with acute CF disease, monocytes exhibit a pro-inflammatory modulation of their surface, secrete less anti-inflammatory cytokines and differentiate more into multinucleated resorbing osteoclasts [Citation11,Citation12]. We have recently demonstrated that five cytokines (G-CSF, GM-CSF, IL-1-ra, IL-2 and IL-16) were significantly increased in circulating microparticles from acute CF patients, and induced the activation of pathways that are involved in osteoclast formation [Citation9].
Nonetheless, all the molecular actors and precise origin of the vicious circle of inflammation and bone deformation seen in CF remains only partially understood. miRNAs) are small 22-nucleotide non-coding RNAs molecules that control gene expression by complementary base pairing with specific sites on the 3′-untranslated regions of their target gene mRNA) [Citation13]. miRNAs are transcribed as primary transcripts in the nucleus and undergo further processing in the cytoplasm to produce mature strands that can also be found in plasma [Citation14], serum [Citation15], different body fluids [Citation16] and even in follicular fluid [Citation17]. miRNA levels can be modified in diseases such as cardiovascular disease [Citation18] and cancer [Citation19]. Since the level of circulating miRNAs could respond to certain diseases such as T2D and its associated complications [Citation20,Citation21], we hypothesized that they might possess the potential in diagnosing the pathogenesis of CF disease. In this study, we demonstrate that CF patients exhibit an altered expression profile of circulating miRNAs that could reflect alteration in osteoclast differentiation.
Materials & methods
Subjects
51 patients with T2D were recruited consecutively from the Department of Podiatry and the Department of Endocrinology at Hamad Medical Corporation, Doha, Qatar. 17 of the participants had acute CF, 17 had neuropathy but no CF and 17 did not have without neuropathy or CF. Acute CF was diagnosed according to the American Diabetes Association and the American Podiatric Medical Association task force [Citation22]. Patients had to have a swollen red foot with an increased local temperature of more than 20°C compared with the contralateral foot with x-ray evidence of acute CF. Foot temperature was measured using FLUKE Ti32 thermal imager (Fluke Corporation, WA, USA). All patients with acute CF had neuropathy diagnosed based on the vibration perception threshold (Neurothesiometer NU-1, Horwell, UK) on the great toe being > 25 V (18). Among those, five had dislocations or subluxations, four had fractures, five had periosteal reactions and three had bone destruction on x-ray.
miRNA isolation
miRNAs were isolated from serum using the miRNeasy serum/plasma kit (#217184, Qiagen, Hilden, Germany). Briefly, 2.5 ml of blood was collected in EDTA tubes and centrifuged at 3500 RPM for 5 min. The coagulated blood was discarded, and the supernatant corresponding to the serum was stored at -80°C. 200 μl of frozen serum was thawed for the isolation. The rest of the procedure was performed as per the manufacturer’s protocol. Finally, RNA including miRNA was eluted with 14 μl RNase-free water according to the manufacturer’s instructions.
miRNA profiling & analysis
To perform miRNA profiling of the serum samples, total RNA isolated from the samples were reverse transcribed to cDNA using the Exiqon Universal cDNA Synthesis Kit II (Exiqon Inc., MA, USA) following the manufacturer’s instructions. Equal volumes of total RNA were used for cDNA synthesis from all samples since total RNA concentration isolated from blood cannot be accurately determined. The quality and integrity of the synthesized cDNA were assessed using the miRNA QC PCR Panel, 384 well (V4.M; Exiqon Inc.). cDNA was diluted 50-fold and mixed 1:1 with 2x Exilent SYBR Green master mix (Exiqon Inc.), along with ROX reference dye (4 μl/2 ml) (Thermo Fisher Scientific, MA, USA), before loading onto human serum/plasma focus miRNA PCR panels, 384 well. Quantitative real-time PCR was performed using the QuantStudio 12 K Flex real-time PCR System (Applied Biosystems, CA, USA). Exiqon GenEx qPCR analysis software (version 6) was used for processing the PCR data. To account for run-to-run variation among panels, inter-plate calibration was performed using the mean value of UniSp3 interplate calibrator. To avoid samples contaminated with cell-derived miRNAs, a hemolysis test was carried out by calculating the ΔCt between hsa-miR-23a-3p and hsa-miR-451a, and samples with ΔCt > 7 were excluded from the analyses. miRNAs with Ct ≥35 were considered the background and omitted from the reports. A no-template negative control was run to eliminate assays with spurious amplifications resulting from primer dimers, and a ΔCt of 5 between the test and negative control was set as a cut-off. Individual Ct values were normalized to the global mean of all expressed miRNAs with Ct < 35. miRNA assays with undetermined Ct values and represented as ‘NaN’ values were substituted with the column maximum of +1 as per guidelines. The data thus obtained were first converted to relative quantities on the linear scale and set as relative to nothing, before turning to the log scale to achieve an average distribution and for more uncomplicated graphical depiction. Comparisons were made between two groups at a time. Statistical analyses were carried out by performing an unpaired two-tailed t-test having a confidence interval of 95% (p-value ≤0.05) along with Bonferroni correction but without multiple advanced testing.
Results
Participant characteristics
Our study group comprised 51 individuals (16 women and 35 men). The three groups were defined as follows – G1 – patients with T2D and acute CF, G2 – patients with T2D and neuropathy and G3 – T2D controls (without CF or neuropathy). Baseline characteristics of the study population are shown in . They were well balanced for age, gender, BMI and HbA1c. However, patients with CF (G3) and patients with T2D and neuropathy (G2) had the most prolonged diabetes duration compared with the control group (p = 0.0049).
Table 1. Principal characteristics of the patients included in the study. Diabetes but no neuropathy (G3), diabetes with neuropathy (G2) and diabetes with both neuropathy and Charcot foot (G1). Data are represented as mean (SD) or number (%).
miRNA expression
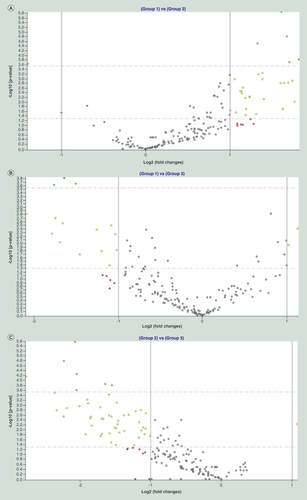
Using the high human serum/plasma focus miRNA PCR Panel, 384 well (V4.M), we measured the expression of 179 mature human miRNAs that are known to be usually present in the serum/plasma of healthy and diseased individuals of miRBase v16. Following the exclusion of hemolyzed samples, expression levels of circulating miRNAs were screened in 17 CF patients (G1, n = 17), 17 patients with T2D and neuropathy (G2, n = 17) and 17 control T2D patients (G3, n = 17). We looked at the differentially expressed miRNAs using three different comparisons. The first comparison comprised of patients with CF (G1) versus patients with T2D and neuropathy (G2), G1 versus G2 (). The second comparison consists of CF patients (G1) versus control T2D patients without CF or neuropathy (G3), G1 versus G3 (). Finally, we compared T2D patients with versus without neuropathy, G2 versus G3 (). In summary, the assay revealed a total of 51 significantly changed miRNAs in G1 versus G2 (Supplementary Table 1; p < 0.05), 37 considerably altered miRNAs in G1 versus G3 (Supplementary Table 2; p < 0.05) and 64 significantly deregulated miRNAs in the G2 versus G3 (Supplementary Table 3; p < 0.05).
Volcano plots showing differentially expressed miRNAs in the following comparisons: T2D with Charcot foot over T2D with neuropathy (Group 1 vs Group 2) (A); T2D with Charcot foot over T2D without neuropathy (Group 1 vs Group 3) (B); and T2D with neuropathy over T2D without neuropathy (Group 2 vs Group 3) (C). miRNAs with more than twofold change and a significant p-value after applying Bonferroni correction are shown in green. Those, which show more than twofold change but whose p-value significance is achieved by discounting Bonferroni correction are shown in yellow. Gray dots represent miRNAs exhibiting less than twofold change, while red dots stand for those showing more than twofold change but lacking statistical significance. Solid vertical lines indicate twofold upregulation or downregulation on the log scale. Dashed horizontal lines either mark p-value = 0.05 on the log scale (red line), or Bonferroni-corrected p-value cut-off (green line).
T2D: Type 2 diabetes.
We first looked at miRNAs that are repeatedly showing up in different comparisons using a Venn diagram (). Interestingly, almost all the significantly expressed miRNAs in G1 versus G3 were present either in the G1 versus G2 (, orange population) or G2 versus G3 comparisons (, green population). This first observation demonstrates the robustness of our study as miRNAs differentially expressed in the G1 versus G3 comparison should represent the miRNAs that are specific to ‘neuropathy’ or ‘CF’. Whereas miRNAs that are specific to the neuropathic condition delineated in G2 versus G3, and the ones specific to CF in G1 versus G2, as shown in our study.
A three-way Venn diagram representing the apparition of miRNAs in each comparison. The one in the center (black) appears in every contrast, the one at the merging of two circles (orange, purple, green) appears in two comparisons and the one in once circle only (yellow, red, blue) appears in only one set of data.
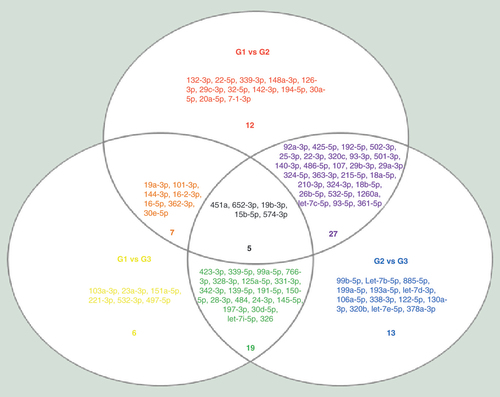
Interestingly, five miRNAs, namely miR-451a, miR-652-3p, miR-15b-5p, miR-574-3p and miR-19b-3p, reoccurred within all three comparisons (, black population). The key idea behind repeating miRNAs between the sets is to give us a sense of reliability. If a miRNA level varies, it should appear in the three comparisons, and the fold changes should be concordant between the comparisons. miR-451a (fold change: 2.51, G1 vs G2; 1.56 G1 vs G3; and -1.60, G2 vs G3), miR-652-3p (fold change 2.61, G1 vs G2; -1.60 G1 vs G3; and -4.18, G2 vs G3), miR-15b-5p (fold change 3.05, G1 vs G2; 1.99 G1 vs G3; and -1.53, G2 vs G3), miR-574-3p (fold change 2.48, G1 vs G2; -2.73 G1 vs G3; and -6.79, G2 vs G3) and miR-19b-3p (fold change 2.08, G1 vs G2; 1.33, G1 vs G3; and -1.56, G2 vs G3) are concordantly regulated between groups, providing once more an evidence of the robustness of our results. Among these five miRNAs, three are more expressed in the group G1 (CF): miR-451a, miR-19b-3p and miR-15b-5p.
Finally, seven miRNAs, namely miR19a-3p, miR101-3p, miR144-3p, miR16-2-3p, miR16-5p, miR362-3p and miR30e-5p were found in the two comparisons G1 versus G2 and G1 versus G3 (, orange population). The recurrence of these seven miRNAs in both comparisons demonstrate their strong correlation with CF disease.
Association of miRNAs & target mRNAs via Ingenuity Pathway Analysis
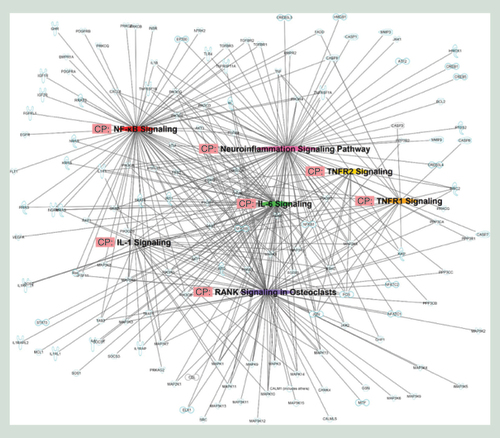
We then used the Ingenuity Pathway Analysis (IPA)’s miRNA target filter functionality to predict mRNAs targeted by miRNAs that are vary between G1 and G2 groups. Of the 51 miRNAs differentially expressed between G1 and G2, only 39 had targeting information available (Supplementary Table 4). These 39 miRNAs were predicted to cumulatively target 12176 mRNAs, which we then shortened to a concise list of 380 mRNAs by focusing on seven pathways of interest for CF ().
The networks hypothesized by Ingenuity Pathway Analysis are based on the molecular relationships, interactions and pathway associations between the methylated candidate genes as shown in a graphical representation.
Finally, we looked at the osteoclast differentiation pathway and searched for miRNAs that could be functioning in each step of the pathway (). We found that 25 miRNAs () were potentially directly involved in the differentiation of monocytes to osteoclasts. Among them, three passed the Bonferroni correction (miR-451a, miR-30e-5p, miR-1260a) and one of them (miR-451a) is present in the three comparisons, which make them outstanding candidate (bolded square and grey shading in ). Another one, miR-19b-3p was found repeated in the three comparisons (gray shading in ). It is also interesting to note that five miRNAs (miR-30e-5p, miR-16-5p, miR-101-3p, miR-144-3p and miR-362-3p) are present in the G1 versus G2 and G2 versus G3 comparisons (orange shading in the ). Altogether, miR-451a, miR-30e-5p, miR-1260a, miR-19b-3p miR-16-5p, miR-101-3p, miR-144-3p and miR-362-3p seem to be interesting targets that merit further investigation in the context of CF.
The graphical representation had been generated by Ingenuity Pathway Analysis and reflects the molecular relationships between miRNAs and candidate genes. miRNAs in red were overexpressed in Charcot foot (CF) patients as compared with Type 2 diabetes (T2D) patients with neuropathy, while the ones in green were downexpressed in CF patients compared with T2D patients with neuropathy.
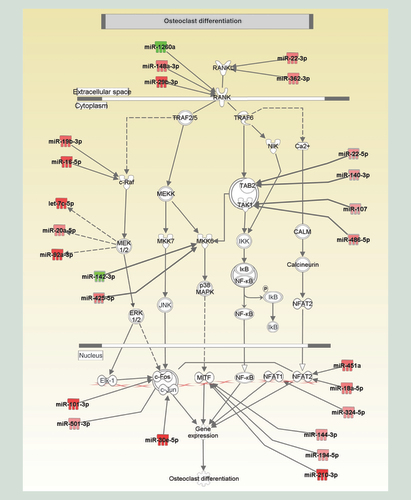
Table 2. miRNAs differentially expressed between G1 and G2 and involved in the osteoclast differentiation.
Discussion
Our study is the first exploratory report on differential expression of circulating miRNAs in T2D patient with CF. We compared patients with diabetic CF to two control groups: T2D patients with neuropathy and T2D patients without neuropathy or CF, which lead to robust data with a sense of repeatability. We report in here the presence of 51 differentially expressed circulating miRNAs in T2D patients with CF when compared with T2D with concomitant neuropathy. Among those, we demonstrated through the IPA’s miRNA target filter functionality that 25 miRNAs could be involved in monocytes differentiation into osteoclasts.
Within the 25 differentially expressed miRNAs involved in osteoclast differentiation revealed by our study, eight are interesting potential targets: miR-451a, miR-30e-5p, miR-1260a, miR-19b-3p miR-16-5p, miR-101-3p, miR-144-3p and miR-362-3p. In diabetic nephropathy, miR-451a can suppress the NF-kB-mediated pro-inflammatory molecules expression through inhibiting the large multifunctional protease 7 [Citation23]. In our study, CF patients had an increased level of miR-451a (miRNA Bonferroni significant and present in the three comparisons), suggesting that it could be a potential candidate for targeting NF-kB in CF patients. miR-30e-5p has been demonstrated to be one of the circulating miRNA signatures in patients with idiopathic and postmenopausal osteoporosis [Citation24]. miR-30e-5p has also been found to be a prolific marker in Lupus erythematosus [Citation25]. miR-1260a was investigated essentially in the context of cancer: breast [Citation26], neuroblastoma [Citation27] or hepatocarcinoma [Citation28]. miR-19b-3p has been found to suppress TGF-β RII preventing fibrogenesis in cardiac fibroblasts [Citation29]. miR-19b-3p can also inhibit TNF-α induced endothelial cell apoptosis through Apaf1/caspase-dependent pathway [Citation30]. Calimlioglu et al. demonstrated that miR-16-5p is a prominent molecular biomarker of T2D at different tissues [Citation31]. miR-101-3p has been greatly described to be correlated with metastasis process in cancer [Citation32,Citation33]. Recently, Sun et al. demonstrated that miRNA-144-3p can prevent bone formation through targeting Connexin 43 [Citation34]. Moreover, miRNA-144-3p has been shown to promote osteoarthritis [Citation35] and the proliferation of osteosarcoma cells [Citation36]. Finally, miR-362-3p has been shown to be involved in proliferation and migration processes [Citation37,Citation38].
Circulating miRNA levels may be affected by numerous intrinsic and extrinsic elements such as the gender, the measurement platform and type of samples obtained [Citation39]. In our study, miRNAs were measured on the same platform and at the same time; hence removing the possibility of a batch effect. Additionally, there was no difference in gender, neither of other traditional diabetes risk factors such as age, BMI and HbA1c. Diabetes duration was the only parameter different among the three groups as patients with CF had a longer duration. However, this did not impact the expression of miRNAs (data not shown). It has been previously reported that additional RNA could be released from cells during the coagulation process, which might create a biased repertoire of circulating miRNAs in the serum [Citation40]. However, our samples were all processed the same way, thus excluding a coagulation pattern bias between the groups. Conversely, the concentrations of the highly abundant miRNA species in blood cell components such as, miR-150 in WBCs, miR-16 in RBCs and miR-126 in platelets were not found differentially expressed between groups. Besides, we also left out from the analysis those samples that showed signs of hemolysis.
Currently, quantitative PCR (qPCR) and RNA-Seq are the favored method for determining miRNA expression, due to its accuracy, simplicity, reproducibility and lower cost than other hybridization- or sequencing-based technologies. We chose a very well evaluated and reliable PCR platform that was shown to be the most highly developed and reliable PCR-based miRNA profiling format, that delivers an outcome most comparable to RNA sequencing [Citation41].
Implications of epigenetics generally, and miRNAs in particular, are being increasingly recognized in clinical settings. Several miRNAs are differentially expressed in human cell cultures and tissues of patients with T2D [Citation21]. Moreover, miRNAs can also predict the occurrence of cardiovascular events or their prognosis in those patients. In patients with coronary artery disease, it was found that miR-4513 was associated with a higher incidence of diabetes and increased long-term mortality [Citation42]. In patients with renal failure, miR-210 and miR-16 predicted a worse prognosis and a greater decline in kidney function [Citation43].
Our study has few limitations. First, our sample is relatively small. A larger sample set may have enabled the identification of more altered miRNAs with a higher degree of confidence. But since CF is a rare disease, enrolling a higher number of patients is logistically more challenging. Second, our participants were well balanced for diabetes and cardiovascular predictors of epigenetics changes (age, gender, BMI and HbA1c, blood pressure, kidney function). Nevertheless, we cannot exclude the presence of cofounding factors and other comorbidities that we did not record and could have influenced our results. Finally, our study population consists only of Arabs. Our findings may therefore not apply to other ethnic groups.
In summary, we report the presence of several differentially expressed miRNAs in patients with T2D and CF disease. Moreover, eight of those miRNAs could be directly implicated in the pathophysiology of the disease. Further studies are needed on a larger group of patients to elucidate better the role of those miRNAs concerning the progression of CF disease and the ability of those miRNAs to differentiate between CF and other foot diseases in diabetes.
Charcot foot (CF) disease is a rare but severe complication of diabetes, which is characterized by an exaggerated inflammation, excessive bone loss and increased osteoclastic activity.
We performed the first exploratory study on differential expression of circulating miRNAs in patients with Type 2 diabetes (T2D) and CF.
We revealed the presence of 25 differentially expressed circulating miRNAs that could be involved in monocytes differentiation into osteoclasts.
Eight of those miRNAs are potential targets that could be directly linked to the pathophysiology of the disease.
In summary, we report the presence of several differentially expressed miRNAs in patients with T2D and CF disease.
Further studies are needed to elucidate better the role of those miRNAs in the progression of diabetic CF disease and their ability to differentiate between CF and other foot diseases in diabetes.
Author contributions
J Pasquier, V Ramachandran, MR Abu-Qaoud, B Thomas, J Hoarau-Véchot, A Robay, O Chidiac, M Benurwar, K Fakhro, R Menzies6, A Jayyousi, M Zirie, J Al Suwaid, RA Malik, T Talal, H Najafi-Shoushtari, A Rafii and C Abi Khalil. Conception and design were made by C Abi Khalil. Acquisition of data was created by J Pasquier, V Ramachandran, MR Abu-Qaoud, B Thomas, J Hoarau-Véchot and M Benurwar. J Pasquier and V Ramachandran performed the statistical analyses. R Menzies, O Chidiac, A Jayyousi, M Zirie, T Talal and C Abi Khalil were involved in the recruitment of patients. A Robay made sure that this work follows the ethical compliance. Analysis and interpretation of the data were made by J Pasquier, V Ramachandran, K Fakhro, J Al Suwaidi, MR Abu-Qaoud, H Najafi-Shoushtari, A Rafii and C Abi Khalil. J Pasquier and V Ramachandran generated the figures. J Pasquier and C Abi Khalil wrote the paper. C Abi Khalil is a guarantor. All authors read and approved the final manuscript.
Ethical disclosure
All participants provided written informed consent approved by Weill Cornell Medicine-Qatar and Hamad Medical Corporation IRBs (13-00031 and 14-14054, respectively). The study was conducted in accordance with the 1964 Declaration of Helsinki and was registered at clinicaltrials.gov (NCT02316483).
Supplemental application 1
Download MS Word (23.2 KB)Supplementary data
To view the supplementary data that accompany this paper please visit the journal website at: www.tandfonline.com/doi/suppl/10.2217/epi-2018-0052
Financial & competing interests disclosure
This work was made possible by a national research priority program (NPRP) grant 7-701-3-192 from the Qatar National Research Fund (a member of Qatar Foundation). The findings achieved herein are solely the responsibility of the authors. The authors have no other relevant affiliations or financial involvement with any organization or entity with a financial interest in or financial conflict with the subject matter or materials discussed in the manuscript apart from those disclosed.
No writing assistance was utilized in the production of this manuscript.
Additional information
Funding
References
- Abi Khalil C , RousselR , MohammediK , DanchinN , MarreM . Cause-specific mortality in diabetes: recent changes in trend mortality . Eur. J. Prev. Cardiol.19 ( 3 ), 374 – 381 ( 2012 ).
- Huang D , RefaatM , MohammediK , JayyousiA , Al SuwaidiJ , Abi KhalilC . Macrovascular complications in patients with diabetes and prediabetes . Biomed. Res. Int.2017 , 7839101 ( 2017 ).
- Pop-Busui R , BoultonAJ , FeldmanELet al. Diabetic neuropathy: a position statement by the American Diabetes Association . Diabetes Care40 ( 1 ), 136 – 154 ( 2017 ).
- Nobrega MB , ArasR , NettoEMet al. Risk factors for Charcot foot . Arch. Endocrinol. Metab.59 ( 3 ), 226 – 230 ( 2015 ).
- Tuttolomondo A , MaidaC , PintoA . Diabetic foot syndrome as a possible cardiovascular marker in diabetic patients . J. Diabetes Res.2015 , 268390 ( 2015 ).
- Young MJ , MarshallA , AdamsJE , SelbyPL , BoultonAJ . Osteopenia, neurological dysfunction, and the development of Charcot neuroarthropathy . Diabetes Care18 ( 1 ), 34 – 38 ( 1995 ).
- Tuttolomondo A , MaidaC , PintoA . Diabetic foot syndrome: Immune-inflammatory features as possible cardiovascular markers in diabetes . World J. Orthop.6 ( 1 ), 62 – 76 ( 2015 ).
- Mabilleau G , PetrovaN , EdmondsME , SabokbarA . Number of circulating CD14-positive cells and the serum levels of TNF-α are raised in acute Charcot foot . Diabetes Care34 ( 3 ), e33 ( 2011 ).
- Pasquier J , ThomasB , Hoarau-VechotJet al. Circulating microparticles in acute diabetic Charcot foot exhibit a high content of inflammatory cytokines, and support monocyte-to-osteoclast cell induction . Sci. Rep.7 ( 1 ), 16450 ( 2017 ).
- Petrova NL , EdmondsME . Acute Charcot neuro-osteoarthropathy . Diabetes Metab. Res. Rev.32 ( Suppl. 1 ), 281 – 286 ( 2016 ).
- Uccioli L , SinistroA , AlmerighiCet al. Proinflammatory modulation of the surface and cytokine phenotype of monocytes in patients with acute Charcot foot . Diabetes Care33 ( 2 ), 350 – 355 ( 2010 ).
- Mabilleau G , PetrovaNL , EdmondsME , SabokbarA . Increased osteoclastic activity in acute Charcot’s osteoarthropathy: the role of receptor activator of nuclear factor-κB ligand . Diabetologia51 ( 6 ), 1035 – 1040 ( 2008 ).
- Bartel DP . miRNAs: genomics, biogenesis, mechanism, and function . Cell116 ( 2 ), 281 – 297 ( 2004 ).
- Arroyo JD , ChevilletJR , KrohEMet al. Argonaute2 complexes carry a population of circulating miRNAs independent of vesicles in human plasma . Proc. Natl Acad. Sci. USA108 ( 12 ), 5003 – 5008 ( 2011 ).
- Chen X , BaY , MaLet al. Characterization of miRNAs in serum: a novel class of biomarkers for diagnosis of cancer and other diseases . Cell Res.18 ( 10 ), 997 – 1006 ( 2008 ).
- Weber JA , BaxterDH , ZhangSet al. The miRNA spectrum in 12 body fluids . Clin. Chem.56 ( 11 ), 1733 – 1741 ( 2010 ).
- Da Silveira JC , VeeramachaneniDN , WingerQA , CarnevaleEM , BoumaGJ . Cell-secreted vesicles in equine ovarian follicular fluid contain miRNAs and proteins: a possible new form of cell communication within the ovarian follicle . Biol. Reprod.86 ( 3 ), 71 ( 2012 ).
- Thomas MR , LipGY . Novel risk markers and risk assessments for cardiovascular disease . Circ. Res.120 ( 1 ), 133 – 149 ( 2017 ).
- Bayraktar R , Van RoosbroeckK , CalinGA . Cell-to-cell communication: miRNAs as hormones . Mol. Oncol.11 ( 12 ), 1673 – 1686 ( 2017 ).
- Borujeni MJS , EsfandiaryE , TaheripakG , Codoner-FranchP , Alonso-IglesiasE , MirzaeiH . Molecular aspects of diabetes mellitus: resistin, miRNA and exosome . J. Cell Biochem.119 ( 2 ), 1257 – 1272 ( 2018 ).
- Pasquier J , Hoarau-VechotJ , FakhroK , RafiiA , Abi KhalilC . Epigenetics and cardiovascular disease in diabetes . Curr. Diab. Rep.15 ( 12 ), 108 ( 2015 ).
- Rogers LC , FrykbergRG , ArmstrongDGet al. The Charcot foot in diabetes . Diabetes Care34 ( 9 ), 2123 – 2129 ( 2011 ).
- Sun Y , PengR , PengHet al. miR-451 suppresses the NF-κB-mediated proinflammatory molecules expression through inhibiting LMP7 in diabetic nephropathy . Mol. Cell Endocrinol.433 , 75 – 86 ( 2016 ).
- Kocijan R , MuschitzC , GeigerEet al. Circulating miRNA signatures in patients with idiopathic and postmenopausal osteoporosis and fragility fractures . J. Clin. Endocrinol. Metab.101 ( 11 ), 4125 – 4134 ( 2016 ).
- Kim BS , JungJY , JeonJY , KimHA , SuhCH . Circulating hsa-miR-30e-5p, hsa-miR-92a-3p, and hsa-miR-223-3p may be novel biomarkers in systemic lupus erythematosus . HLA88 ( 4 ), 187 – 193 ( 2016 ).
- Madhavan D , PengC , WallwienerMet al. Circulating miRNAs with prognostic value in metastatic breast cancer and for early detection of metastasis . Carcinogenesis37 ( 5 ), 461 – 470 ( 2016 ).
- Khan FH , PandianV , RamrajS , AravindanS , HermanTS , AravindanN . Reorganization of metastamiRs in the evolution of metastatic aggressive neuroblastoma cells . BMC Genomics16 , 501 ( 2015 ).
- Yan H , WangS , YuH , ZhuJ , ChenC . Molecular pathways and functional analysis of miRNA expression associated with paclitaxel-induced apoptosis in hepatocellular carcinoma cells . Pharmacology92 ( 3–4 ), 167 – 174 ( 2013 ).
- Zou M , WangF , GaoRet al. Autophagy inhibition of hsa-miR-19a-3p/19b-3p by targeting TGF-β R II during TGF-β1-induced fibrogenesis in human cardiac fibroblasts . Sci. Rep.6 , 24747 ( 2016 ).
- Tang Y , ZhangYC , ChenY , XiangY , ShenCX , LiYG . The role of miR-19b in the inhibition of endothelial cell apoptosis and its relationship with coronary artery disease . Sci. Rep.5 , 15132 ( 2015 ).
- Calimlioglu B , KaragozK , SevimogluT , KilicE , GovE , ArgaKY . Tissue-specific molecular biomarker signatures of Type 2 diabetes: an integrative analysis of transcriptomics and protein–protein interaction data . OMICS19 ( 9 ), 563 – 573 ( 2015 ).
- Liu D , LiYW , LuoGet al. LncRNA SPRY4-IT1 sponges miR-101-3p to promote proliferation and metastasis of bladder cancer cells through up-regulating EZH2* . Cancer Lett.388 , 281 – 291 ( 2017 ).
- Chang L , YuanYF , LiCCet al. Upregulation of SNHG6 regulates ZEB1 expression by competitively binding miR-101-3p and interacting with UPF1 in hepatocellular carcinoma . Cancer Letters383 ( 2 ), 183 – 194 ( 2016 ).
- Sun YX , ZhangJF , XuJet al. miRNA-144-3p inhibits bone formation in distraction osteogenesis through targeting Connexin 43 . Oncotarget8 ( 52 ), 89913 – 89922 ( 2017 ).
- Song J , KangYH , YoonS , ChunCH , JinEJ . HIF-1a: CRAT: miR-144-3p axis dysregulation promotes osteoarthritis chondrocyte apoptosis and VLCFA accumulation . Oncotarget8 ( 41 ), 69351 – 69361 ( 2017 ).
- Wang Y , ZhangYY , YangTet al. Long non-coding RNA MALAT1 for promoting metastasis and proliferation by acting as a ceRNA of miR-144-3p in osteosarcoma cells . Oncotarget8 ( 35 ), 59417 – 59434 ( 2017 ).
- Shen HX , LiWJ , TianYet al. Upregulation of miR-362-3p Modulates proliferation and anchorage-independent growth by directly targeting Tob2 in hepatocellular carcinoma . J. Cell. Biochem.116 ( 8 ), 1563 – 1573 ( 2015 ).
- Christensen LL , TobiasenH , HolmAet al. miRNA-362-3p induces cell cycle arrest through targeting of E2F1, USF2 and PTPN1 and is associated with recurrence of colorectal cancer . Int. J. Cancer133 ( 1 ), 67 – 78 ( 2013 ).
- Wang K , YuanY , ChoJH , McClartyS , BaxterD , GalasDJ . Comparing the miRNA spectrum between serum and plasma . PLoS One7 ( 7 ), e41561 ( 2012 ).
- Wang K , ZhangS , WeberJ , BaxterD , GalasDJ . Export of miRNAs and miRNA-protective protein by mammalian cells . Nucliec Acids Res.38 ( 20 ), 7248 – 7259 ( 2010 ).
- Mestdagh P , HartmannN , BaeriswylLet al. Evaluation of quantitative miRNA expression platforms in the miRNA quality control (miRQC) study . Nat. Methods11 ( 8 ), 809 – 815 ( 2014 ).
- Li Q , ChenL , ChenD , WuX , ChenM . Influence of miRNA-related polymorphisms on clinical outcomes in coronary artery disease . Am. J. Transl. Res.7 ( 2 ), 393 – 400 ( 2015 ).
- Neal CS , MichaelMZ , PimlottLK , YongTY , LiJY , GleadleJM . Circulating miRNA expression is reduced in chronic kidney disease . Nephrol. Dial. Transplant.26 ( 11 ), 3794 – 3802 ( 2011 ).