
Abstract
Aim: To investigate the integrated epigenetic regulation of acquired drug resistance in cancer. Materials & methods: Our gene expression data of five induced drug-tolerant cell models, one resistant cell line and one publicly available drug-resistant dataset were integrated to identify common differentially expressed genes and pathways. ChIP-seq and DNA methylation by HM450K beadchip were used to study the epigenetic profile of differential expressed genes. Results & conclusion: Integrated transcriptomic analysis identified a common ‘viral mimicry’ related gene signature in induced drug-tolerant cells and the resistant state. Analysis of the epigenetic regulation revealed a common set of down-regulated genes, which are marked and regulated by a concomitant loss of H3K4me3, gain of H3K9me3 and increment of regional DNA methylation levels associated with tumor suppressor genes and apoptotic signaling.
Recent breakthroughs in targeted therapies and immunotherapy offer improved therapeutic avenues for treating advanced cancers. However, despite the initial success and efficacy of these therapeutics, resistance inevitable develops in most cancer patients resulting in disease relapse and high morbidity. This is quite perplexing as different patients affected by the same cancer may experience resistance against therapy due, in part, to inter- and intratumoral heterogeneity, inherent resistant factors and acquired resistance mechanisms [Citation1,Citation2]. Recently it has been shown that therapeutic resistance can also develop without genetic perturbations. Several studies reported that a niche subpopulation of ‘cancer stem cells’ pre-exists within tumors which are selected upon exposure to drugs and due to the positive selection pressure can expand by their self-renewal properties [Citation3,Citation4]. Additionally, epigenetic reprogramming has also been implicated as a key nongenetic driver of drug resistance in cancer [Citation5,Citation6]. Besides DNA methylation-mediated acquired drug resistance [Citation7], dynamic chromatin modifications lead to therapeutic resistance. The H3K4me3 demethylases, KDM5A, KDM5B have been implicated in drug resistance expressed in a distinct slow-cycling subpopulation (termed drug-tolerant persisters [DTPs]) in response to targeted therapy [Citation8,Citation9]. In this regard, our group showed that KDM6B confers resistance to PI3K/AKT inhibitor in breast cancer [Citation10]. Moreover, a recent study identified that DTPs require the activation of repressive histone marks H3K9me3 and H3K27me3 to suppress the long-interspersed repeat element 1 (LINE1) in response to lethal dosages of targeted therapy [Citation11]. Accumulating evidence suggests that several epigenetic mechanisms might play a pivotal role in the dynamic adaptability of cancer cells to adverse conditions of various stressors. Whether multiple epigenetic factors (e.g., histone and DNA modifiers) contributing to the adaptive phenotypic plasticity act in cohort in a given cancer is unknown.
Along this line, we have previously reported that acquired drug resistance in melanoma develops through a transient innate response termed induced-drug-tolerant cells (IDTCs) and subsequently transitions to permanent resistance in long term if continuously exposed to targeted therapies through activation of multiple signaling cascades and epigenetic reprogramming [Citation12]. Following our initial study, we identified that transition from parental cancer cells to IDTCs requires a distinct histone reprogramming through activation of H3K9me3 and the loss of H3K4me3 and H3K27me3 marks. Alterations of DNA methylations in IDTCs rather occur in a cancer cell line specific manner [Citation13]. Therefore, we hypothesized that cancer cells might share epigenetic alterations of common genes and gene networks during acquired drug resistance.
To decipher common drivers of adaptive resistance and underlying epigenetic mechanisms for this transition, we have integrated gene expression arrays, ChiP-seq and DNA methylation array data. Despite the variability across different cancer models, we identified a small number of common genes (13) among IDTCs and the resistant model. To elaborate on these genes, we compared it with another reported resistant model of DTPs [Citation11], which depict a similar state as IDTCs [Citation12,Citation13], although the process of generating DTPs was different. DTPs share some commonly regulated genes with our models characterized by the enrichment of interferon and immune signaling, a phenomenon called ‘viral mimicry’ in response to stress [Citation11,Citation14]. Integrated genome-wide analysis of H3K9me3, H3K4me3 and DNA hypermethylation in melanoma IDTCs and the resistant model identified a subset of down-regulated genes which are regulated by these epigenetic modifications. Importantly, one of these down-regulated genes, SPRY4 involved in negative regulation of IFN signaling suggested a plausible mechanism of the consistent upregulation of IFN signaling in adaptive resistance.
Results
Congruity of differentially expressed genes in IDTCs & resistant model
Earlier we have reported that acquired drug resistance developed through a transient early drug resistance state, IDTC and progressed through permanent resistance in a melanoma model [Citation12]. WM164 IDTCs were generated within 12 days treatment with 500 nM of PLX4032 and prolonged treatment with PLX4032 for 90 days resulted in a permanent resistant state [Citation12]. Following on, IDTCs were generated in several other cancer cell lines such as WM1366 melanoma (5 nM docetaxel), A549-lung cancer (500 nM doxorubicin), HT29-colon cancer (25 nM dabrafenib, 10 nM trametinib) and HCC827-lung cancer (15 nM erlotinib) for 12–15 days of treatment (hereafter these IDTCs will be termed as ‘all IDTCs’) [Citation13].
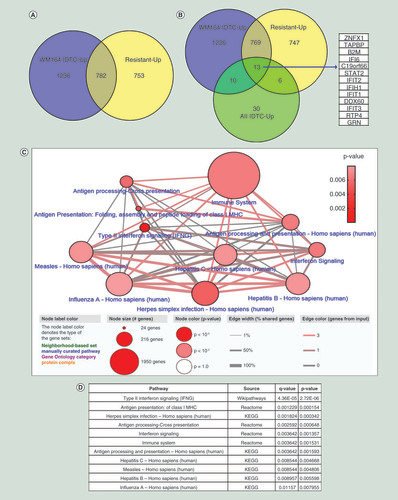
To identify similarity of genes that may be important of the transition toward acquired drug resistance in several cancer models, we have integrated differential expressed genes for each IDTCs, the DTPs and the permanent resistant state of melanoma. A representation of the workflow () and the integration of data () is shown. We found that both melanoma IDTCs and the resistant state share upregulated genes (28.2%) which are involved in various biological processes; some of them include positive regulation of metabolic processes, a cellular response to oxidative stress, Ras protein signal transduction and chromatin organization (, Supplementary Figure 1A). Melanoma IDTCs and resistant upregulated genes overlapped with genes upregulated in all IDTC models as described earlier [Citation13]. 13 upregulated genes (ZNFX1, TAPBP, B2M, IFI6, STAT2, IFIT2, IFIH1, IFIT1, DDX60, IFIT3, RTP4, GRN and RYDEN; FC ≥1.5 and p < 0.05) were identified as common in all sets tested (). This suggests that therapy-induced acquired drug resistance involves shared features of transcriptional reprogramming independent of cancer type and drug treatment.
(A) WM164, WM1366, A549, HT29 and HCC827 cells were exposed to either targeted or chemotherapy for 12–15 days to generate IDTCs [Citation12,Citation13]. WM164 cells were subjected to targeted therapy for 90 days to generate resistant cells [Citation12]. DTPs were generated as described previously [Citation11]. (B) Gene expression data of WM164 IDTC, resistant [Citation12] and IDTCs of WM1366, A549, HT29, HCC827 [Citation13] were integrated to identify common differentially expressed genes. This refers to IDTC models. Further differentially expressed genes of our IDTCs and resistant cells were integrated with other resistant dataset, namely DTPs [Citation11]. Common integrated genes were analyzed for enriched pathways. Differential expressed genes of all IDTCs and resistance were integrated with genome-wide DNA methylation and ChIP-seq of H3K4me3 and H3K9me3. Epigenetically regulated common genes were further investigated for enriched pathways and patient survival analysis from TCGA dataset.
DGE: Differential gene expression; DTP: Drug-tolerant persister; IDTC: Induced drug-tolerant cell; TCGA: The Cancer Genome Atlas.
![Figure 1. Schematic workflow. (A) WM164, WM1366, A549, HT29 and HCC827 cells were exposed to either targeted or chemotherapy for 12–15 days to generate IDTCs [Citation12,Citation13]. WM164 cells were subjected to targeted therapy for 90 days to generate resistant cells [Citation12]. DTPs were generated as described previously [Citation11]. (B) Gene expression data of WM164 IDTC, resistant [Citation12] and IDTCs of WM1366, A549, HT29, HCC827 [Citation13] were integrated to identify common differentially expressed genes. This refers to IDTC models. Further differentially expressed genes of our IDTCs and resistant cells were integrated with other resistant dataset, namely DTPs [Citation11]. Common integrated genes were analyzed for enriched pathways. Differential expressed genes of all IDTCs and resistance were integrated with genome-wide DNA methylation and ChIP-seq of H3K4me3 and H3K9me3. Epigenetically regulated common genes were further investigated for enriched pathways and patient survival analysis from TCGA dataset.DGE: Differential gene expression; DTP: Drug-tolerant persister; IDTC: Induced drug-tolerant cell; TCGA: The Cancer Genome Atlas.](/cms/asset/deb3383b-7e1b-4884-9705-c0ba9de5ad73/iepi_a_12323993_f0001.jpg)
(A) 2018 upregulated genes of the WM164 IDTC state and 1535 upregulated genes of the WM164 resistant state were selected from gene expression data according to their fold change (FC ≥1.5) and p-value (p < 0.05). (B) Further upregulated genes were integrated with the 59 upregulated genes of the four IDTC models (WM1366, A549, HT29, HCC827) corresponding to three cancer types including-melanoma, lung and colon cancers. A Venn diagram was generated through Venny 2.1 database (http://bioinfogp.cnb.csic.es/tools/venny/). (C) Enriched network and pathways of common upregulated genes. 13 commonly upregulated genes were uploaded in ConsensusPathDB database (http://cpdb.molgen.mpg.de/) with two minimum overlapping genes and a p-value cut-off 0.01. Node size represents the number of genes associated with the corresponding pathways; in other words, the large size of the node indicates a higher number of genes associated with the pathway. Edges of the connecting nodes are distributed according to the genes of input (edge color) and percentage of shared genes of each node (edge thickness). (D) Table showing the top enriched pathway derived from the either KEGG, Reactome or Wikipathways. Pathways are shown in ascending order according to higher p-value.
IDTC: Induced drug-tolerant cell.
Common upregulated genes are associated with antiviral response-related gene signatures
The thirteen common genes of all sets were further analyzed for enriched pathways. Likewise, the enriched pathway of the upregulated genes in all IDTCs was as described earlier [Citation13] and these enriched pathways also manifested as viral infection related immune signaling. Predominantly these common genes are associated with interferon signaling, type II interferon signaling, class I MHC antigen presentation, herpes simplex infection, immune system related pathway, hepatitis C and B infection and influenza virus infection ( & D). This response has been termed ‘viral mimicry’ as cells responded in a similar way as they would if challenged by a viral infection [Citation14,Citation15]. This implies that IDTCs and the resistant model are enriched for interferon and immune signaling related genes, which plausibly aided them to survive under stressful conditions at different states of drug resistance.
Commonality of resistance genes within other datasets
A recent study developed drug-tolerant cancer cells in the EGFR-mutant non-small-cell lung cancer (NSCLC) cell line PC9 by exposing them to higher concentrations (1 μM of erlotinib) of drugs for a period of 7–9 days [Citation11]. These cells were termed DTPs [Citation11]. In comparison to DTPs, our IDTCs were generated by exposing cancer cells to a sublethal dosage of either targeted therapy or chemotherapy for 12–15 days. However, we have also generated IDTCs with higher dosages of targeted therapy characterized by similar IDTC markers and epigenetic modifications [Citation12]. Therefore, we hypothesized that the drug-tolerant state might be comparable despite the variance of generating them. To investigate any common set of genes in another drug resistance model, we compared and integrated our IDTCs with DTPs. Gene expression data integration identified a set of 20 common upregulated genes (BMPR2, ZBTB20, IRF9, C4orf33, HLA-F, HLA-G, TRIM22, ZNFX1, TAPBP, B2M, IFI6, STAT2, IFIT2, IFIH1, IFIT1, DDX60, IFIT3, RTP4, GRN, RyDEN) among WM164 IDTCs, all IDTCs and DTPs (Supplementary Figure 2A). Moreover, integration of WM164 IDTCs, WM164 resistant, all IDTCs and DTPs upregulated genes (cut-off fold change FC ≥1.5 and p < 0.05) resulted in 13 common genes (ZNFX1, TAPBP, B2M, IFI6, STAT2, IFIT2, IFIH1, IFIT1, DDX60, IFIT3, RTP4, GRN, RyDEN;Supplementary Figure 2B). Interestingly, the 13 common genes identified in this integration study were also identified in WM164 IDTC, resistant and all IDTC sets as described in the earlier section (). Fold change of common genes are shown as a heatmap (Supplementary Figure 2C).
The 20 common genes were used to identify affected gene pathways in all IDTC models and DTPs by KEGG enrichment analysis. We found that IFN-α signaling, Type II IFN signaling, Type III IFN signaling, herpes simplex infection, viral carcinogenesis, adaptive immune system and antigen processing and presentation were the most enriched pathways (Supplementary Figure 2D). This shows that the transcriptional changes observed in our model of induced drug tolerance are also visible in models of other groups that are generated during a slightly different experimental setup, suggesting that both models are describing the similar biological process contributing to adaptive resistance.
Common downregulated genes associated with important GO biological processes
A total of 33% of the downregulated genes overlapped between IDTC and resistant WM164 cells. KEGG pathway enrichment analysis suggests that ribosome biogenesis, purine and pyrimidine metabolism, metabolic pathways, cell cycle, DNA replication and protein processing are the most affected pathways due to the down-regulation of the gene sets associated with WM164 IDTC and resistant cells (Supplementary Figure 3A–C). This implies interception of several biological pathways associated with cell cycle, DNA replication and metabolism, which are required by cancer cells to sustain a slow proliferative state and, later on, progression to acquired resistance.
Comprehensive epigenetic regulation of the differentially expressed genes
The active histone mark H3K4me3 has been reported to overlap active gene promoter regions thus enabling transcription through binding of transcription factors and RNA polymerases [Citation16]. Therefore, upregulated genes of WM164 IDTCs and WM164 resistant cells were integrated with H3K4me3 ChIP-seq marked genes. A total of 77 genes were identified as significantly marked and regulated by H3K4me3 comprising ectoderm differentiation, D-myo-inositol-associated pathways and neural crest differentiation (p < 0.005; Supplementary Figure 3D & E).
Previously, we have identified that the genome-wide DNA methylation patterns in different IDTC models changed individually according to the parental DNA methylome [Citation13]. Therefore, while histone modifications were found to be global in different IDTCs, differentially methylated genes were not unified across different types of IDTCs [Citation13]. However, several studies reported that DNA methylation and repressive histone marks such as H3K9me3 might act in cohort to downregulate a subset of genes in cancer [Citation17,Citation18]. Therefore, we hypothesized that DNA hypermethylation and the repressive histone mark, H3K9me3 might contribute to transcriptional down-regulation of a subset of genes.
Herein, downregulated genes of WM164 IDTC and all IDTCs were integrated with the repressive histone mark, H3K9me3 and DNA hypermethylation of WM164 IDTCs. We found that only four of these genes (GNPNAT1, UCK2, NUP50, POLR1E) were marked by H3K9me3. Additionally, no common genes were identified when downregulated genes in all IDTC models were integrated with both DNA methylation and H3K9me3 marked genes (Supplementary Figure 4A & B). Along this line, integrated analysis of the downregulated genes of all IDTC models, DTPs with DNA methylation and H3K9me3 marked genes did not identify any common genes as expected (data not shown). This confirms that DNA methylation may be cell line or cancer type-specific. Therefore, further analysis of epigenetic regulation of the downregulated genes was performed for WM164 IDTC and WM164 resistant models.
To this end, we have integrated the genome-wide H3K9me3 marked genes by ChIP-seq, and DNA methylation-associated genes with the downregulated genes of WM164 IDTC. A total of 28 downregulated genes were found to be marked by DNA hypermethylation and the repressive histone mark, H3K9me3 (). Furthermore, downregulated genes of WM164 IDTCs and WM164 resistant cells were integrated with hypermethylated genes and H3K9me3 marked genes. A total of 20 downregulated genes were found to be commonly marked by H3K9me3 and DNA hypermethylation (). Fold changes of the common downregulated genes are shown as a bar diagram (). DNA methylation levels of the 20 common downregulated genes were plotted with the beta-value of methylation for WM164 IDTC compared with the parental methylation level ().
(A) A total of 2432 downregulated genes of WM164 IDTC were integrated with 4931 H3K9me3 marked genes from ChIP-seq and 308 hypermethylated genes from 450K genome-wide DNA methylation study in WM164 IDTC compared with parent. downregulated genes were selected with a fold change cut off FC ≤-1.5 and p-value; p < 0.05. (B) 2432 and 1645 downregulated genes of WM164 IDTC and resistant were overlaid with 4931 H3K9me3 marked genes and 308 hypermethylated genes. Venny 2.1 database was used to generate all Venn’s diagrams. (C) Fold change of the common downregulated genes are shown as a heat map without clustering. (D) A heat map was generated with the mean β values of DNA methylation of the common genes. β values of methylation of WM164 parent and IDTC were taken from genome-wide methylation of the arrays of the corresponding parental and IDTC cells. (E) DNA methylation and gene expression data of WM164 IDTC versus parent were loaded onto the UCSC genome browser. Representative peaks of DNA methylation are shown for IGFBP5 surrounded by a red box. (F) Following on, H3K4me3 and H3K9me3 ChIP-seq data were integrated with gene expression of the similar sets as mentioned in (E). H3K4me3 marking was selected near the transcriptional start site (TSS) and CpG island region while H3K9me3 peaks were highlighted within the 5’-UTR distal region. All the data are shown in a 20 Kb window. ChIP-seq data normalized and compared with their parental cells as described in our earlier study [Citation13] and peak intensity shown for WM164IDTC (H3K4me3 or H3K9me3). Dark and gray color represents increase and decrease of a given histone mark, respectively.
IDTC: Induced drug-tolerant cell.
![Figure 3. Genes downregulated by epigenetic modifications. (A) A total of 2432 downregulated genes of WM164 IDTC were integrated with 4931 H3K9me3 marked genes from ChIP-seq and 308 hypermethylated genes from 450K genome-wide DNA methylation study in WM164 IDTC compared with parent. downregulated genes were selected with a fold change cut off FC ≤-1.5 and p-value; p < 0.05. (B) 2432 and 1645 downregulated genes of WM164 IDTC and resistant were overlaid with 4931 H3K9me3 marked genes and 308 hypermethylated genes. Venny 2.1 database was used to generate all Venn’s diagrams. (C) Fold change of the common downregulated genes are shown as a heat map without clustering. (D) A heat map was generated with the mean β values of DNA methylation of the common genes. β values of methylation of WM164 parent and IDTC were taken from genome-wide methylation of the arrays of the corresponding parental and IDTC cells. (E) DNA methylation and gene expression data of WM164 IDTC versus parent were loaded onto the UCSC genome browser. Representative peaks of DNA methylation are shown for IGFBP5 surrounded by a red box. (F) Following on, H3K4me3 and H3K9me3 ChIP-seq data were integrated with gene expression of the similar sets as mentioned in (E). H3K4me3 marking was selected near the transcriptional start site (TSS) and CpG island region while H3K9me3 peaks were highlighted within the 5’-UTR distal region. All the data are shown in a 20 Kb window. ChIP-seq data normalized and compared with their parental cells as described in our earlier study [Citation13] and peak intensity shown for WM164IDTC (H3K4me3 or H3K9me3). Dark and gray color represents increase and decrease of a given histone mark, respectively.IDTC: Induced drug-tolerant cell.](/cms/asset/7f2df841-5a79-4001-b282-45028a9b9098/iepi_a_12323993_f0003.jpg)
![Figure 3. Genes downregulated by epigenetic modifications. (A) A total of 2432 downregulated genes of WM164 IDTC were integrated with 4931 H3K9me3 marked genes from ChIP-seq and 308 hypermethylated genes from 450K genome-wide DNA methylation study in WM164 IDTC compared with parent. downregulated genes were selected with a fold change cut off FC ≤-1.5 and p-value; p < 0.05. (B) 2432 and 1645 downregulated genes of WM164 IDTC and resistant were overlaid with 4931 H3K9me3 marked genes and 308 hypermethylated genes. Venny 2.1 database was used to generate all Venn’s diagrams. (C) Fold change of the common downregulated genes are shown as a heat map without clustering. (D) A heat map was generated with the mean β values of DNA methylation of the common genes. β values of methylation of WM164 parent and IDTC were taken from genome-wide methylation of the arrays of the corresponding parental and IDTC cells. (E) DNA methylation and gene expression data of WM164 IDTC versus parent were loaded onto the UCSC genome browser. Representative peaks of DNA methylation are shown for IGFBP5 surrounded by a red box. (F) Following on, H3K4me3 and H3K9me3 ChIP-seq data were integrated with gene expression of the similar sets as mentioned in (E). H3K4me3 marking was selected near the transcriptional start site (TSS) and CpG island region while H3K9me3 peaks were highlighted within the 5’-UTR distal region. All the data are shown in a 20 Kb window. ChIP-seq data normalized and compared with their parental cells as described in our earlier study [Citation13] and peak intensity shown for WM164IDTC (H3K4me3 or H3K9me3). Dark and gray color represents increase and decrease of a given histone mark, respectively.IDTC: Induced drug-tolerant cell.](/cms/asset/cf6bffeb-7229-471c-810d-4ebc8b67eccd/iepi_a_12323993_f0004.jpg)
ChIP-seq of H3K9me3 and H3K4me3, DNA methylation and gene expression data were further analyzed upon integration onto UCSC genome browser data. The two most significantly downregulated genes according to fold change and p-value, IGFBP5 and SPRY4 were selected out of 20 common epigenetically downregulated genes. It was notable that a regional loss of H3K4me3 mark near the transcriptional start site (TSS), regional increase of DNA methylation level near the shore region (<2 Kb of TSS) and an increase of H3K9me3 mark distal to the TSS (>5 Kb of TSS, 5′ UTR region) may led to transcriptional down-regulation of IGFBP5 and SPRY4 ( & F, Supplementary Figure 4C & D). Interestingly, an earlier study reported that SPRY4 protein plays a pivotal role in the negative regulation of IFN signaling and IFN inducible biological responses [Citation19]. SPRY 1,2,4 triple knock out in mouse embryonic fibroblast led to enhanced IFN-dependent antiviral response [Citation19]. Therefore, down-regulation of SPRY4 through epigenetic modifications may alleviate the negative regulation on IFN signaling resulting in common IFN-related gene signatures in our IDTCs and resistant cells.
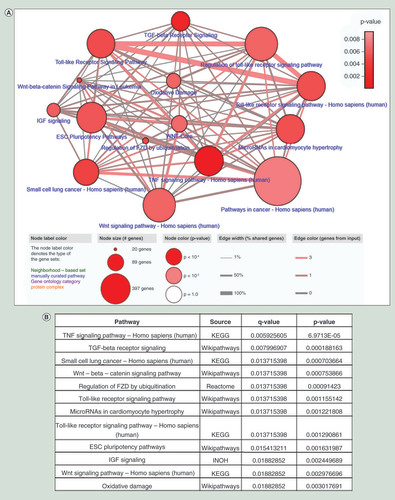
A total of 28 downregulated genes in IDTCs regulated by DNA methylation and H3K9me3 histone modification were tested for enriched pathways. Pathway enrichment analysis suggests that TNF, TGF-β receptor, Toll-like receptor, Wnt and the ESC pluripotency signaling pathways are downregulated ( & B). This implies that down-regulation of TGF-β, TNF and Toll-like receptor signaling might be important for survival of cancer cells under drug exposure.
(A) A total of 28 epigenetically regulated common downregulated genes were analyzed through ConsensusPathDB database (http://cpdb.molgen.mpg.de/) with two minimum overlapping genes and p-value cut-off 0.01. (B) Top 12 enriched pathways are shown according to p and q values.
ESC: Embryonic stem cell.
Downregulated genes are associated with hypermethylated promoters in SKCM patients
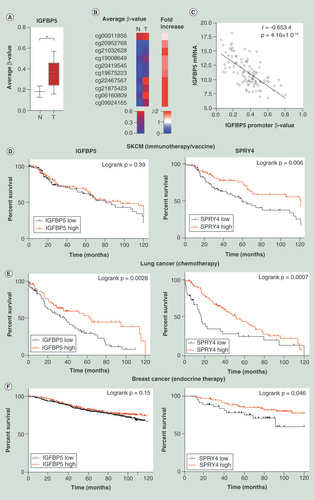
We analyzed the DNA methylation level of epigenetically marked downregulated genes through the TCGA database. Skin cutaneous melanoma (SKCM) DNA methylation data was analyzed compared with normal skin tissue samples. The average IGFBP5 promoter DNA methylation level was significantly higher in primary melanoma than in normal skin tissue (p < 0.05; Mann–Whitney U test; ), and each of the ten probes/samples showed an increased β-value (). The IGFBP5 mRNA expression level also negatively correlated with the promoter DNA methylation level (Spearman r = -0.6534; p = 4.16 × 10⁻¹⁴; ). Additionally, 12 genes (out of 20 downregulated genes) were found to be significantly hypermethylated in the promoter region of SKCM tumor samples (p < 0.05; Supplementary Figure 5A). Moreover, the hypermethylated genes were found to be negatively correlated with the expression level of the corresponding genes corroborating the in vitro findings (Supplementary Figure 5B). Although we have analyzed the differential methylation and gene expression in normal tissue versus SKCM patients, there may be similar epigenetic alterations involved in melanoma progression as aberrant methylation is involved in therapeutic resistance in melanoma patients [Citation20].
(A) Average β value of ten promoter probes of IGFBP5 were plotted for SKCM primary tumors (n = 105) and normal sample (n = 2). Statistical analysis was performed by the Mann–Whitney U test where * indicates p < 0.05. (B) An unsupervised histogram was generated based on the β value of each probe without any clustering. (C)IGFBP5 mRNA expression data of melanoma patients were taken from SKCM hi-seq TCGA dataset and plotted with the promoter β value of the same gene (n = 105). (D) A Kaplan–Meier (KM) plot was generated for IGFBP5 and SPRY4 for SKCM patients with immunotherapy or vaccine therapy. Expression value was sorted according to the median (n = 175). (E) KM plot was generated for these genes with lung cancer and breast cancer. Expression values were taken from a subset of lung cancer patients with chemotherapy (n = 176), (F) a subset of breast cancer patients (n = 867) and sorted according to low and high expression from the median of the corresponding genes. Statistical analysis was performed by log rank p-value. All the survival duration was censored to 120 months.
SKCM: Skin cutaneous melanoma.
Survival analysis of downregulated genes
To decipher the association of downregulated genes commonly regulated by epigenetic modifications with survival in cancer patients, we further analyzed overall survival in SKCM, lung cancer and breast cancer patients. The two most downregulated genes – SPRY4 and IGFBP5, were selected to proceed with outcome data analyses. Kaplan–Meier plots were generated to assess the overall survival of cancer patients upon treatment with either immunotherapy, chemotherapy or endocrine therapy. Survival data of a subset of SKCM patients with immunotherapy and vaccine suggest that down-regulation of SPRY4 is significantly associated with poor overall survival (p = 0.006) although down-regulation of IGFBP5 was not significant (p = 0.39) but shows a trend to poor survival (). Additionally, low expression of IGFBP5 and SPRY4 was found to be significantly associated with poor survival in a subset of lung and breast cancer patients with chemotherapy and endocrine therapy, respectively (lung cancer- IGFBP5: p = 0.0028, SPRY4: p = 0.0007; breast cancer – IGFBP5: p = 0.15, SPRY4: p = 0.046) ( & F). Moreover, low expression of IGFBP5 and SPRY4 is also significantly associated with overall poor survival in SKCM, lung cancer and breast cancer, except IGFBP5 of SKCM (IGFBP5: p = 0.235, SPRY4: p = 0.0014, SKCM; IGFBP5: p < 0.0001, SPRY4: p < 0.0001, lung cancer and IGFBP5: p = 0.0043, SPRY4: p = 0.001, breast cancer; Supplementary Figure 6A–C).
This suggests that down-regulation of IGFBP5 and SPRY4 might be associated with cancer progression under treatment which is in line with recent studies describing the tumor suppressor role of IGFBP5 and SPRY4 in different cancer types [Citation21,Citation22].
Discussion
Our previous study in melanoma revealed that IDTC transition developed through activation of multiple signaling cascades and epigenetic remodeling which consecutively progressed to the permanent resistant state [Citation12,Citation23]. Following on, we have identified a concomitant loss of the active histone mark H3K4me3 and global increment of a repressive histone mark H3K9me3 was associated with transcriptional down-regulation of a subset of genes leading to the slow proliferative transient multidrug-tolerant state. The IDTC state was reversible and sensitive upon silencing of histone modifiers SETDB1/2 of H3K9me3 underpinning the importance of the epigenetic modifiers in acquired drug resistance and cancer progression [Citation13].
In this study, we have integrated differentially expressed genes of WM164 IDTC and four IDTC models representative of melanoma, lung and colon cancer with the WM164-resistant cells. Commonly integrated genes were enriched with viral mimicry related IFN inducible pathways. Moreover, upregulated genes of IDTCs and the resistant cells were integrated with a published resistant model called DTP which resembles our approach [Citation11]. This also identified the same subset of common genes enriched in IFN signaling, immune signaling and viral infection related pathways, which is in line with a plethora of earlier findings where it has been reported that IFN-related gene signatures led to resistance against chemotherapy, immunotherapy or radiotherapy in different cancer types [Citation24–27]. We have identified a common signature of 13 genes in all drug resistance models. Some of the genes have been implicated in drug resistance and cancer progression. IFI6 has been identified as highly upregulated upon treatment with chemotherapeutic drugs. Increased expression of IFI6 can attenuate apoptosis and confer resistance [Citation28]. IFIT1, IFIT3 have been reported to be associated with regional metastasis and resistance to cisplatin in oral squamous cell carcinoma [Citation29]. DDX60 has been related to carcinoma progression in oral squamous cell carcinoma associated with poor prognosis [Citation30]. A recent study identified IFIH1 as one of the topmost upregulated genes in chemo-resistant ovarian cancer cells [Citation31]. However, out of the 13 genes ZNFX1, TAPBP, B2M, STAT2, IFIT2, RTP4, GRN, RyDEN have never been reported before to be involved in adaptive drug resistance suggesting a novel finding of this study. It has been shown that BRAF and MEK inhibitors induce an inflammatory response [Citation32] and hence up-regulation of IFN signaling led to adaptive resistance both in vitro and in vivo [Citation33,Citation34]. In line, another study reported that IFN-α and IFN-β are continuously secreted by cells upon DNA damage induced by drugs or other stressors [Citation35]. Resistant cancer cells can also produce IFNs by pro-survival cytokines IL6, IL8 [Citation36] or by growth factors such as EGF or PDGF [Citation26]. Therefore, it is plausible that stress-induced DNA damage could produce IFNs in IDTCs initially and growth factors and other cytokines along with IFN-α and IFN-β enhance the production of more IFN-related genes in a positive feedback manner.
Some of the IFN-related genes are also regulated by histone marks. Increment of the H3K27me3 mark by EZH2 can repress several immune regulators including chemokines (CCL28, CCL3L1, CXCL9), and IFN response genes (IFI6 and IRF9) in cancer [Citation37]. However, our study demonstrated a consistent loss of H3K27me3 mark in all IDTC models [Citation13]. This might partially explain the activation of IFN and immune signaling related gene signatures (such as, IFI6) accompanying the decrease of the H3K27me3 mark. Regulatory regions of IFN-related genes such as TRIM22, IFIH1, and IFI6 were found to be more accessible through ATAC-seq in the DTPs compared with parental cells [Citation11]. This also might be another mechanism of upregulation of few IFN-related genes like TRIM22, IFIH1, IFI6 from the 13 common gene signatures in IDTCs and resistant models. These cumulative findings imply that the 13 IFN-related gene signature is important for transition of the tolerant state to permanent drug resistance.
To underpin the role of epigenetic modifications in regulation of gene expression as well as their role in regulating IFN-related signaling, we have integrated gene expression data with ChIP-seq and DNA methylation. We have reported that DNA methylation changes are presumable not global due to the differences of the methylome in each cancer cell type [Citation13]. Thus, combined histone modifications, H3K9me3, H3K4me3 and DNA hypermethylation were now probed for the transcriptionally downregulated genes in a melanoma IDTC and resistant model. Overlay data suggest that a subset of downregulated genes is marked and might be regulated by an increase of the repressive histone mark, H3K9me3 in the distal region to the TSS (>5 Kb of TSS), a regional increase at the shore site (<2 kb of TSS) of DNA hypermethylation and concomitant loss of the H3K4me3 mark near the TSS. Importantly, SPRY4 which is one of the topmost significantly downregulated genes marked by H3K9me3 and DNA methylation has been previously reported as a potent negative regulator of type 1 IFN signaling and gene signatures [Citation19]. Therefore, it can be inferred that epigenetic marks induced down-regulation of SPRY4 may led to upregulation of IFN-related gene signatures resulting in drug resistance.
Pathway enrichment analyses showed that TGF-β signaling, TLR signaling and TNF receptor signaling were some of the major pathways of epigenetically downregulated genes. Earlier studies depicted the role of TGF-β signaling in apoptosis in an SAPK-dependent manner by activating pro-apoptotic genes such as Bim, Bax and Bmf [Citation38]. TGF-β signaling also exerts its tumor suppressive effect [Citation39] and prevents cancer cell immortalization through SMAD, p38 and JNK pathways [Citation40]. TLR signaling has been implicated as negative regulators of cancer. Stimulation of TLR signaling promotes apoptosis, increases vascular permeability resulting in tumor regression and activates NK and cytotoxic T-cell-mediated tumor lysis by recruiting leukocytes [Citation41,Citation42]. TNF signaling is considered as complex and divergent which can induce cell death and or co-stimulation depending on the cellular context. Although it is paradoxical, however, several studies reported that activation of TNF and TNF receptor signaling can promote apoptosis by activation of NF-kB signaling. Induction of recombinant TNF or LPS-mediated TNF signaling promotes tumor regression in vivo [Citation43,Citation44]. Therefore, it can be anticipated that these pathways need to be downregulated to promote cancer progression.
Common epigenetically downregulated genes in IDTCs and resistant conditions were further analyzed for promoter methylation in SKCM patients compared with healthy individuals from TCGA data. Consistently, we have observed that most gene sets were significantly hypermethylated (p < 0.05) in SKCM patients compared with normal skin tissue of healthy individuals and hypermethylation was inversely associated with gene expression. The top two downregulated genes SPRY4 and IGFBP5 were analyzed for overall survival in SKCM. We found that lower expression of these two genes was associated with poorer overall survival corroborating our in vitro findings. SPRY4 is an RTK signaling antagonist originally identified as a negative feedback player of RTK signaling [Citation45], SPRY4 has been reported as a tumor suppressor by inhibiting growth, migration and proliferation in different cancer types such as lung, colon and breast cancers [Citation22,Citation46]. Ectopic expression of SPRY4 led to tumor sensitivity in breast cancer [Citation47]. Another study has shown that inhibiting SPRY4 enhances cancer stem cells like properties [Citation48]. IGFBP5 was identified as a potent inhibitor of IGF1 signaling [Citation49]. IGFBP5 is the most conserved among six IGFBPs and has been reported to be dysregulated in different cancer types [Citation50]. Additionally, the different domains of IGFBP5 exert distinct effects on tumorigenicity and metastasis of different cancers [Citation51,Citation52]. A recent study reported that overexpression of IGFBP5 suppresses epithelial–mesenchymal transition in melanoma cells and downregulates ERK1/2 and p38-MAPK signaling through inhibition of IGF1R [Citation21]. This is in line with our present findings where we observed down-regulation of SPRY4 and IGFBP5 by H3K9me3 and hypermethylation led to IDTC transition and cancer cell survival. However, until now there is no study reporting the role of IGFBP5 and SPRY4 in drug resistance. Therefore, our study reveals the novel role of IGFBP5 and SPRY4 in drug resistance that might be regulated by epigenetic modifications. However, this study is limited to integration of high-throughput data and the in silico analysis. This outcome highly demands a detailed in vitro and functional studies to corroborate our findings.
In summary, the transition of parental cells to IDTCs/DTPs/permanent resistance may require activation of key signaling pathways such as PI3K-Akt, mTOR aided by IFN-related gene signatures and down-regulation of several signaling cascades such as TNF, TGF-β, TLR signaling and key tumor suppressor proteins such as SPRY4 and IGFBP5 to activate RTK signaling such as pERK signaling. Additionally, down-regulation of SPRY4 might led to consistent upregulation of IFN-related genes. Epigenetic regulations of these differentially regulated genes play a critical role for combating stress conditions and promote growth by reshaping the genome and epigenome. Epigenetic modifiers of key histone modifications and DNA hypermethylations might be potential targets along with current targeted therapies and chemotherapy to prevent acquired drug resistance in cancer.
Future perspective
We have identified an interferon signaling related signature comprising 13 genes characteristic for adaptive drug tolerance in cancer. Additionally, cancer cells epigenetically downregulate two tumor suppressor genes SPRY4 and IGFBP5 which are negative regulators of IFN signaling and thus promote survival and resistance. It will be important to validate the epigenetic regulation through in vitro experiments and investigate the functionality of these genes in the context of drug resistance and cancer progression. It will be also interesting to see whether ectopic overexpression of SPRY4 and IGFBP5 can prevent IFN signaling reversing adaptive resistance.
Drug resistance stems from intrinsic factors, adaptive mechanisms or nongenetic mechanisms such as epigenetic modifications.
We have recently reported that transient induced drug-tolerant cells (IDTCs) develop through distinct histone reprogramming.
The underlying mechanism of common IDTC transition in regards to epigenetic regulation of differential expressed genes is unknown.
Here we sought to investigate a common epigenetic regulation for the transition of acquired drug resistance.
Transcriptomic data integration of IDTCs, resistant and drug-tolerant persisters identified enriched pathways for immune signaling, and type 1,2 IFN signaling.
Differentially expressed genes might be regulated by epigenetic reprogramming represented by a concomitant loss of the H3K4me3 mark near TSS and gain of the H3K9me3 mark distal to the TSS (>5 Kb of TSS) and gain of DNA hypermethylation near TSS.
Commonly epigenetically regulated downregulated genes are associated with tumor suppressor function (IGFBP5, SPRY4) enriched with apoptotic signaling pathways such as TGF-β and TNF-α signaling.
Low expression of IGFBP5 and SPRY4 was associated with poor overall survival in melanoma, breast and lung cancer patients upon treatment with immunotherapy, chemotherapy and endocrine therapy (p < 0.05).
Our study revealed a common signature of 13 upregulated genes related to IFN signaling, which define IDTCs, drug-tolerant persisters and the resistant state.
Integrated epigenetically downregulated genes associated with tumor suppressors and apoptotic signaling which are decisive for acquired drug resistance in cancers.
Supplemental Document 1
Download Zip (42.4 MB)Supplementary Information
To view the supplementary data that accompany this paper please visit the journal website at: www.tandfonline.com/doi/full/10.2217/epi-2018-0173
Financial & competing interests disclosure
This work is supported by the Epiderm Foundation, the Princess Alexandra Hospital Research Foundation (PARSS2016_NearMiss) and Soroptimist International Club Goldes Southern Styria, Austria. The methylation arrays were performed using the Adelson Medical Research Foundation grant (DSBH). AA Emran is funded by The University of Queensland International Scholarship (UQI); H Hammerlindl is funded by an UQCent/IPRS scholarship; F Ahmed is funded by UQI Scholarship. The authors have no other relevant affiliations or financial involvement with any organization or entity with a financial interest in or financial conflict with the subject matter or materials discussed in the manuscript apart from those disclosed.
No writing assistance was utilized in the production of this manuscript.
Additional information
Funding
References
- Dagogo-Jack I , ShawAT. Tumour heterogeneity and resistance to cancer therapies. Nat. Rev. Clin. Oncol.15(2), 81–94 (2018).
- Holohan C , Van SchaeybroeckS , LongleyDB , JohnstonPG. Cancer drug resistance: an evolving paradigm. Nat. Rev. Cancer13(10), 714–726 (2013).
- Trumpp A , WiestlerOD. Mechanisms of disease: cancer stem cells – targeting the evil twin. Nat. Clin. Practice Oncol.5(6), 337–347 (2008).
- Dean M , FojoT , BatesS. Tumour stem cells and drug resistance. Nat. Rev. Cancer5(4), 275–284 (2005).
- Glasspool RM , TeodoridisJM , BrownR. Epigenetics as a mechanism driving polygenic clinical drug resistance. Br. J. Cancer94(8), 1087–1092 (2006).
- Easwaran H , TsaiHC , BaylinSB. Cancer epigenetics: tumour heterogeneity, plasticity of stem-like states, and drug resistance. Mol. Cell54(5), 716–727 (2014).
- Zeller C , DaiW , SteeleNLet al. Candidate DNA methylation drivers of acquired cisplatin resistance in ovarian cancer identified by methylome and expression profiling. Oncogene31(42), 4567–4576 (2012).
- Sharma SV , LeeDY , LiBet al. A chromatin-mediated reversible drug-tolerant state in cancer cell subpopulations. Cell141(1), 69–80 (2010).
- Roesch A , Fukunaga-KalabisM , SchmidtECet al. A temporarily distinct subpopulation of slow-cycling melanoma cells is required for continuous tumor growth. Cell141(4), 583–594 (2010).
- Wang W , LimKG , FengMet al. KDM6B counteracts EZH2-mediated suppression of IGFBP5 to confer resistance to PI3K/AKT inhibitor treatment in breast cancer. Mol. Cancer Therap.17(9), 1973–1983 (2018).
- Guler GD , TindellCA , PittiRet al. Repression of stress-induced LINE-1 expression protects cancer cell subpopulations from lethal drug exposure. Cancer Cell32(2), 221–237 (2017).
- Ravindran Menon D , DasS , KreplerCet al. A stress-induced early innate response causes multidrug tolerance in melanoma. Oncogene34(34), 4448–4459 (2015).
- Emran AA , MarzeseDM , MenonDRet al. Distinct histone modifications denote early stress-induced drug tolerance in cancer. Oncotarget9(9), 8206–8222 (2018).
- Roulois D , LooYau H , SinghaniaRet al. DNA-demethylating agents target colorectal cancer cells by inducing viral mimicry by endogenous transcripts. Cell162(5), 961–973 (2015).
- Liu M , OhtaniH , ZhouWet al. Vitamin C increases viral mimicry induced by 5-aza-2´-deoxycytidine. Proc. Natl Acad. Sci. USA113(37), 10238–10244 (2016).
- Schubeler D , MacalpineDM , ScalzoDet al. The histone modification pattern of active genes revealed through genome-wide chromatin analysis of a higher eukaryote. Genes Development18(11), 1263–1271 (2004).
- Li H , RauchT , ChenZX , SzaboPE , RiggsAD , PfeiferGP. The histone methyltransferase SETDB1 and the DNA methyltransferase DNMT3A interact directly and localize to promoters silenced in cancer cells. J. Biological Chem.281(28), 19489–19500 (2006).
- Leung D , DuT , WagnerUet al. Regulation of DNA methylation turnover at LTR retrotransposons and imprinted loci by the histone methyltransferase Setdb1. Proc. Natl Acad. Sci. USA111(18), 6690–6695 (2014).
- Sharma B , JoshiS , SassanoAet al. Sprouty proteins are negative regulators of interferon (IFN) signaling and IFN-inducible biological responses. J. Biol. Chem.287(50), 42352–42360 (2012).
- Goltz D , GevenslebenH , VogtTJet al. CTLA4 methylation predicts response to anti–PD-1 and anti–CTLA-4 immunotherapy in melanoma patients. JCI. Insight3(13), pii: 96793 (2018).
- Wang J , DingN , LiYet al. Insulin-like growth factor binding protein 5 (IGFBP5) functions as a tumor suppressor in human melanoma cells. Oncotarget6(24), 20636–20649 (2015).
- Wang J , ThompsonB , RenC , IttmannM , Kwabi-AddoB. Sprouty4, a suppressor of tumor cell motility, is down-regulated by DNA methylation in human prostate cancer. Prostate66(6), 613–624 (2006).
- Hammerlindl H , SchaiderH. Tumor cell-intrinsic phenotypic plasticity facilitates adaptive cellular reprogramming driving acquired drug resistance. J. Cell Commun. Signal.12(1), 133–141 (2018).
- Khodarev NN , BeckettM , LabayE , DargaT , RoizmanB , WeichselbaumRR. STAT1 is overexpressed in tumors selected for radioresistance and confers protection from radiation in transduced sensitive cells. Proc. Natl Acad. Sci. USA101(6), 1714–1719 (2004).
- Weichselbaum RR , IshwaranH , YoonTet al. An interferon-related gene signature for DNA damage resistance is a predictive marker for chemotherapy and radiation for breast cancer. Proc. Natl Acad. Sci. USA105(47), 18490–18495 (2008).
- Khodarev NN , MinnAJ , EfimovaEVet al. Signal transducer and activator of transcription 1 regulates both cytotoxic and prosurvival functions in tumor cells. Cancer Res.67(19), 9214–9220 (2007).
- Benci JL , XuB , QiuYet al. Tumor interferon signaling regulates a multigenic resistance program to immune checkpoint blockade. Cell167(6), 1540–1554 (2016).
- Tahara E Jr , TaharaH , KannoMet al. G1P3, an interferon inducible gene 6–16, is expressed in gastric cancers and inhibits mitochondrial-mediated apoptosis in gastric cancer cell line TMK-1 cell. Cancer Immunol. Immunother.54(8), 729–740 (2005).
- Yen Ai-Hsin , ChenY-C , VijayaKumar Pidugu , LiuChung-Ji , LeeTe-Chang. Association of interferon-induced protein with tetratricopeptide repeats 1 and 3 expression with regional metastasis and drug resistance in oral squamous cell carcinoma. Cancer Res.74(19), 40 (2014).
- Fu TY , WuCN , SieHCet al. Subsite-specific association of DEAD box RNA helicase DDX60 with the development and prognosis of oral squamous cell carcinoma. Oncotarget7(51), 85097–85108 (2016).
- Januchowski R , SterzynskaK , ZawieruchaPet al. Microarray-based detection and expression analysis of new genes associated with drug resistance in ovarian cancer cell lines. Oncotarget8(30), 49944–49958 (2017).
- Wilmott JS , HayduLE , MenziesAMet al. Dynamics of chemokine, cytokine, and growth factor serum levels in BRAF-mutant melanoma patients during BRAF inhibitor treatment. J. Immunol.192(5), 2505–2513 (2014).
- Wagner S , VlachogiannisG , DeHaven Brandon Aet al. Suppression of interferon gene expression overcomes resistance to MEK inhibition in KRAS-mutant colorectal cancer. Oncogene38(10), 1717–1733 (2018).
- Liu D , LiuX , XingM. Activities of multiple cancer-related pathways are associated with BRAF mutation and predict the resistance to BRAF/MEK inhibitors in melanoma cells. Cell Cycle (Georgetown, Tex.)13(2), 208–219 (2014).
- Yu Q , KatlinskayaYV , CarboneCJet al. DNA-damage-induced type I interferon promotes senescence and inhibits stem cell function. Cell Reports11(5), 785–797 (2015).
- Efimova EV , LiangH , PitrodaSPet al. Radioresistance of Stat1 over-expressing tumor cells is associated with suppressed apoptotic response to cytotoxic agents and increased IL6-IL8 signaling. Internat. J. Radiation Biol.85(5), 421–431 (2009).
- Tiffen JC , GallagherSJ , TsengHY , FilippFV , FazekasDe St Groth B , HerseyP. EZH2 as a mediator of treatment resistance in melanoma. Pigment Cell Melanoma Res.29(5), 500–507 (2016).
- Ohgushi M , KurokiS , FukamachiHet al. Transforming growth factor beta-dependent sequential activation of Smad, Bim, and caspase-9 mediates physiological apoptosis in gastric epithelial cells. Mol. Cell Biol.25(22), 10017–10028 (2005).
- Go C , LiP , WangXJ. Blocking transforming growth factor beta signaling in transgenic epidermis accelerates chemical carcinogenesis: a mechanism associated with increased angiogenesis. Cancer Res.59(12), 2861–2868 (1999).
- Lacerte A , KorahJ , RoyM , YangXJ , LemayS , LebrunJJ. Transforming growth factor-beta inhibits telomerase through SMAD3 and E2F transcription factors. Cell Signal.20(1), 50–59 (2008).
- Rakoff-Nahoum S , MedzhitovR. Toll-like receptors and cancer. Nat. Rev. Cancer9(1), 57–63 (2009).
- Salaun B , CosteI , RissoanMC , LebecqueSJ , RennoT. TLR3 can directly trigger apoptosis in human cancer cells. J. Immunol.176(8), 4894–4901 (2006).
- Sedger LM , McDermottMF. TNF and TNF-receptors: from mediators of cell death and inflammation to therapeutic giants – past, present and future. Cytokine Growth Factor Rev.25(4), 453–472 (2014).
- Carswell EA , OldLJ , KasselRL , GreenS , FioreN , WilliamsonB. An endotoxin-induced serum factor that causes necrosis of tumors. Proc. Natl Acad. Sci. USA72(9), 3666–3670 (1975).
- Mason JM , MorrisonDJ , BassonMA , LichtJD. Sprouty proteins: multifaceted negative-feedback regulators of receptor tyrosine kinase signaling. Trends Cell. Biol.16(1), 45–54 (2006).
- Tennis MA , Van ScoykMM , FreemanSV , VandervestKM , NemenoffRA , WinnRA. Sprouty-4 inhibits transformed cell growth, migration and invasion, and epithelial–mesenchymal transition, and is regulated by Wnt7A through PPARgamma in non-small cell lung cancer. Mol. Cancer Res.8(6), 833–843 (2010).
- Vanas V , MuhlbacherE , KralR , Sutterluty-FallH. Sprouty4 interferes with cell proliferation and migration of breast cancer-derived cell lines. Tumour Biol.35(5), 4447–4456 (2014).
- Jing H , LiawL , FrieselR , VaryC , HuaS , YangX. Suppression of Spry4 enhances cancer stem cell properties of human MDA-MB-231 breast carcinoma cells. Cancer Cell Int.16, 19 (2016).
- Ding M , BruickRK , YuY. Secreted IGFBP5 mediates mTORC1-dependent feedback inhibition of IGF-1 signaling. Nat. Cell Biol.18(3), 319–327 (2016).
- Gullu G , KarabulutS , AkkiprikM. Functional roles and clinical values of insulin-like growth factor-binding protein-5 in different types of cancers. Chinese J. Cancer31(6), 266–280 (2012).
- Akkiprik M , HuL , SahinA , HaoX , ZhangW. The subcellular localization of IGFBP5 affects its cell growth and migration functions in breast cancer. BMC Cancer9, 103 (2009).
- Luther GA , LamplotJ , ChenXet al. IGFBP5 domains exert distinct inhibitory effects on the tumorigenicity and metastasis of human osteosarcoma. Cancer Lett.336(1), 222–230 (2013).