
Abstract
Aim: Fetal alcohol spectrum disorder (FASD) involves prenatal growth delay, impaired facial and CNS development and causes severe clinical, social-economic burdens. Here, we aim to detect DNA-methylation aberrations associated with FASD and potential FASD diagnostic and prognostic biomarkers. Patients & methods: The FASD diagnosis was established according to golden-standard protocols in a discovery and independent replication cohort. Genome-wide differential methylation association and replication analyses were performed. Results: We identified several loci that were robustly associated with FASD or one of its sub phenotypes. Our findings were evaluated using previously reported genome-wide surveys. Conclusion: We have detected robust FASD associated differentially methylated positions and differentially methylated regions for FASD in general and for FASD subphenotypes, in other words on growth delay, impaired facial and CNS development.
The effect of prenatal exposure to alcohol on the fetal development is a severe, prevalent and worldwide medical issue. The term fetal alcohol spectrum disorders (FASD) was coined as an umbrella term to describe a wide variety of phenotypic effects, of which fetal alcohol syndrome (FAS) is at the most severe end of the spectrum. Although it is generally recognized that FASD is a ubiquitous condition, prevalence data for most countries are lacking. Recently, the prevalence of alcohol usage during pregnancy has been estimated at approximately 10% for all pregnancies, with a prevalence of FAS of approximately 1.5/1000 people in the general population. Each year 119,000 children with FAS are born worldwide [Citation1]. The birth prevalence of all FASDs is estimated to be much higher [Citation2,Citation3]. The burden of FASD on society is severe as it is a lifelong condition with sustained restrictions on daily functioning and a lifelong need for medical, psychological and general support [Citation4]. Estimating the prevalence of FASD has been hindered by difficulties in recognizing the condition. The diagnosis of FASD is based on clinical grounds only, but in practice it proves to be difficult because many different clinical diagnostic criteria have been developed in the past [Citation5]. Currently, the two most important sets of criteria are the FASD diagnostic 4-digit code and the revised Institute of Medicine criteria [Citation6–8]. Still, underdiagnoses and misdiagnosis remain a serious problem in clinical practice [Citation9]. To date there is no general molecular biomarker known for FASD diagnosis. A biochemical test for FASD has been reported in the literature, namely fatty acid ethyl esters in neonatal meconium, but this method represents a biomarker for ethanol exposure of the fetus during pregnancy rather than a predictive tool for clinical FASD symptomatology in later life [Citation10]. By definition, an essential environmental factor is involved in the etiology of FASD, in other words of in utero alcohol exposure [Citation11]. This suggests an important role for epigenetics contributing to the manifestation of FASD. [Citation12–15]. Other prenatal environmental factors such as maternal smoking or malnutrition during a period of famine have been shown to alter the postnatal DNA-methylation status of numerous genes [Citation16,Citation17]. However, to date the number of (genome-wide) epigenetic surveys on FASD patients is limited. Studies in human and mice mainly focused on the prenatal alcohol exposure rather than the FASD phenotype [Citation18–21]. Furthermore, the umbrella term FASD comprises numerous affected neurological and physiological systems and can therefore be characterized as a complex disease. This complexity does not only complicate clinical diagnosis, but also the research focusing on the underlying molecular mechanisms of FASD. Decreasing the phenotypic heterogeneity, especially in a relatively small sample, is thus essential in genome-wide surveys of FASD [Citation22,Citation23]. Therefore, we hypothesized that adequate screening of both patients and controls (screen-negatives) and a subsequent phenotypic stratification, for example based on the FASD 4-digit code, might contribute to the elucidation of the underlying FASD molecular mechanisms and favors the detection of potential diagnostic biomarkers and potential prognostic biomarkers for FASD respectively.
In this study we describe a genome-wide DNA-methylation association study (EWAS) on FASD, including a discovery set of 39 well-characterized cases and 64 controls and a replication set of seven well characterized cases and 28 controls. We aimed to detect differentially methylated loci between FASD patients and controls. Second, we aimed to detect loci specifically associated with FASD subphenotypic features. These loci might contribute to the future discovery of novel FASD diagnostic and prognostic biomarkers and may help to gain more insight into the molecular mechanisms involved in FASD.
Patients & methods
Participants & selection procedure
This study is part of an international collaboration between the Amsterdam Medical Center and two Polish institutes: the department of Social Pediatrics and the department of Genetics of the Medical University of Wroclaw and the department of Molecular Biology of the Medical University of Bialystok. The discovery cohort consists of 39 FASD cases and 64 nonalcohol exposed controls. The replication cohort consists of seven FASD patients and 28 healthy controls. Patient inclusion was as follows: all patients with FASD in the discovery group were recruited in Poland and of Polish descent. Originally, 56 children, locally known with a suspected diagnosis of FASD, were seen. All 56 children were seen by two or more clinicians with experience in the clinical diagnosis of FASD (JM Cobben, K Pesz, J Niklinski and MA Chomczyk). The clinical assessment consisted of a thorough anamnesis (usually heteroanamnesis by foster parents) and physical examination. Pictures were taken using standardized methods and blood was sampled from all included patients. Informed written consent was obtained from all patients/caretakers. The study was approved by the medical Ethical Committees of the Wroclaw University Hospital, and the Medical University of Bialystok, Poland and by the medical Ethical Committee of the Academic Medical Center, Amsterdam, The Netherlands. In order to exclude patients carrying any copy number variation, comparative genomic hybridization analyses were performed on all subjects using Agilent 180K oligo-array, Amadid 023363, according to the manufacturer’s instructions. In total 17 out of 56, FASD patients were excluded from analyses which are described in detail in Supplementary File 1. Of all 39 patients included in the discovery group, the 4-digit code falls into the groups A–C and E–I as defined by S Astley in 2004. The patients included in the replication group involved a subset of FASD patients that has been described in the literature before [Citation24]. These nine patients all have been included and live in The Netherlands and are mostly, just like the patients in the discovery group, of Polish descent. Clinical characteristics of both discovery and replication cohorts were evaluated using ANOVA for continuous variables and Fisher’s exact tests for categorical variables, as performed in SPSS (version 20.0.0, IBM® SPSS® Statistics).
Genome-wide DNA-methylation profiling
A flow scheme of the analysis pipeline is illustrated in Supplementary Figure 6. DNA was isolated from whole blood. The DNA samples of both the discovery and replication cohort were bisulfite converted using the EZ DNA Methylation™ kit of Zymo Research, according to the manufacturer’s protocol. Subsequently, converted DNA was submitted for genome-wide DNA-methylation profiling using the Human methylation 450K beadchip array of Illumina. Quality control of the 450K dataset was performed using the ‘R’ package MethylAid. Normalization of the 450K dataset was performed using quantile normalization [Citation25]. Subsequently, normalization quality (density plots) and concordance between sex chromosome probes and self-reported sex were evaluated. Next, the following probes were removed from the dataset: probes located on the sex chromosome, probes previously described to involve polymorphic sites minor allele frequency (MAF >0.01), probes known to be susceptible to crosshybridization [Citation26]. Finally, in order to elucidate potential phenotypic confounding effects, principal component analysis was performed. Correlations of the principal components 1–8 with all available variables were evaluated upon entering our statistical model.
Differential methylation
For both the discovery cohort and the replication cohort, estimation of leukocyte cell distribution was performed using to the method of Houseman et al., yielding for each sample, information on relative cell counts of CD8+ and CD4+ T cells, natural killer cells, B cells, monocytes and granulocytes [Citation27]. Next, we performed differentially methylated position (DMP) analyses between cases and controls using the ‘R’ minfi package [Citation28]. In total, we performed four different analyses, in other words on the whole sample and on three subsets of the whole sample, stratified for the 4-digit code extremes (score 3 and 4) of the FASD subphenotypes [Citation6]. This stratification yielded three subsets of samples, namely on: growth, facial and CNS, reflecting a prognostic value as well. Several quality control analyses, for example addressing the accuracy of the used statistical models or possible inflation of our results caused by unknown bias, were performed which are described in detail in Supplementary File 1, Supplementary Table 4 and Supplementary Figure 7. In addition, we searched for differentially methylated regions (DMR) in the same four samples using the bumphunter function of the minfi package [Citation29]. DMRs were defined to involve three or more (L > 2) CpG sites (for DMP and DMR analyses see also: ‘description of statistical models’ section, Supplementary File 1). Replication of DMRs was defined by a similar direction of effect, and an overlap of the DMRs covering at least one single CpG site (Supplementary File 1& Supplementary Figure 9). General FASD potential biomarkers (FPBs) were defined by replicated DMRs that were detected in every sample analysis, in other words the whole sample, and the growth, facial and CNS extremes according to the 4-digit scores (described in detail in Supplementary File 1). Moreover, DMRs that were replicated conform these criteria in studies of others, were also denoted as FPBs and involved at least three DMPs. In addition, we also focused on potential prognostic tools. For this, we similarly defined potential biomarkers for each of the three subphenotypes that were exclusively detected in one of these three FASD subphenotypes.
Technical validation of replicated DMRs
Technical validation of four DMRs, annotated to the genes GLI2, TNFRSF19, DTNA and NECAB3, was performed using a targeted bisulfite next generation sequencing technique based on Illumina MiSEQ platform, described in detail in Supplementary File 1. Primer sequences are described in Supplementary Table 6. Technical validation was based on linear least squares between 450K and MiSEQ data using the mean methylation index of all overlapping CpG sites. A correlation coefficient (R2, equal to the square Pearson correlation coefficient) >0.85 was assumed successful.
Results
Characteristics subjects
Characteristics of both the discovery cohort and the replication cohort are described in . All subjects in the discovery cohort and in the replication cohort were nonsmoking. We observed in either cohort no significant sex distribution differences (). Mean age differed between FASD and controls of the discovery cohort in the sample as a whole, and in the subsets representing extreme measures regarding growth delay, impaired facial development and impaired CNS development. The overlap within individuals of extreme measures (score 3 or 4) regarding subphenotypes growth, facial, and CNS impairments was substantial in the discovery cohort but not in the replication cohort (Supplementary File 1 & Supplementary Figure 4). No age differences were observed between patients and controls in the replication cohort. All patients and controls in the discovery cohort were from caucasian (Polish) descent, implying that correction for population stratification within this sample was not necessary. The majority of patients and controls in the replication cohort were caucasian (Dutch nationality, Polish ancestry).
Characteristics of both the discovery cohort and the replication cohort are described in . All subjects in the discovery cohort and in the replication cohort were nonsmoking. We observed in either cohort no significant sex distribution differences (). Mean age differed between FASD and controls of the discovery cohort in the sample as a whole, and in the subsets representing extreme measures regarding growth delay, impaired facial development and impaired CNS development. The overlap within individuals of extreme measures (score 3 or 4) regarding subphenotypes growth, facial, and CNS impairments was substantial in the discovery cohort but not in the replication cohort (Supplementary File 1 & Supplementary Figure 4). No age differences were observed between patients and controls in the replication cohort. All patients and controls in the discovery cohort were from caucasian (Polish) descent, implying that correction for population stratification within this sample was not necessary. The majority of patients and controls in the replication cohort were caucasian (Dutch nationality, Polish ancestry).
Table 1. Characteristics of fetal alcohol spectrum disorder patients and nonalcohol exposed controls.
Differentially methylated positions associated with FASD
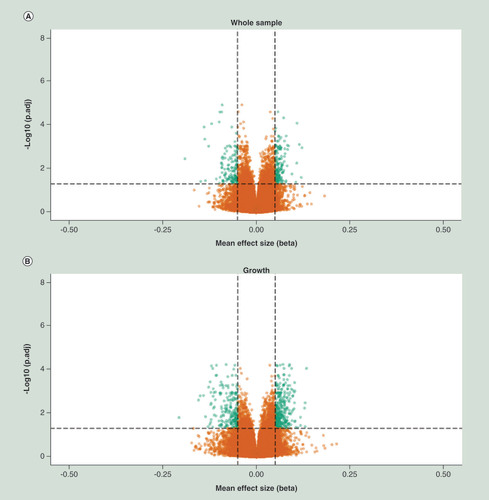
Evaluation of the quality of the human methylation 450k data is described in Supplementary File 1. We performed association analyses by means of the detection of differentially methylated positions (DMPs) between cases and controls in both the discovery and replication cohort. These DMP association analyses were performed for the whole sample and the three FASD subphenotypes represented by the upper two extremes as defined by the 4-digit score, on growth delay, facial abnormalities and impaired CNS development. shows the volcano plots of each of these analyses of the discovery cohort, where the X-axis represents the effect size, expressed as mean methylation difference, between groups and the Y-axis represents the -log 10 of the adjusted p-value (BH Benjamini-Hochberg). In the discovery cohort we detected 1638, 1576, 920 and 1720 genome wide significant DMPs for the whole sample, growth, facial and CNS respectively (Supplementary Table 1). In the replication cohort, we detected a substantially lower number of genome wide significant DMPs, in other words 3, 3, 60 and 1 for the whole sample, growth, facial and CNS respectively (Supplementary Table 1). In the discovery cohort as well as in the replication cohort, these significant findings were spread over the whole genome (Supplementary Figure 8). Summarizing the effect of the top 2000 DMPs for all analyses of the discovery and replication cohort, we observed a trend toward hypermethylation of these DMPs, in other words an average of 859 DMPs were hypomethylated versus an average of 1141 DMPs that were hypermethylated (Supplementary Table 1) in FASD patients. It should be noted that the majority of these top 2000 DMPs reflect small effect sizes, but the observation of a trend toward hypermethylation was consistent across the two cohorts. Moreover, further evaluation of the top 2000 DMPs and genome wide significant DMPs indicated that hypomethylation was clearly enriched at the gene body and promoter regions (annotated as TSS1500) in FASD patients in the discovery cohort. The trend toward enrichment of hypermethylation was primarily observed in the first exons of genes in FASD patients in the discovery cohort (SSupplementary Table 1, Supplementary Figures 2A & B). Although not genome-wide significant, a similar feature enrichment trend was observed in the replication cohort ( & D). The overlap of genome-wide significant DMPs detected in the discovery cohort and their association values in the replication cohort is described in . We assumed a p-value <1.8 × 10⁻³ in the replication cohort as significant (multiple test penalty based on Bonferroni), accordingly we replicated in the whole sample 11 DMPs.
X-axis represent mean effect size difference between fetal alcohol spectrum disorder cases and controls, Y-axis represents the –log10 of the adj. P-value. Horizontal dotted line represents genome wide significance threshold, vertical dotted lines indicates an effect size (delta mean difference) of 5%. Green dots represents genome wide significant differentially methylated positions with an absolute effect size larger than 5%.
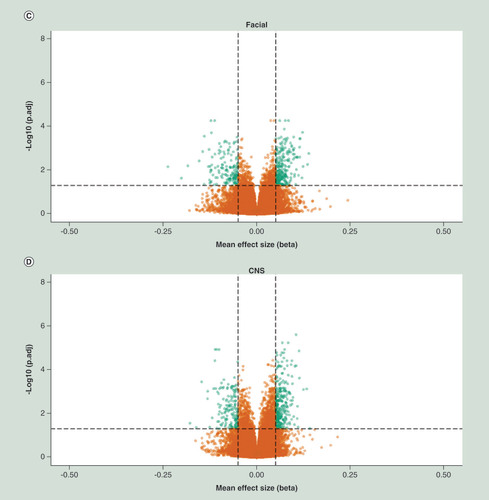
Relative percentage hypo (A) and hyper (B) methylation over the genomic features (TSS1500, TS200, 5’UTR, 1stExon, Body, 3’UTR and IGR) of the top 2000 DMP hits for each of the four analyses (whole sample, growth, CNS and facial FAS sub phenotypes) of the discovery cohort), relative to the total number of the feature in the analyzed dataset of 429.232 probes. Percentage hypo (C) and hyper (D) methylation over the genomic features (TSS1500, TS200, 5’UTR, 1stExon, Body, 3’UTR and IGR) of the top 2000 DMP hits for each of the four analyses (whole sample, growth, CNS and facial FAS sub phenotypes) of the replication cohort), relative to the total number of the feature in the analyzed dataset of 429.232 probes.
DMP: Differentially methylated position; FAS: Fetal alcohol syndrome; IGR: Intergenic region; TSS1500: Region 1500 bp upstream relative to the transcription start site of the annotated gene; TSS200: Region 200 bp upstream relative to the transcription start site of the annotated gene; UTR: Untranslated.
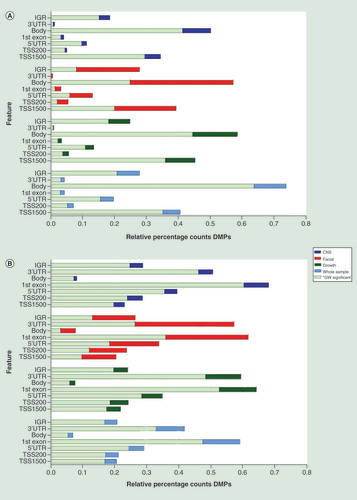
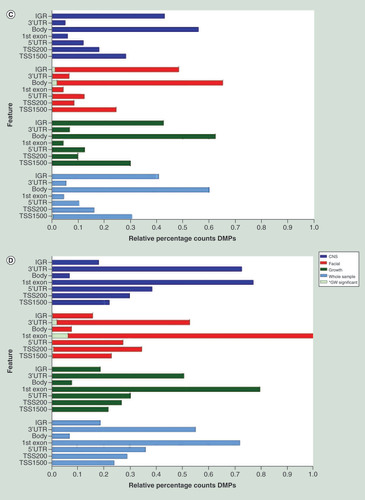
Table 2. Replication of genome wide significant differentially methylated positions detected in discovery cohort.
Next, we evaluated the DMPs that were reported by others. First, we studied the DMPs reported by Lussier et al. (2018), involving 161 replicated DMPs of the previously reported DMPs of Portales-Casamar et al. (2016). In total we observed that within our top2000 DMPs, nine of these 161 DMPs showed genome-wide significant association with FASD or with one of the three subphenotypic FASD features (Supplementary Table 1). Four of these replicated DMPs were annotated to the transcription start site of the C22orf42, MAGOH, NDST4 and the UQCRC1 genes and three DMPs were annotated to the first exon or gene body of the CELSR3, MRPS2 and the WDR5 genes. Finally, two DMPs annotated to distant intergenic regions of the ANKFN1 and SLC27A3 genes. Second, we evaluated the DMPs reported by Sharp et al. (2018) whose study also included a replication analysis of the loci of Lussier et al. Sharp et al. reported on both blood cell adjusted and nonadjusted associations. Since all our models involved adjustment for blood cell distribution, only Sharp et al. (Supplementary Tables 2, 4, 6, 8 and 10) were searched through (Supplementary Table 1). We found significant association (adjusted according Bonferroni) and concurrent direction of effect between studies with six DMPs, involving three DMPs annotated to the gene body of GALT, one DMP annotated to the IGR of NEAT1 gene, one DMP annotated to the gene body of KCNK5 and one DMP annotated to the IGR of MIR4458HG. All these associations, except for the probe annotated to NEAT1, were replicated in both the whole sample and the three FASD extreme sub phenotypes.
Subsequently, we searched for overlap between replicated DMPs in the whole sample and the three different FASD subphenotypes analyzed ( & Supplementary Figure 5). We found no overlapping DMPs between the whole sample analysis and the 4-digit code growth sample. We did, however, observe seven DMPs overlapping between the whole sample and CNS subsample, one of which was also found to be consistently associated in the extremes of the facial sample subset. One DMP observed in the growth sample subset was also detected in the CNS sample subset and one DMP was consistently associated in both the facial and CNS subset samples. In both the whole sample and the facial subset sample, four independent DMPs were detected and in the CNS subset sample one unique DMP was detected.
DMRs associated with FASD
Next, we focused on DMRs associated with FASD in the whole sample and in the three subsamples regarding the 4-digit code extremes on growth, facial and CNS. Post hoc selection criteria for these DMRs were set to include three or more probes (L > 2) within the DMR cluster. Supplementary Table 2 describes the DMRs discovered in the discovery and replication cohort. In total, we detected 53 DMRs in the whole sample of the discovery cohort, 113 DMRs in FASD growth, 122 DMRs in FASD facial and 82 DMRs in the FASD CNS sample. Of the latter DMRs, one DMR (MIR886) was genome-wide significantly associated in the FASD whole sample as well as in the CNS subset sample. Similar our findings regarding the DMPs, we observed a trend toward enrichment of hypermethylation in all detected DMRs of the discovery cohort. In the replication cohort, we detected 166 DMRs in the whole sample, 350 DMRs in growth subset, 630 DMRs in the facial subset and 175 DMRs were detected in the CNS subset sample. Genome-wide significant association of the DMR located near the promoter of the GSTT1 gene (22q11.23) was observed in both the whole sample and the CNS subset of the replication cohort. Moreover, in the latter sample sets, we also detected a genome-wide significant DMR annotated to the promoter region of GSTTP1 (22q11.23), a pseudo gene located approximately 35 kb downstream of the GSTT1 gene (Supplementary Table 2). Applying the basic local alignment search tool on all the involved probes of the DMRs of the GSTT1 and the GSTTP1 gene did not indicate any event of crosshybridization (data not shown). In contrast to what we observed in the discovery cohort, in the replication cohort we observed an opposite trend with regard to the direction of effects in the DMRs; namely enrichment of hypomethylation. Subsequently, we addressed the replication of significant DMRs. Successful replication was defined as DMRs detected in both the discovery and replication cohort and overlapping for at least a single CpG site and comprising the same direction of effect, as described in Supplementary Figure 9 and Supplementary File 1. Conform these criteria we detected 8, 33, 26 and 17 DMRs that overlapped between the discovery and the replication cohort in the whole sample, growth facial and CNS 4-digit samples respectively (Supplementary Table 2). Transcription start site and gene body annotations were clearly over-represented for these DMRs (Supplementary Table 2, tab ‘DMR_Feature_enrichment’).
Potential biomarker discovery
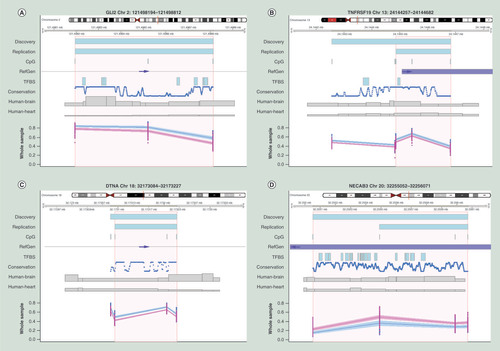
The consistency of association of a differentially methylated region is not only important in relation to the molecular mechanisms underlying FASD, but also for the identification of one or more potential FASD biomarker(s). Therefore, we subsequently focused on the exact positions of overlapping regions of the confirmed DMRs. Criteria for these exact regions are as described in Supplementary Figure 9, Supplementary File 1, conform example B. First, we determined which DMRs were detected in the whole sample, and in the three subsamples for maximum 4-digit code in growth, facial and CNS of both the discovery and replication cohort, reflecting a general potential FASD biomarker per se. In total we detected three hypermethylated DMRs, located in or nearby the GLI2, TNFRSF19 and DNTA genes, all including three or more CpG sites ( & ). The DMRs at the TNFRSF19 and DNTA genes represented the TSS200 region while the DMR at the GLI2 gene was located at an intergenic region. Hierarchical clustering of the eight probes covering the general FPBs, detected within this study, showed a clear differentially methylation pattern between FASD patients and controls (Supplementary File 1 & Supplementary Figure 10).
Table 3. Potential biomarker-replicated differential methylated regions associated in all fetal alcohol spectrum disorder groups.
(A) Differentially methylated region (DMR) located in an upstream intergenic region of the GLI2 locus, (B) DMR located in an exon of the TNFRSF19 locus, (C) DMR located at an intronic intergenic region of the DNTA locus, (D) DMR located in an exon of the NECAB3 locus. All plots indicate the exact chromosomal position of DMRs detected in the discovery and replication cohort or the area (NECAB3) as reported by Portales-Casamar et al. respectively, annotated by the upper two blue bars. Area in orange represents exact position of the region of overlap between DMR detected in the discovery and replication cohort.
Blue and pink dots and lines represent fetal alcohol spectrum disorder (wholes sample only) patients and controls respectively, shading represents 95% CI. All chromosomal positions are based on hg19.
Conservation: Conservation of the sequence among 100 vertebrates (NCBI annotation); CpG: Location of known CpG sites; Human-Brain and Human-Heart: Brain and heart specificsummary of known active regulatory regions (e.g. enhancers), summarized as ‘Emerge’, as previously reported by van Duijvenbode et al. (2016); RefGen: Location of the reference gene (NCBI annotation) and the direction of transcription (blue arrows); TFBS: Summary of known transcription factor binding sites (NCBI annotation); X-axis: chromosomal position; Y-axis: methylation index expressed in beta-values.
Subsequently, we searched for literature evidence for any of our identified DMRs, whether they were detected in other FASD studies in humans. We confirmed the previously described FASD association of Portales-Casamar et al. regarding a hypomethylated DMR located in the gene body of the NECAB3 gene. A subsequent report (Lussier et al., 2018) of this group, comprising an additional 24 FASD cases and 24 controls, applying replication and machine-learning analysis approaches, did not detect the NECAB3 locus again. Furthermore, our detected DMRs, annotated to the GSST1, GSTTP1, GLI2, TNFRSF19 or DNTA genes, were not observed in either the study of Portales-Casamar et al. or the study of Lussier et al. Although maternal alcohol consumption rather than FASD was investigated in the study of Sharp et al., we searched for replication of the 19 DMRs they detected using the Comb-P method. None of these 19 DMRs were detected in our study.
Next, we hypothesized that FASD subphenotype specific potential biomarker would be informative for clinical prognosis. Therefore, we screened throughout our confirmed DMRs for exclusive associations with specific FASD 4-digit code subphenotypes, in other words on growth delay, facial abnormalities or impaired CNS development. We found that 17 DMRs were exclusively detected in FASD growth extremes, 14 DMRs were exclusively detected in the FASD facial extremes and seven DMRs were exclusively detected in the impaired CNS development extremes (). Hierarchical clustering of all probes covering the FASD subphenotype specific FPBs did not show a clear differentially methylation pattern between FASD patients and controls (data not shown).
Table 4. Potential fetal alcohol spectrum disorder biomarkers-replicated differential methylated regions associated in exclusively specific fetal alcohol spectrum disorder subphenotypes.
Finally, technical validation was based on the four DMRs located at the GLI2, TNFRSF19, DNTA and NECAB3 genes () that showed consistent association in the FASD whole samples. For this, DNA-methylation was obtained using targeted bisulfite sequencing (Supplementary File 1 & Supplementary Figure 10) in which we observed a high correlation (R2 = 0.9; p = 2.9 × 10⁻⁶) in relation to the 450K dataset.
Discussion
Patient inclusion
In the present study, patient inclusion was based on an acknowledged FASD diagnosis tool, the 4-digit code FASD criteria [Citation6]. In binary trait association studies, not only the heterogeneity of the patient sample is important, but the heterogeneity of the controls is equally important. For this reason, our control group involved screen negatives with regard to alcohol exposure in utero. Furthermore, ethnicity, age and gender were included as selection criteria within both groups of our discovery and replication cohorts. The discovery cohort and the majority of patients in the replication cohort were from Polish origin. Controlling for confounding factors, such as ethnic background and a proper selection procedure of cases and controls for age and gender, is assumed to favor statistical power [Citation30,Citation31]. The mean age of FASD cases and controls of the discovery cohort showed a significant difference that was addressed in the quality control of our dataset (Supplementary File 1). The FASD previously has been described to involve an impaired immune function [Citation32]. In this study, we included blood cell type admixture according a well-accepted method [Citation27]. In brief, this method estimated for each samples the distribution of the most abundant blood cell types. Subsequently, these relative estimates were incorporated in the statistical model. This method thus adjusts for individual differences but, by definition, we cannot exclude that the differential DNA-methylation signals that we have detected originated from one particular cell type. Recently, Lussier et al. reported on the effects of prenatal alcohol exposure in mice [Citation33]. This well-designed study showed clear differential methylated patterns between alcohol exposed and control mice over different tissues. Although FASD was not specifically addressed in this study, the study did suggest that peripheral blood can be used as surrogate for DNA-methylation alterations in the CNS system. A cardinal finding of our study, is that our differentially methylated position analyses suggest that DNA-methylation is systemically (i.e., genome-wide aberrant DNA methylation) affected in FASD patients (, Supplementary File 1, Supplementary Figure 8 & Supplementary Table 1), but shows a large interindividual variation. Such a systemic methylation effect has also been observed for several other syndrome diseases, such as down syndrome, 22q11 deletion syndrome and Sézary syndrome [Citation34–36]. Still, our genome-wide DNA-methylation association study is limited by some assumptions and by technical or biological bias, which is described in detail in Supplementary File 1.
Replication analyses
Apart from studying our own discovery and replication cohorts, we performed replication analysis of our findings based on three reports: Portales-Casamar et al., Lussier et al. and Sharp et al. [Citation37–39]. The study of Portales-Casamar et al. included a relatively large sample of 110 FASD cases and 96 controls for which DNA-methylation profiles were obtained from buccal epithelial cells using the 450K DNA-methylation bead-chip of Illumina. Although this study was relatively well powered, the authors acknowledged some limitations of their study; the distribution of the ethnic origin between cases and controls was imbalanced, and the characterization of patients included both subjects exposed to alcohol and subjects diagnosed with FASD, suggesting that the cases represented a phenotypically heterogeneous sample. Recently, this research group replicated their previously found FASD associated loci in an additional study comprising 24 FASD cases and 24 controls, Lussier et al., 2018. In the latter study, the authors applied a machine learning algorithm by which they studied the value of DNA-methylation profiles to predict FASD, involving hundreds of DMPs and validated the specificity of this predictive algorithm in a cohort of patients diagnosed with autism spectrum disorder (ASD). The study of Sharp et al. (2018) comprised a large genome-wide DNA-methylation meta-analysis on maternal alcohol consumption, based on six general population-based cohorts. This study yielded no significant associations with maternal alcohol consumption. It should be noted that, although maternal alcohol consumption is an essential component for FASD diagnosis, the case-subjects in the study of Sharp et al. where not characterized as FASD patients. None of the loci detected in the study of Lussier et al. were replicated in the study of Sharp et al. while replication analysis on DMPs within this study, based on the report of Lussier et al., indicated a genome-wide significant overlap for nine loci. Our replication attempt, based on the report of Sharp et al., indicated an overlap of six loci. It should be noted that these loci were nominal significant associated in the maternal alcohol consumption meta-analysis and were not replicated in the studies of Lussier et al.. However, one can argue that since these six loci were detected in virtual all our analyses, in other words the whole sample and stratified subsets, their association with maternal alcohol consumption might be true. Since in our studies and in the studies of Lussier et al. and Portales-Casamar et al., hundreds of genome-wide significant loci were associated with FASD, but only a limited number of these loci were replicated between these studies, a systemic DNA-methylation effect in FASD is probably not restricted to specific loci per se. Rather these significant findings appear to represent a mechanistic systemic effect that affects DNA methylation randomly spread over the whole genome, including specific loci as well. The latter hypothesized random effect might be driven by genetic or additional environmental factors since these factors obviously differ strongly between our study and the reported studies on FASD of others. Detecting a robust general DNA-methylation profile that predicts FASD, therefore remains challenging. Nevertheless, the existence of specific FASD biomarkers is strengthened by the report of Breton et al. (2017) in which it was argued that for many early development exposures, even the low effect DNA methylation aberrations are likely to be biologically important because of their persistence over time and across populations [Citation40]. The origin of the detection of these small effect sizes was, however, only marginally discussed by Breton et al. For example, a dilution effect due to the analysis of a heterogeneous cell population and/or a large heterogeneity in and between studies might contribute to the detection of small effect DNA methylation aberrations, both of which issues have to be challenged in future surveys.
In genome-wide DNA-methylation approaches, DMR analysis potentially favors the statistical power [Citation41]. Here, we reported on hundreds of DMRs involving the whole sample and the three subphenotypes: growth, facial and CNS of FASD. Enrichment of hypermethylated DMRs annotated to promoter regions, and hypomethylated DMRS annotated to first exon regions was, as expected, similar as observed in the DMP analyses (Supplementary File 2). Genome-wide significant DMRs (family-wise error rate <0.05) were detected in the growth and the CNS samples for the MIR886 gene in the discovery cohort. MIR886 is an imprinted gene that plays an important role in the regulation of cell growth and has been associated with several types of cancer [Citation42]. In the replication cohort we detected two genome-wide significantly associated DMRs, one annotated to the GSTT1 gene and the other one annotated to the GSTTP1 gene in the CNS sample of the replication cohort. Further evaluation of the involved probes of both these DMRs showed no indication of possible crosshybridization events. The GSTT1 gene encodes for glutathione S-transferase theta 1 and the GSTTP1 gene encodes for glutathione S-transferase theta pseudo gene 1. Both genes were reported to be associated with cancer [Citation43]. Interestingly, genetic variants in the GSTT1 gene were reported as a disease-modulating factor for autism spectrum disorders [Citation44]. Next we studied the cohort-wide overlap of DMRs detected in the discovery and replication cohort even though most DMRs were not marked as genome wide significant. This analysis showed a considerable number of overlapping DMRs per sample group. Eight, 33, 26 and 17 DMRs detected in in the growth, face and CNS sample overlapped in both the discovery cohort and in the replication cohort (Supplementary Table 2). Transcription start sites were clearly over-represented for these DMRs (Supplementary Table 2, tab ‘DMR_Feature_enrichment’). Elucidating the true meaning of the above mentioned DMRs, in relation to their direction of effect, their gene feature annotation and eventually gene expression, needs further research.
FASD potential biomarkers
Next, we aimed to detect potential biomarkers for FASD and for particular FASD subphenotypes, in other words, the 4-digit score extremes on growth delay, impaired facial and CNS development. Note that the ‘potential’ reflects the fact that further studies are essential toward the claim of biomarker. Our workflow to detect FASD potential biomarkers (FPBs) is illustrated in Supplementary Figures 6 & 9, where we studied exact overlapping regions of DMRs between the discovery and replication cohort. In short, general FPBs were defined by exact overlapping DMR regions that were present in every FASD outcome. In this context, we detected three general FASD hypermethylated regions annotated to GLI2, TNFRSF19 and the DTNA genes (). Hierarchical clustering of the β-values of the probes of these three loci suggested a distinctive methylation pattern between FASD cases and controls (Supplementary File 1 & Supplementary Figure 10). Assessing the scientific literature and gene ontology databases on these genes TNFRSF19, GLI2 and DTNA, one could only speculate about the plausibility of their involvement in FASD pathogenic pathways (e.g., neuron fate commitment and development, cell differentiation within the spinal cord, chondrocyte function, cell morphogenesis, hormone secretion, embryonic, epithelial tube formation, hypopituitarism and holopronsencephaly) [Citation45–54]. Despite all these previously reported data, our genome-wide associations, by definition, cannot support causatives roles of associated loci. Altogether, our replicated data suggest that all detected DMRs annotated to the GLI2, TNFRSF19 and DTNA genes can potentially serve as general FPB. Further studies have to be performed in order to investigate the exact power with regard to specificity and sensitivity of the three markers combined using an independent and blind study of healthy controls as well as additional FASD and other syndrome cases. In addition to our own replication studies using an independent cohort of FASD cases and controls, we also searched for reports of others on FASD that matched our study design and methods. Portales-Casamar et al. and Lussier et al. both reported on a genome-wide survey of FASD and controls. Both the ethnic admixture and origin of DNA (buccal epithelial cells) in these cohorts differed from our approach. Despite these differences, we replicated the DMRs annotated to the gene body of the NECAB3, reported by Portales-Casamar et al. (Supplementary Table 2). It is worth noting that the majority of the samples in both these studies were identical. In addition, it should be noted that neither the study of Portales-Casamar et al. nor the study of Lussier et al. reported on any specific subphenotype of FASD. These differences in design may have contributed to the limited number of DMPs or DMRs that we were able to replicate. In both our and the study of Portales-Casamar et al., the DMR annotated to the NECAB3 gene showed robust hypomethylation in FASD patients compared with controls, covering four 450K probes (). Interestingly, this gene is involved in neurological processes since it encodes a protein that interacts with the amino-terminal domain of the neuron-specific X11-like protein (X11L) and abolishes the suppression of β-amyloid production by X11L. It is well known that an excess of β-amyloid plays a crucial role in the development of Alzheimer’s disease. Whether similar processes are also involved in FASD remains unclear, but it is interesting to note that there is a vast body of evidence pointing to diminished learning and specific memory inhibitions in children with FASD, as well as in animal experiments. Other studies have reported on differentially expression of NECAB3 in mice, in specific and nonoverlapping areas of the hippocampus. This brain area involved in short-term memory processing. The role of NECAB3 in relation to diverse neurological impairments is thus confirmed by several reports which makes this gene a plausible mechanistic FASD candidate and a feasible potential biomarker, in particular in relation to CNS developmental impairments.
One of the objectives in this study was to investigate the presence of (potential) FASD subphenotypic biomarkers, in other words markers specifically associated with the FASD 4-digit code subgroups for facial, growth and CNS involvement. The decrease of phenotypic heterogeneity in these analyses favored statistical power, but on the other hand, these analyses obviously lost also statistical power due to the fact of a smaller sample size compared with the whole group (). The results of our FASD subgroup biomarkers analyses are represented in and are inconclusive. Hierarchical clustering analysis in this context yielded no further indication for a clear differentially DNA-methylation pattern between FASD phenotypic subsets (data not shown). The overlap of extreme subphenotypic scores between FASD patients probably affected the potential of detecting such a clear differential DNA-methylation pattern but played a less disturbing role in association analyses. This is a first attempt to discover FASD subphenotype specific DMRs by means of association. True separation of these phenotypes, based on DNA-methylation profiles, will need follow-up studies.
Conclusion
In this study, we found differentially methylated positions and regions spread over the entire genome in children with FASD. While some of these aberrant methylated loci were shown to be unspecific across FASD individuals, our study does suggests the presence of a substantial number of specific affected loci and regions to be associated with FASD. Moreover, these latter DNA methylation aberrations were enriched in regions often annotated to transcription start sites and gene bodies, generally known to be involved in regulation of gene expression. Here we showed robust, albeit not genome-wide significant, association of DMRs annotated to the GLI2, TNFRSF19, DTNA and NECAB3 genes for FASD in general. Moreover, we found suggestive evidence for specific DMRs associated with FASD subphenotypes, in other words impaired growth, facial and CNS development. Our results need to be studied further before they can enter a molecular application approach in diagnosis of FASD in clinical practice.
Future perspective
Although we and others have successfully associated a substantial number of differentially methylated loci with FASD, none of these loci can reliably be applied in diagnostic or prognostic clinical practice. Further research should focus on combining the currently performed FASD genome-wide DNA-methylation association studies. Machine learning methodology, as previously reported by Lussier et al. (2018), is in this context a promising and powerful method to extract multiple FASD classifiers. Such a method would especially be powerful when a consensus about harmonization of the FASD phenotype and subphenotypic features is achieved, as well as an in-depth characterization of the controls. On the other hand, FASD research should further focus on human in vitro modeling of FASD, including timing of alcohol exposure and specific cell types, as was shown by Cartwright et al. (1995). In relation to the latter, it is likely that alcohol exposure is especially interfering in early development at certain stages and cell types, for example at early neural crest differentiation and or proliferation. Human immortalized pluripotent stems cell approaches could be followed, capable to target and challenge a substantial number of distinct cells at different early development stages. Single-cell based detection methods would herein definitely improve the understanding of molecular mechanism underlying FASD. The latter approach is likely to yield a more appropriate target tissue or cells and candidate loci of which all reduce heterogeneity and thus favor the detection of specific markers that can enter a clinical diagnostic and prognostic application.
We assessed a well-characterized discovery and replication sample of fetal alcohol spectrum disorder (FASD) patients and controls for genome-wide DNA-methylation profiling, covering in total 46 FASD patients and 96 nonalcohol exposed controls.
Using a state of the art clinical diagnostics methodology, in other words the 4-digit scoring of Astley et al. 2013, enabled us to stratify our FASD cohorts, resulting in reduction of phenotypic heterogeneity favoring the detection of potential FASD diagnostic and prognostic markers.
We detected global DNA-methylation differences between patients and controls, trending toward enrichment of hypermethylation in FASD, which reflects the complex character of FASD.
Hundreds of genome-wide differentially methylated positions were detected between FASD patients and controls, of which in total 11 loci were internally replicated and nine and six loci were replicated according previous reports of Lussier et al. and Sharp et al. respectively.
Dozens of differentially methylated regions were detected between FASD patients and controls of which four regions (GLI2, TNFRSF19, DTNA and NECAB3) were consistently associated with FASD.
Analyses that were based on stratification according FASD subphenotypic features enabled us to detect a large number of differentially methylated regions of which 17, 14 and seven regions were uniquely associated with FASD growth, facial and CNS extreme features respectively.
Our genome-wide DNA-methylation association study of of FASD and its subphenotypic features indicates the abundant presence of differentially methylated loci.
Our genome-wide survey of DNA-methylation in FASD suggests the presence of potential diagnostic and prognostic biomarkers, but these findings need further studies before any application in clinical practice.
Author contributions
JM Cobben, R Smigiel, K Pesz, P Henneman and MMAM Mannens conceived and designed the study. JM Cobben, R Smigiel, K Pesz, J Niklinski and MA Chomczyk recruited, diagnosed and selected the participants of the study. P Henneman, IM Krzyzewska, A Venema, AN Muland and AV Postma designed the statistical models and the computational framework and performed the statistical analyses. IM Krzyzewska, A Venema, AN Muland and A Polstra carried out wet lab experiments. P Henneman, JM Cobben, IM Krzyzewska and MMAM Mannens drafted the manuscript. All authors reviewed the results and contributed to the final manuscript.
Ethical consent disclosure
For the discovery cohort informed written consent was obtained from all patients/caretakers. The study was approved by the medical Ethical Committees of the Wroclaw University Hospital, and the Medical University of Bialystok. For participants of the replication cohort, informed written consent was obtained from all patients/caretakers and the study was approved by the medical Ethical Committee of the Academic Medical Center, Amsterdam, The Netherlands.
Availability of data
Unprocessed genome-wide DNA-methylation profiles and meta data are freely available NCBI GeneExpression Omnibus (GEO, https://www.ncbi.nlm.nih.gov/geo). GEO accession ID discovery cohort: GSE112987, GEO accession ID replication cohort: GSE113012.
Supplemental Information 1
Download MS Word (2.3 MB)Acknowledgments
The cooperation of all the parents/care takers of the FASD children included in this study is greatly acknowledged, as is the unselfish and brave cooperation of the children in the healthy control group. Second, we want to thank the ‘Childhood Adversity and Epigenetics’ (CHANGE) Consortium for their advisory role in this study
Supplementary data
To view the supplementary data that accompany this paper please visit the journal website at: www.tandfonline.com/doi/full/10.2217/epi-2018-0221
Financial & competing interests disclosure
This research was supported by a grant of the Augeo Foundation, Driebergen-Rijsenburg, The Netherlands, a foundation dedicated to the prevention of adverse childhood experiences. The authors have no other relevant affiliations or financialinvolvement with any organization or entity with a financial interest in or financial conflict with the subject matter or materials discussed in the manuscript apart from those disclosed.
No writing assistance was utilized in the production of this manuscript.
Additional information
Funding
References
- Popova S , LangeS , ProbstC , GmelG , RehmJ . Estimation of national, regional, and global prevalence of alcohol use during pregnancy and fetal alcohol syndrome: a systematic review and meta-analysis . Lancet. Glob. Health5 ( 3 ), e290 – e299 ( 2017 ).
- May PA , BaeteA , RussoJet al. Prevalence and characteristics of fetal alcohol spectrum disorders . Pediatrics134 ( 5 ), 855 – 866 ( 2014 ).
- May PA , ChambersCD , KalbergWOet al. Prevalence of fetal alcohol spectrum disorders in 4 US communities . JAMA319 ( 5 ), 474 – 482 ( 2018 ).
- Lange S , RehmJ , PopovaS . Implications of higher than expected prevalence of fetal alcohol spectrum disorders . JAMA319 ( 5 ), 448 – 449 ( 2018 ).
- Coles CD , GaileyAR , MulleJG , KableJA , LynchME , JonesKL . A comparison among 5 methods for the clinical diagnosis of fetal alcohol spectrum disorders . Alcohol Clin. Exp. Res.40 ( 5 ), 1000 – 1009 ( 2016 ).
- Astley SJ . Validation of the fetal alcohol spectrum disorder (FASD) 4-digit diagnostic code . J. Popul. Ther. Clin. Pharmacol.20 ( 3 ), e416 – e467 ( 2013 ).
- Hoyme HE , MayPA , KalbergWOet al. A practical clinical approach to diagnosis of fetal alcohol spectrum disorders: clarification of the 1996 institute of medicine criteria . Pediatrics115 ( 1 ), 39 – 47 ( 2005 ).
- Hoyme HE , KalbergWO , ElliottAJet al. Updated clinical guidelines for diagnosing fetal alcohol spectrum disorders . Pediatrics138 ( 2 ), pii: e20154256 ( 2016 ).
- Chasnoff IJ , WellsAM , KingL . Misdiagnosis and missed diagnoses in foster and adopted children with prenatal alcohol exposure . Pediatrics135 ( 2 ), 264 – 270 ( 2015 ).
- Caprara DL , NashK , GreenbaumR , RovetJ , KorenG . Novel approaches to the diagnosis of fetal alcohol spectrum disorder . Neurosci. Biobehav. Rev.31 ( 2 ), 254 – 260 ( 2007 ).
- Eberhart JK , ParnellSE . The genetics of fetal alcohol spectrum disorders . Alcohol Clin. Exp. Res.40 ( 6 ), 1154 – 1165 ( 2016 ).
- Julian CG . Epigenomics and human adaptation to high altitude . J. Appl. Physiol. (1985) 123 ( 5 ), 1362 – 1370 ( 2017 ).
- Liu L , LiY , TollefsbolTO . Gene–environment interactions and epigenetic basis of human diseases . Curr. Issues Mol. Biol.10 ( 1–2 ), 25 – 36 ( 2008 ).
- Waterland RA , TravisanoM , TahilianiKG , RachedMT , MirzaS . Methyl donor supplementation prevents transgenerational amplification of obesity . Int. J. Obes. (Lond.)32 ( 9 ), 1373 – 1379 ( 2008 ).
- Nemoda Z , SzyfM . Epigenetic alterations and prenatal maternal depression . Birth Defects Res.109 ( 12 ), 888 – 897 ( 2017 ).
- Joubert BR , FelixJF , YousefiPet al. DNA methylation in newborns and maternal smoking in pregnancy: genome-wide consortium meta-analysis . Am. J. Hum. Genet.98 ( 4 ), 680 – 696 ( 2016 ).
- Tobi EW , GoemanJJ , MonajemiRet al. DNA methylation signatures link prenatal famine exposure to growth and metabolism . Nat. Commun.5 , 5592 ( 2014 ).
- Liu Y , BalaramanY , WangG , NephewKP , ZhouFC . Alcohol exposure alters DNA methylation profiles in mouse embryos at early neurulation . Epigenetics4 ( 7 ), 500 – 511 ( 2009 ).
- Laufer BI , DiehlEJ , SinghSM . Neurodevelopmental epigenetic etiologies: insights from studies on mouse models of fetal alcohol spectrum disorders . Epigenomics5 ( 5 ), 465 – 468 ( 2013 ).
- Laufer BI , ManthaK , KleiberML , DiehlEJ , AddisonSM , SinghSM . Long-lasting alterations to DNA methylation and ncRNAs could underlie the effects of fetal alcohol exposure in mice . Dis. Model Mech.6 ( 4 ), 977 – 992 ( 2013 ).
- Laufer BI , KapalangaJ , CastellaniCA , DiehlEJ , YanL , SinghSM . Associative DNA methylation changes in children with prenatal alcohol exposure . Epigenomics7 ( 8 ), 1259 – 1274 ( 2015 ).
- Manolio TA , CollinsFS , CoxNJet al. Finding the missing heritability of complex diseases . Nature461 ( 7265 ), 747 – 753 ( 2009 ).
- Dirks RA , StunnenbergHG , MarksH . Genome-wide epigenomic profiling for biomarker discovery . Clin. Epigenetics8 , 122 ( 2016 ).
- Abdelmalik N , Van HaelstM , ManciniGet al. Diagnostic outcomes of 27 children referred by pediatricians to a genetics clinic in The Netherlands with suspicion of fetal alcohol spectrum disorders . Am. J. Med. Genet. A.161A ( 2 ), 254 – 260 ( 2013 ).
- Touleimat N , TostJ . Complete pipeline for Infinium((R)) Human Methylation 450K BeadChip data processing using subset quantile normalization for accurate DNA methylation estimation . Epigenomics4 ( 3 ), 325 – 341 ( 2012 ).
- Chen YA , LemireM , ChoufaniSet al. Discovery of cross-reactive probes and polymorphic CpGs in the Illumina Infinium HumanMethylation450 microarray . Epigenetics8 ( 2 ), 203 – 209 ( 2013 ).
- Houseman EA , AccomandoWP , KoestlerDCet al. DNA methylation arrays as surrogate measures of cell mixture distribution . BMC Bioinformatics13 , 86 ( 2012 ).
- Mistry M , GillisJ , PavlidisP . Genome-wide expression profiling of schizophrenia using a large combined cohort . Mol. Psychiatry18 ( 2 ), 215 – 225 ( 2013 ).
- Aryee MJ , JaffeAE , Corrada-BravoHet al. Minfi: a flexible and comprehensive Bioconductor package for the analysis of Infinium DNA methylation microarrays . Bioinformatics30 ( 10 ), 1363 – 1369 ( 2014 ).
- Tsai PC , BellJT . Power and sample size estimation for epigenome-wide association scans to detect differential DNA methylation . Int. J. Epidemiol.44 ( 4 ), 1429 – 1441 ( 2015 ).
- Lin X , BartonS , HolbrookJD . How to make DNA methylome wide association studies more powerful . Epigenomics8 ( 8 ), 1117 – 1129 ( 2016 ).
- Gauthier TW . Prenatal alcohol exposure and the developing immune system . Alcohol Res.37 ( 2 ), 279 – 285 ( 2015 ).
- Lussier AA , BodnarTS , MingayMet al. Prenatal alcohol exposure: profiling developmental DNA methylation patterns in central and peripheral tissues . Front. Genet.9 , 610 ( 2018 ).
- Bacalini MG , GentiliniD , BoattiniAet al. Identification of a DNA methylation signature in blood cells from persons with down syndrome . Aging (Albany NY)7 ( 2 ), 82 – 96 ( 2015 ).
- Starnawska A , HansenCS , SparsoTet al. Differential DNA methylation at birth associated with mental disorder in individuals with 22q11.2 deletion syndrome . Transl. Psychiatry7 ( 8 ), e1221 ( 2017 ).
- Whittaker S . Global patterns of methylation in sezary syndrome provide insight into the role of epigenetics in cutaneous T-Cell lymphoma . J. Invest. Dermatol.136 ( 9 ), 1753 – 1754 ( 2016 ).
- Portales-Casamar E , LussierAA , JonesMJet al. DNA methylation signature of human fetal alcohol spectrum disorder . Epigenetics Chromatin9 , 25 ( 2016 ).
- Lussier AA , MorinAM , MacisaacJLet al. DNA methylation as a predictor of fetal alcohol spectrum disorder . Clin. Epigenetics10 , 5 ( 2018 ).
- Sharp GC , ArathimosR , ReeseSEet al. Maternal alcohol consumption and offspring DNA methylation: findings from six general population-based birth cohorts . Epigenomics10 ( 1 ), 27 – 42 ( 2018 ).
- Breton CV , MarsitCJ , FaustmanEet al. Small-magnitude effect sizes in epigenetic end points are important in children’s environmental health studies: The Children’s Environmental Health and Disease Prevention Research Center’s Epigenetics Working Group . Environ. Health Perspect.125 ( 4 ), 511 – 526 ( 2017 ).
- Michels KB , BinderAM , DedeurwaerderSet al. Recommendations for the design and analysis of epigenome-wide association studies . Nat. Methods10 ( 10 ), 949 – 955 ( 2013 ).
- Lee K , KunkeawN , JeonSHet al. Precursor miR-886, a novel noncoding RNA repressed in cancer, associates with PKR and modulates its activity . RNA17 ( 6 ), 1076 – 1089 ( 2011 ).
- Minina VI , SobolevaOA , GlushkovANet al. Polymorphisms of GSTM1, GSTT1, GSTP1 genes and chromosomal aberrations in lung cancer patients . J. Cancer Res. Clin. Oncol.143 ( 11 ), 2235 – 2243 ( 2017 ).
- Rahbar MH , Samms-VaughanM , MaJet al. Interaction between GSTT1 and GSTP1 allele variants as a risk modulating-factor for autism spectrum disorders . Res. Autism Spectr. Disord.12 , 1 – 9 ( 2015 ).
- Fish EW , MurdaughLB , SulikKK , WilliamsKP , ParnellSE . Genetic vulnerabilities to prenatal alcohol exposure: limb defects in Sonic Hedgehog and GLI2 heterozygous mice . Birth Defects Res.109 ( 11 ), 860 – 865 ( 2017 ).
- Flemming GM , KlammtJ , AmblerGet al. Functional characterization of a heterozygous GLI2 missense mutation in patients with multiple pituitary hormone deficiency . J. Clin. Endocrinol. Metab.98 ( 3 ), E567 – E575 ( 2013 ).
- Cartwright MM , SmithSM . Stage-dependent effects of ethanol on cranial neural crest cell development: partial basis for the phenotypic variations observed in fetal alcohol syndrome . Alcohol Clin. Exp. Res.19 ( 6 ), 1454 – 1462 ( 1995 ).
- Cartwright MM , SmithSM . Increased cell death and reduced neural crest cell numbers in ethanol-exposed embryos: partial basis for the fetal alcohol syndrome phenotype . Alcohol Clin. Exp. Res.19 ( 2 ), 378 – 386 ( 1995 ).
- Tolosa EJ , Fernandez-ZapicoME , BattiatoNL , RovasioRA . Sonic Hedgehog is a chemotactic neural crest cell guide that is perturbed by ethanol exposure . Eur. J. Cell Biol.95 ( 3–5 ), 136 – 152 ( 2016 ).
- Pispa J , PummilaM , BarkerPA , ThesleffI , MikkolaML . Edar and Troy signalling pathways act redundantly to regulate initiation of hair follicle development . Hum. Mol. Genet.17 ( 21 ), 3380 – 3391 ( 2008 ).
- Hisaoka T , MorikawaY , KomoriT , SugiyamaT , KitamuraT , SenbaE . Characterization of TROY-expressing cells in the developing and postnatal CNS: the possible role in neuronal and glial cell development . Eur. J. Neurosci.23 ( 12 ), 3149 – 3160 ( 2006 ).
- Zlotina A , NikulinaT , YanyNet al. Ring chromosome 18 in combination with 18q12.1 (DTNA) interstitial microdeletion in a patient with multiple congenital defects . Mol. Cytogenet.9 , 18 ( 2016 ).
- Finsterer J . Cardiogenetics, neurogenetics, and pathogenetics of left ventricular hypertrabeculation/noncompaction . Pediatr. Cardiol.30 ( 5 ), 659 – 681 ( 2009 ).
- Moric-Janiszewska E , Markiewicz-LoskotG . Genetic heterogeneity of left-ventricular noncompaction cardiomyopathy . Clin. Cardiol.31 ( 5 ), 201 – 204 ( 2008 ).