
 ?Mathematical formulae have been encoded as MathML and are displayed in this HTML version using MathJax in order to improve their display. Uncheck the box to turn MathJax off. This feature requires Javascript. Click on a formula to zoom.
Abstract
Aim: UVA radiation drives skin photoaging in the dermis, plausibly via persistent changes to DNA methylation in dermal fibroblasts. Methods: Genome-wide DNA methylation changes after five repeated daily UVA doses were determined at 48 h (transitionary) and 1 week (recovery) post final irradiation. Results: Differential methylation was found at the transitionary time point in active chromatin states near genes that are highly expressed in fibroblasts and are involved in cellular defensive mechanisms; the majority of these methylation differences were restored to control levels after 7 day recovery. At the recovery time point, new differential methylation occurred at repressed regions near developmental genes, normally weakly expressed in fibroblasts. Conclusion: UVA irradiation induces transitionary and recovery-associated DNA methylation responses in fibroblasts with contrasting functional characteristics.
Chronic exposure of skin to ultraviolet (UV) radiation leads to skin aging and an increased risk of skin cancer [Citation1,Citation2]. The amount of photo damage that occurs in the skin is related to the total exposure of the epidermis and dermis to both UVB (wavelength 280–315 nm) and UVA (315–400 nm), and the degree of attenuation by melanin [Citation3,Citation4]. While UVB is generally associated with greater DNA damage, UVA is more strongly associated with oxidative damage [Citation5]. However, DNA damage from UVA is still considerable [Citation6], suggesting both DNA and oxidative damage play an important role in UVA-induced photoaging [Citation7]. Dermal fibroblasts are primarily exposed to UVA which penetrates the skin more deeply due to its longer wave length (although those in the upper papillary dermis can be exposed to longer-wave UVB, e.g., 300 nm) [Citation8,Citation9]. The accumulated exposure of fibroblasts to UVA leads to detrimental effects, with most studies focusing on how UVA upregulates collagenases (e.g., [Citation10]) and causes cellular damage in fibroblast in vitro [Citation11,Citation12]. However, how repeat doses of UVA cause permanent changes to fibroblasts and their cellular functions, remains relatively unknown.
Methylation of DNA is a key component of the epigenome through which cells regulate gene expression and, consequently, the function of cellular pathways. With aging, there are consistent and persistent changes to DNA methylation levels in skin marking changes in epigenomic regulation [Citation13]. There is a tendency for hypomethylation with photoaging and hypermethylation for intrinsic aging (i.e., aging occurring in sun protected body sites) [Citation14,Citation15]. Such DNA methylation changes are thought to be relatively stable, facilitating their use in the construction of aging clocks for tissues, including for skin [Citation16]. However, temporal dynamics of changes to DNA methylation with repeated acute aging insults is unclear, and remains a key part of understanding how methylation changes become persistent and influence or reflect gene expression regulation.
Here, we studied the effects of repeat UVA exposure on methylation levels in fibroblasts in vitro, including a transitionary time point 48 h after the last exposure as well as a recovery time point 5 days later. From the initiation of the experiment to the transitionary time point, we maintained fibroblasts in a cell growth quiescent state using low serum concentrations to ensure UVA treatment differences with controls were not due to UVA exposure arresting cell growth. For the recovery phase, we moved the cells into higher serum which promoted cell growth to observe whether the methylation changes were persistent even across cell replication.
Materials & methods
Study population
Primary human dermal fibroblasts were obtained from skin biopsies from eight female donors from European descent. Four donors were participants of the Leiden 85+ study (age of 89.95 ± 0.17 years) and four were participants of the control group of this cohort (age 22.62 ± 1.93 years; including two separately cultured fibroblast samples from a single young donor) [Citation17]. Skin biopsies were taken as previously described [Citation17]. Briefly, 3 mm full thickness punch biopsies were taken from the sun-unexposed medial site of the mid-upper arm. Fibroblasts were outgrown as described to passage 11 at which cells were frozen in liquid nitrogen. Passage 11 cells were later expanded to passage 13 to yield a sufficient number of cells. The study was approved by the Medical Ethical Committee of the Leiden University Medical Center and written informed consent was obtained from all donors.
Culture & UV irradiation of fibroblasts
Primary human dermal fibroblasts (passage 13) obtained from skin biopsies were grown in DMEM (DMEM 31966-021; Gibco, ThermoFisher Scientific, MA, USA) supplemented with 100-U/ml Penicillin-Streptomycin (15140-122; Gibco, ThermoFisher Scientific) and 17% fetal calf serum (FCS) (Bodinco, Alkmaar, The Netherlands) at 37°C with 5% CO2 at 100% humidity. For UVA irradiation (315–400 nm) fibroblasts were plated in 10 cm petridishes (664160; Cell-Star Greiner Bio-One, Frickenhausen, Germany) at a density of 14,200 cells per cm2, an approximate confluence of 70%. The UVA irradiation was performed in a cabinet under a bank of six 40 W Cleo performance/R fluorescent tubes (wavelength 310–400 nm; Philips Lighting BV, Eindhoven, The Netherlands) filtered through a 4 mm glass pane to eliminate traces of UVB radiation (wavelength <315 nm). Irradiance was measured with an IL700 A equipped with a UVA sensitive detection head (International Light Inc., MA, USA). During irradiation phenol red free medium (31053-028; Gibco, ThermoFisher Scientific, DMEM) supplemented with 2 mM L-Glutamine (Gibco, ThermoFisher Scientific), 2-mM Sodium Pyruvate (Gibco, ThermoFisher Scientific), 100-U/ml Penicillin-Streptomycin and 1.5% FCS was used to prevent growth or induce quiescence. Cells were irradiated for 5 days and methylation changes were determined 48 h after irradiation (transitionary response), as well as after another 5 day period during which the cells were undergoing cell replication (recovery response) by raising the serum level. Fibroblasts were exposed to 3 (low) or 6 (high) J/cm2 UVA levels per day. A sham treatment was included for each sample which had the same temperature increase for the same time period as the 6 J/cm2 UVA treatment but was not exposed to UVA irradiation (fibroblast flasks were placed within the UV box at the high UVA settings but with a reflective covering). Medium was refreshed directly after each irradiation. 48 hours after the last irradiation cells were harvest for DNA extraction (transitionary response), also, 150,000 fibroblasts of all treatments were reseeded and cultured for a further 5 days in 17% FCS DMEM medium, after which cells were harvested for DNA extraction (recovery response). Cell number was measured at both timepoints (transitionary and recovery) to determine the effect of irradiation on cell number/growth (Supplementary Figure 1).
DNA extraction & Illumina 450 k BeadChip
DNA was isolated from all 96 samples (eight donors, duplicate measurements, three doses [0, 3 and 6 J/cm2], two time points [transitionary, recovery]) using the Qiagen QIAamp DNA mini kit according to the manufacture’s protocol (Qiagen, Hilden, Germany). Between 196 and 600 ng of DNA was used as input for bisulphite conversion, depending on the DNA yield of the cell samples. Bisulphite conversion was performed using the EZ-96 DNA methylation kit (Zymo Research, CA, USA). The bisulphite converted samples were whole-genome amplified, enzymatically fragmented and hybridized to the Illumina Human Methylation 450 k Bead Chip at the Erasmus Medical Center Human Genotyping Facility (HuGe-F) in Rotterdam as described previously [Citation18].
Preprocessing of the Illumina 450 k BeadChip data
Preprocessing of 450 k array data was done according to our DNAmArray workflow available from https://github.com/molepi/DNAmArray. In short, the quality of the generated 450 k array data was assessed using the Bioconductor package MethylAid [Citation19]. The distribution of CpG methylation showed a bimodal pattern as normally observed. Of the samples, 1/96 failed quality control and was excluded from further analysis based on irregular CpG distribution. The female sex of all donors was confirmed by X-chromosomal CpG distribution and getSex function of the minfi Bioconductor package [Citation20]. Genotype SNPs on the array were used to confirm that donor paired samples were from the same individual. Normalization was performed using Functional Normalization as implemented in the minfi package using two principal components. We filtered for a minimum of three beads per probe (bead median is 14 beats per probe on 450-k chip [Citation21]). Also, measurements with a p-value of p > 0.01 or intensity of zero were not incorporated in the analysis. This resulted in 454,543 CpGs for analysis. Graphs were generated using the R-package ggplot2 [Citation22].
Statistical analysis
Prior to analysis, β values obtained with the 450 k methylation array β values were transformed to M-values to reduce heteroscedasticity [Citation23]. The following linear model was applied to identify UVA-induced DNA methylation changes in human fibroblasts in vitro:
Where Ym is the M-value for any particular CpGs, β1 is the fixed effect for treatment (UVA J/cm2) and β2 is the fixed effect for donor. Factor1 and Factor2 are unmeasured confounders detected using the CATE package in order to control for any unknown (technical) variability in the experiment [Citation24]. To address any residual inflation and bias of test statistics, we applied Bayesian control as implemented in BACON [Citation25]. To correct for multiple testing, we adjusted p-values using false discovery rate correction (FDR). The DNA methylation age predictor calibrated for skin and blood was used to predict age of our donors based on DNA methylation patterns [Citation16]. The following linear model was applied to identify a possible effect of UVA irradiation on predicted age:
Where PredictedAge is the predicted age for each sample based on the DNA methylation age predictor calibrated for skin and blood, β1 is the fixed effect for treatment (UVA J/cm2) and β2 is the fixed effect for donor. All analyses were performed with R statistics, version 3.1.0.
Annotation & enrichment test
To determine CpG island (CGI) centric-specific enrichments, CpGs on the 450-k chip were annotated to CGI, CGI shore (Shore, 2-kb up and downstream of CGIs) or non-CGIs (NC) with annotation data as previously described [Citation26]. Chromatin state segmentations of human dermal fibroblasts of the Epigenomics Roadmap (E126) were used to investigate the function of underlying genomic regions [Citation27]. Using these state segmentations, we marked the following chromatin states as active: Active transcription start site (TSS), Flanking Active TSS and Transcr. At gene 5 and 3, strong transcription, weak transcription, genic enhancers, and enhancers. Chromatin states considered repressive were: heterochromatin, bivalent/poised TSS, flanking bivalent TSS/Enh, bivalent enhancer, repressed PolyComb; weakly repressed PolyComb and quiescent/Low.
We mapped differentially methylated CpGs to their nearest gene, either TSS or transcription end site (TES), based on UCSC genes human genome build 19 [Citation28]. Genes were mapped to protein–protein interaction networks, and subnetworks evaluated for enrichment for Gene Ontology Biological Processes using STRING [Citation29].
Results
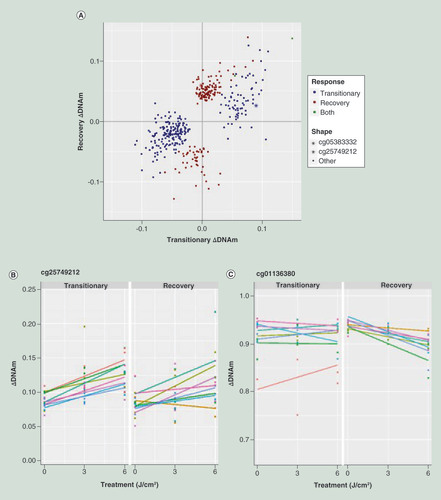
We evaluated the effect of UVA irradiation on DNA methylation at 454,543 CpG sites in primary dermal fibroblasts from eight female donors from European descent. At a transitory time point, in other words 48 h after the last UVA exposure and cultured under conditions promoting a quiescent state, 248 CpGs were found to be significantly differentially methylated (PFDR < 0.05). Approximately two thirds (177) of these CpGs showed a loss of methylation. At the recovery time point, in other words 5 days after the transitionary time point and under culture conditions supporting cell proliferation, 162 CpGs were found differently methylated (PFDR < 0.05). Here, the majority of CpGs showed a gain of methylation (116 CpGs). Only two CpGs were found differently methylated in both responses (cg08995449 and cg11553153), in other words all but two CpGs found to be differentially methylated in the transitionary response showed DNA methylation levels that had reverted back toward nonirradiated levels after the recovery period (). For CpGs identified as differentially methylated at the recovery time point, no early indication of this upcoming change was seen at the transitionary time point.
(A) DNA Methylation effect in both transitionary and recovery response for CpGs differently methylated in the transitionary (blue) and recovery (red) response. Two CpGs are affected in both responses (green). Top CpG for both responses are indicated. (B) Top CpG for transitionary response, colors indicate individual donor. (C) Top CpG for recovery response, colors indicate donor.
UVA: Ultraviolet A.
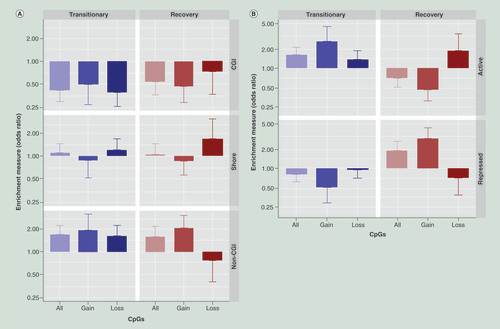
Differentially methylated CpGs were annotated to their genomic regions to reveal possible functional differences in genomic locations of differently methylated CpGs for the two responses (transitionary and recovery). For both responses, differently methylated CpGs were enriched in non-CGI regions and depleted in CGIs (). However, differences between the transitionary and recovery responses were observed when CpGs were annotated to fibroblast chromatin states [Citation27]. For the transitionary response, CpGs in active regions of the genome were predominantly affected, whereas CpGs differently methylated in the recovery response were predominantly present in repressed regions (), particularly for those CpG sites that gained methylation.
(A) Differently methylated CpGS annotated to density centric annotation. (B) Differently methylated CpGs annotated to active and repressive regions.
CGI: CpG island.
Differentially methylated CpGs were mapped to the nearest gene. The two CpGs differentially methylated in both responses cg08995449 and cg11553153, map to PABPC1 and CHRM5, respectively. In a large dermal fibroblast expression study (involving primary fibroblasts from 143 donors, GSE113957 [Citation30]), the expression of genes associated with the transitionary effect of UVA was higher than that of the recovery-associated genes (p < 0.0001, ). This observation was independent of whether all genes were evaluated or whether they were split according to their vicinity to hyper- or hypomethylated CpGs. Underscoring the low expression of recovery-associated genes, many had undetectable expression levels in the fibroblast expression study (61 genes, fragments per kilobase of exon model per million reads mapped <1, out of the 97 genes). The distinct expression patterns match the contrast in enrichment of transitionary CpGs for active chromatin states and recovery CpGs for repressed states.
Expression of genes in primary fibroblasts [Citation30] for nearest genes of CpGs differentially methylated in the transitionary (blue) and recovery (red) response. Genes are separated for nearest genes of CpGs which are hyper- or hypomethylated, all includes all CpGs differentially methylated.
![Figure 3. Expression levels in primary fibroblasts of nearest genes of differentially methylated CpGs. Expression of genes in primary fibroblasts [Citation30] for nearest genes of CpGs differentially methylated in the transitionary (blue) and recovery (red) response. Genes are separated for nearest genes of CpGs which are hyper- or hypomethylated, all includes all CpGs differentially methylated.](/cms/asset/c85cf592-7740-48c2-b0dd-d5af88229c33/iepi_a_12324166_f0003.jpg)
Interaction networks for genes associated with differentially methylated CpGs for transitionary (A) and recovery (B) phase as obtained from the STRING database. Genes associated with CpGs that display a gain in methylation (purple) and genes associated with a loss (green) in methylation. Noncolored gene is associated with multiple CpGs which display both a gain and loss in methylation.
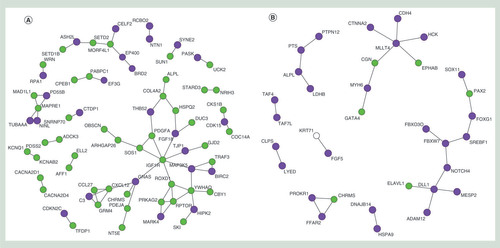
The top ten of the hypo- and hypermethylated CpGs for the transitionary and recovery time point plus their associated genes are displayed in . To gain further insight in potential biological downstream effects, the transitionary and recovery-associated genes were mapped to protein–protein interaction networks. For the transitionary response, multiple smaller networks were observed and one larger gene network that linked to insulin signaling and cellular defensive, which encompassed key aging-associated genes FOXO1, IGF1R and RPTOR (). In the analysis of the recovery gene list, a number of smaller networks were found, including a network comprising the developmental genes PAX2, DLL1 and NOTCH4 ().
Table 1. Characteristics of top ten differently hyper- and hypomethylated CpGs for transitionary and recovery response.
Finally, various DNA methylation-based predictors exists of calendar age and deviations between predicted and actual calendar age are hypothesized to reflect differences in biological age. As we studied skin fibroblasts, we applied the DNA methylation age predictor calibrated for skin and blood [Citation16] to obtain DNA methylation age estimators for fibroblasts of the eight donors for both UVA irradiation levels at the transitionary and recovery time point. We found that the predicted ages were not affected by UVA irradiation (p = 0.33 for the transitionary time point and p = 0.25 for the recovery time point; Supplementary Figure 2). The ‘age predictor’ is based on 391 CpGs. None of these CpGs were individually associated with UVA irradiation at either time point (p < 0.05).
Discussion
We identified DNA methylation changes that associate with a transitionary response of fibroblasts to repeat UVA exposure as well as a recovery response 1 week postirradiation. The transitionary and recovery responses had only two CpGs in common. This observation suggests the occurrence of a short-term effect on methylation dynamics, which does not hold over time or cell division. There were marked differences in the two responses. First, the transitionary response had greater loss of methylation whereas the recovery response showed predominately a gain of methylation. Second, the transitional response occurred mainly in transcriptionally active regions of the genome whereas the recovery response mainly occurred in areas linked to transcriptionally repressed regions, particularly for those sites that gained methylation in the recovery period. Third, the transitionary response occurred in genomic loci near genes that are generally expressed in dermal fibroblasts and involved in cell defense and aging, such as IGF1R, FOXO1 and RPTOR. In contrast, the recovery response occurred near genes that commonly are not or weakly expressed in fibroblasts and are involved in development, such as PAX2, FOXG1, DELTA1 and NOTCH4. In addition, using a DNA methylation-based predictor of calendar age calibrated for skin, we observed that UVA irradiation did not induce changes in predicted age suggesting that the clock does not capture UVA-induced aging in fibroblasts.
It has been shown that there is a loss of methylation in skin that associates with photoaging [Citation14] which is particularly evident in the epidermis [Citation15]. Here, we found a hypermethylation tendency for methylation changes that persisted in fibroblasts 1 week after repeat UVA radiation. This is in-keeping with persistent aging methylation changes in other tissues, where hypermethylation is the more common change with age [Citation31]. Our data supports the notion that the loss of methylation seen with photoaging is more specific to the epidermis. A previous study on the effect of in vivo sun exposure on methylation reported hypomethylated regions in the epidermis but not in the dermis [Citation15]. As the dermis is a particularly heterogenous tissue, our observed in vitro effect on fibroblasts might not be detected when all cell-types of the dermis are studied. Further confirmation that the recovery methylation site changes reported here are relevant to fibroblast aging in vivo is required. For this, and due to recent advancements in single cell methylation profiling, an in vivo methylation study of fibroblasts from skin samples is recommended.
The transitionary sites were located in regions of the genome linked to actively transcribed loci, indicating that the transitionary response of the fibroblasts to UVA exposure is altering the expression of genes required for normal fibroblast function. In particular, a number of genes were affected that have been linked to aging and cellular defensive mechanisms. IGF1R and RPTOR (part of the mTOR protein complex) have been linked to human longevity and cellular damage [Citation32,Citation33] and FOXO1 is associated with collagen production and would heal in skin [Citation34]. It is tempting to speculate that the changes in DNA methylation in these genes is a response to limit the damage from UVA. However, whether the activities of these genes are activated or repressed by UVA is unclear making it difficult to confirm the directionality of effect. In addition, methylation changes may be associated with mRNA changes in trans rather than in cis [Citation35]. Hence, it is important to determine if the expression of the neighboring genes to the transitionary methylation sites are altered and, if so, if this provides protection or makes the cells more susceptible to further damage from subsequent UVA exposure.
The largest protein–protein interaction network among the recovery-associated genes included PAX2, FOXG1, DELTA1 and NOTCH4, all of which are not normally expressed in dermal fibroblasts. These genes are also linked to development and it is known that age-related DNA methylation changes accumulate near developmental genes [Citation35]. However, it remains unclear what role these genes would have in normal dermal fibroblast function. Indeed, the recovery methylation changes occurred in normally repressed regions. In keeping with this, the mainly hypermethylation of these sites could indicate that transcriptional repressors are no longer binding to these sites making them available for DNA methyltransferase [Citation18]. Further confirmation that the genes at these loci are being activated through repeat UVA exposure and what transcription factors might be binding to these sites is now required.
Weaknesses to this study include the lack of mRNA data to relate to the methylation changes, the lack of a replication experiment and, although we tried to control for cell growth differences between treatment and control, we cannot rule out cell cycle effects on our results. The strengths to this study are the use of primary cells, the inclusion of two time points, an appropriate sham treatment to control for temperature effects of the cells being within the UV exposure box, and the use of in vivo relevant UVA doses – fibroblasts were exposed for 1 h giving 3 or 6 J/cm2 UVA, and skiers on average get 2 J/cm2 UVA per hour during the day with some getting two-three times more [Citation36], although the epidermis likely acts as a filter to UVA penetration in vivo.
Conclusion
Overall, we identified methylation changes that associate with two different types of responses in fibroblasts to repeat UVA exposure: a transitionary response linked to genes that are associated with aging and cellular defense, and a recovery methylation response 1 week later near normally repressed developmental genes.
Future perspective
The recovery in vitro results reflect in vivo skin studies demonstrating a loss-of-methylation in quiescent gene loci with age. Future studies investigating dermal in vivo methylation changes could identify similar findings to our recovery genes and, as a result, confirm that UVA radiation exposure to dermal fibroblasts in vitro can be used as a model of human in vivo UVA aging. In addition, identification of the transcription factors driving methylation changes at these specific loci in both the transitionary and recovery time point will offer a way to study epigenetic responses to cellular damage, as well as the longer-term changes that likely affect cellular function and aging within tissues.
UVA radiation drives skin aging plausibly via persistent changes to DNA methylation in dermal fibroblasts.
Primary human dermal fibroblasts were irradiated with UVA in vitro using in vivo relevant UVA doses of five repeated daily doses of 3 or 6 J/cm2.
Genome-wide DNA methylation at 454,543 CpG sites was measured using the Illumina 450 k array at a transitionary time point (48 h after the last irradiation) and at a recovery time point (1 week after the last irradiation).
UVA irradiation induced distinct transitionary and recovery DNA methylation signatures.
Transitionary changes in DNA methylation preferentially occurred in genomic regions characterized by active chromatin and near genes expressed in fibroblasts.
Changes in DNA methylation at the recovery time point accumulated in repressed genomic regions near genes that were generally not or lowly expressed in fibroblasts.
The nearest genes of transitionary DNA methylation changes were linked to insulin signaling and cellular defensive mechanisms.
The nearest genes of recovery DNA methylation changes were linked to developmental pathways.
Acknowledgments
We thank D Cats from the LUMC department of Biomedical Data Sciences for uploading the data to EGA.
Ethical conduct of research
The authors state that they have obtained appropriate institutional review board approval or have followed the principles outlined in the Declaration of Helsinki for all human or animal experimental investigations. In addition, for investigations involving human subjects, informed consent has been obtained from the participants involved.
Data accessibility
Illumina 450 k array data have been deposited at the European Genome-phenome Archive (EGA), which is hosted by the EBI and the CRG, under accession number EGAS00001004054.
Supplemental Figure 1
Download JPEG Image (17.5 KB)
Supplemental Figure 2
Download JPEG Image (28.7 KB)
Supplementary data
To view the supplementary data that accompany this paper please visit the journal website at: www.tandfonline.com/doi/suppl/10.2217/epi-2019-0251
Financial & competing interests disclosure
This research was in part funded by the Netherlands Genomics Initiative (NCHA #05040202, #050-060-810), the Innovation Oriented Research Program on Genomics (SenterNovem; #IGE01014, #IGE5007) and Unilever. Although no products were tested, this manuscript could promote the sales of anti-aging products and services leading to financial gain for Unilever. The authors have no other relevant affiliations or financial involvement with any organization or entity with a financial interest in or financial conflict with the subject matter or materials discussed in the manuscript apart from those disclosed.
No writing assistance was utilized in the production of this manuscript.
Additional information
Funding
References
- Singer RS , HamiltonTA , VoorheesJJ , GriffithsCE. Association of asymmetrical facial photodamage with automobile driving. Arch. Dermatol.130(1), 121–123 (1994).
- Goukassian DA , GilchrestBA. The interdependence of skin aging, skin cancer, and DNA repair capacity: a novel perspective with therapeutic implications. Rejuvenation Res7(3), 175–185 (2004).
- Rijken F , BruijnzeelPL , Van WeeldenH , KiekensRC. Responses of black and white skin to solar-simulating radiation: differences in DNA photodamage, infiltrating neutrophils, proteolytic enzymes induced, keratinocyte activation, and IL-10 expression. J. Invest. Dermatol.122(6), 1448–1455 (2004).
- Slominski AT , ZmijewskiMA , PlonkaPM , SzaflarskiJP , PausR. How UV light touches the brain and endocrine system through skin, and why. Endocrinology159(5), 1992–2007 (2018).
- Svobodova AR , GalandakovaA , SianskaJet al. DNA damage after acute exposure of mice skin to physiological doses of UVB and UVA light. Arch. Dermatol. Res.304(5), 407–412 (2012).
- Courdavault S , BaudouinC , CharveronM , FavierA , CadetJ , DoukiT. Larger yield of cyclobutane dimers than 8-oxo-7,8-dihydroguanine in the DNA of UVA-irradiated human skin cells. Mutat. Res.556(1–2), 135–142 (2004).
- Cadet J , MouretS , RavanatJL , DoukiT. Photoinduced damage to cellular DNA: direct and photosensitized reactions. Photochem. Photobiol.88(5), 1048–1065 (2012).
- Chadwick CA , PottenCS , NikaidoO , MatsunagaT , ProbyC , YoungAR. The detection of cyclobutane thymine dimers, (6–4) photolesions and the Dewar photoisomers in sections of UV-irradiated human skin using specific antibodies, and the demonstration of depth penetration effects. J. Photochem. Photobiol. B.28(2), 163–170 (1995).
- Tewari A , SarkanyRP , YoungAR. UVA1 induces cyclobutane pyrimidine dimers but not 6–4 photoproducts in human skin in vivo. J. Invest. Dermatol.132(2), 394–400 (2012).
- Herrmann G , WlaschekM , LangeTS , PrenzelK , GoerzG , Scharffetter-KochanekK. UVA irradiation stimulates the synthesis of various matrix-metalloproteinases (MMPs) in cultured human fibroblasts. Exp. Dermatol.2(2), 92–97 (1993).
- Bredberg A . DNA damage in human skin fibroblasts exposed to UVA light used in clinical PUVA treatment. J. Invest. Dermatol.76(6), 449–451 (1981).
- Polte T , TyrrellRM. Involvement of lipid peroxidation and organic peroxides in UVA-induced matrix metalloproteinase-1 expression. Free Radic. Biol. Med.36(12), 1566–1574 (2004).
- Bormann F , Rodriguez-ParedesM , HagemannSet al. Reduced DNA methylation patterning and transcriptional connectivity define human skin aging. Aging Cell15(3), 563–571 (2016).
- Gronniger E , WeberB , HeilOet al. Aging and chronic sun exposure cause distinct epigenetic changes in human skin. PLoS Genet.6(5), e1000971 (2010).
- Vandiver AR , IrizarryRA , HansenKDet al. Age and sun exposure-related widespread genomic blocks of hypomethylation in nonmalignant skin. Genome Biol.16, 80 (2015).
- Horvath S , OshimaJ , MartinGMet al. Epigenetic clock for skin and blood cells applied to Hutchinson Gilford Progeria Syndrome and ex vivo studies. Aging (Albany NY)10(7), 1758–1775 (2018).
- Maier AB , LeCessie S , DeKoning-Treurniet C , BlomJ , WestendorpRG , Van HeemstD. Persistence of high-replicative capacity in cultured fibroblasts from nonagenarians. Aging Cell6(1), 27–33 (2007).
- Bonder MJ , LuijkR , ZhernakovaDVet al. Disease variants alter transcription factor levels and methylation of their binding sites. Nat. Genet.49(1), 131–138 (2017).
- Van Iterson M , TobiEW , SliekerRCet al. MethylAid: visual and interactive quality control of large Illumina 450 k datasets. Bioinformatics30(23), 3435–3437 (2014).
- Aryee MJ , JaffeAE , Corrada-BravoHet al. Minfi: a flexible and comprehensive Bioconductor package for the analysis of Infinium DNA methylation microarrays. Bioinformatics30(10), 1363–1369 (2014).
- Morris TJ , BeckS. Analysis pipelines and packages for Infinium HumanMethylation450 BeadChip (450 k) data. Methods72, 3–8 (2015).
- Wickham H . Ggplot2: Elegant Graphics for Data AnalysisSpringer, NY, USA (2009).
- Du P , ZhangX , HuangCCet al. Comparison of beta-value and M-value methods for quantifying methylation levels by microarray analysis. BMC Bioinformatics11, 587 (2010).
- J Wang , QZhao. The CATE Package for High Dimensional Factor Analysis and Confounder Adjusted Multiple Testing. (2015). https://cran.r-project.org/web/packages/cate/vignettes/cate-vignette.pdf
- Van Iterson M , Van ZwetEW , ConsortiumB , HeijmansBT. Controlling bias and inflation in epigenome- and transcriptome-wide association studies using the empirical null distribution. Genome Biol.18(1), 19 (2017).
- Slieker RC , BosSD , GoemanJJet al. Identification and systematic annotation of tissue-specific differentially methylated regions using the Illumina 450 k array. Epigenetics Chromatin6(1), 26 (2013).
- Roadmap Epigenomics C , KundajeA , MeulemanWet al. Integrative analysis of 111 reference human epigenomes. Nature518(7539), 317–330 (2015).
- Kent WJ , SugnetCW , FureyTSet al. The human genome browser at UCSC. Genome Res.12(6), 996–1006 (2002).
- Szklarczyk D , FranceschiniA , WyderSet al. STRING v10: protein-protein interaction networks, integrated over the tree of life. Nucleic Acids Res.43(Database issue), D447–D452 (2015).
- Fleischer JG , SchulteR , TsaiHHet al. Predicting age from the transcriptome of human dermal fibroblasts. Genome Biol.19(1), 221 (2018).
- Slieker RC , ReltonCL , GauntTR , SlagboomPE , HeijmansBT. Age-related DNA methylation changes are tissue-specific with ELOVL2 promoter methylation as exception. Epigenetics Chromatin11(1), 25 (2018).
- Suh Y , AtzmonG , ChoMOet al. Functionally significant insulin-like growth factor I receptor mutations in centenarians. Proc. Natl Acad. Sci. USA105(9), 3438–3442 (2008).
- Passtoors WM , BeekmanM , DeelenJet al. Gene expression analysis of mTOR pathway: association with human longevity. Aging Cell12(1), 24–31 (2013).
- Mori R , TanakaK , DeKerckhove Met al. Reduced FOXO1 expression accelerates skin wound healing and attenuates scarring. Am. J. Pathol.184(9), 2465–2479 (2014).
- Slieker RC , Van ItersonM , LuijkRet al. Age-related accrual of methylomic variability is linked to fundamental ageing mechanisms. Genome Biol.17(1), 191 (2016).
- Rigel EG , LebwohlMG , RigelAC , RigelDS. Ultraviolet radiation in alpine skiing: magnitude of exposure and importance of regular protection. Arch. Dermatol.139(1), 60–62 (2003).