
Abstract
Aim: Inflammation represents a potential pathway through which socioeconomic position (SEP) is biologically embedded. Materials & methods: We analyzed inflammatory biomarkers in response to life course SEP by integrating multi-omics DNA-methylation, gene expression and protein level in 178 European Prospective Investigation into Cancer and Nutrition-Italy participants. Results & conclusion: We identified 61 potential cis acting CpG loci whose methylation levels were associated with gene expression at a Bonferroni correction. We examined the relationships between life course SEP and these 61 cis-acting regulatory methylation sites individually and jointly using several scores. Less-advantaged SEP participants exhibit, later in life, a lower inflammatory methylome score, suggesting an overall increased expression of the corresponding inflammatory genes or proteins, supporting the hypothesis that SEP impacts adult physiology through inflammation.
Socioeconomic position (SEP) is one of the most consistent determinants of health [Citation1]. Epidemiological studies worldwide have demonstrated strong, graded and persistent associations between indicators of SEP across the life course and a large range of health outcomes including cardiovascular and respiratory diseases, hypertension, diabetes and cancer [Citation2]. Although it is now established that disadvantaged SEP is associated with poorer health [Citation3], the relationship between SEP and health is not fully explained by established behavioral and lifestyle risk factors for chronic diseases [Citation4,Citation5]. Persistent socioeconomic disadvantage and psychosocial adversities experienced over the life course can induce a chronic overactivation and/or dysregulation of the physiological stress response [Citation6]. The latter has been shown to alter many biological mechanisms, in particular inflammatory and immune responses [Citation7]. In addition, there is increasing evidence that the inflammatory response is socially patterned, through a wide range of possible mediators at different molecular levels. A better understanding of the pathways and mechanisms through which social disadvantage affects health is key to reduce the harmful effect of SEP and ultimately address socioeconomic inequalities in health.
The association between disadvantaged life course SEP and elevated inflammatory proteins in adulthood – mainly including CRP and IL-6 – is supported by several recent meta-analyses [Citation8–10]. Some studies indicate that different types of adverse social conditions such as low SEP [Citation11–14], social isolation [Citation15,Citation16] and early-life social deprivation [Citation17] are related to the upregulation of the expression of several genes involved in the inflammatory pathways [Citation18], namely the conserved response to adversity [Citation19]. Epigenetics, as a potential regulator of gene expression without altering the genome, has been postulated to link adverse social exposures to health through the development of a proinflammatory state [Citation20]. Previous studies have demonstrated a link between global DNA methylation [Citation21–23], at individual genome-wide CpG site [Citation24–27] or at site-specific DNA methylation patterns related to inflammation [Citation28–30] and socially patterned stressors including disadvantaged childhood SEP [Citation24,Citation25,Citation28–31], adulthood SEP [Citation28,Citation29], perceived stress [Citation25] and neighborhood crime [Citation32]. These studies support the hypothesis that disadvantaged SEP may influence biological functioning, in particular the inflammation response, at different omics levels. However, studies considering the different omics levels in an integrative analysis are still sparse.
In previous studies in 268 participants from the Italian component of the European Prospective Investigation into Cancer and Nutrition (EPIC-Italy), we examined how SEP over the life course is likely to be embedded through the inflammatory system using: circulating levels of 28 inflammation-related proteins [Citation33] and 845 inflammatory genes [Citation34] considered separately, or combined into an transcriptome inflammatory score. Our results suggest that early-life SEP is associated with elevated levels of both inflammatory-related proteins and transcripts in adulthood. In the present study, we adopted a hypothesis-driven investigation focusing on inflammation measured at three different omic levels: proteins, transcripts and DNA methylation. We hypothesized that participants with a disadvantaged SEP will have lower inflammatory DNA methylation level compared with their advantaged counterparts that in turn will upregulate expression and traduction of these genes. Our approach first relied on identifying CpG sites associated with inflammatory-related transcripts and proteins, and subsequently investigate their relationships with three SEP indicators at different life stages. We examined these associations for each CpG site separately and through a composite inflammatory methylome score. Finally, we investigated life course effects of early-life SEP experiences by sequentially controlling for time-ordered SEP. We further explored the relationship between each molecular stratum at the score level by life course SEP assuming that a low inflammatory methylome score will result in a higher level of inflammatory genes and proteins.
Materials & methods
Study population
The EnviroGenoMarkers (EGM) project was initially designed as two nested case–control studies with the objective to identify novel biomarkers of non-Hodgkin’s lymphoma and breast cancer risk from multiple ‘-omics’ profiles [Citation35]. EGM includes participants from the Italian component of the EPIC-Italy [Citation36] and the Northern Sweden Health and Disease Study [Citation37]. In this study, 268 EGM participants from EPIC-Italy healthy at enrollment were included. For these participants, anthropometric, lifestyle, dietary and socioeconomic factors as well as blood samples were collected at recruitment. All participants provided informed consent, and the EPIC study protocol was approved by the review board of the International Agency for Research on Cancer and by all local institutes recruiting participants. The study was conducted in accordance with the approved ethical guidelines. Biosamples underwent genome wide expression and methylation as well as targeted proteomic inflammatory profiling in two distinct batches.
Life course SEP
As previously described, we used dichotomized indicators of each life course SEP factors from the EPIC questionnaire to preserve both power and interpretability [Citation33,Citation34].
Briefly ‘childhood SEP’ was approached by father’s occupation and recorded in the two following categories: ‘Manual’ grouping unskilled workers, skilled workers and farmers; and ‘Non-manual’ grouping retailers, employees and self-employed. Young ’adulthood SEP’ was measured through participant’s own education, which was dichotomized as ‘High’ (above the minimum legal education level, 15 years of age) and ‘Low’ (below the minimum legal education level). For ‘Adulthood SEP’, we used the highest occupational position in the household defined by either the participant’s own occupation or his/her partner’s and classified as ‘Manual’ and ‘Non-manual,’ using the same categorization described above for father’s occupation.
Laboratory analyses
Genome-wide methylation profiling experiments were conducted as previously described [Citation38], using the Illumina Infinium HumanMethylation450 platform according to manufacturers′ protocols. Briefly, the QIAsymphony DNA Midi Kit (Qiagen, Crawley, UK) was used to extract DNA samples from buffy coats. The DNA (500 ng) of each sample was bisulfite-converted using the EZ-96 DNA Methylation-Gold™ Kit (Zymo Research, CA, USA) and hybridized on the Infinium HumanMethylation 450 BeadChip. The beadchips were then scanned using the Illumina HiScan SQ scanner and intensities of the images were extracted using the GenomeStudio (v.2011.1) Methylation module (1.9.0) software. Data preprocessing was carried out using in-house software written for the R statistical computing environment resulting in a subset of 485,512 probes targeting autosomal CpG loci. Probes with SNPs in their sequence and/or detected in less than 10% of the samples were subsequently excluded from the analyses, leaving us with 367,648 probes in 188 samples. For each CpG, the methylation level at each locus was expressed as a β-value according to the fluorescent intensity ratio representing any value between 0 (unmethylated) and 1 (completely methylated).
Genome-wide expression profiling experiments were carried out using a previously published protocol [Citation35]. Briefly, the Agilent 4 × 44 K human whole genome microarray platform was used to obtain gene expression profiles. After assessing both technical performance and quality of the microarrays according to a protocol described [Citation35,Citation39], a total of 29,662 transcripts were successfully analyzed in 246 samples.
Proteomic assay
We used the MILLIPLEX HCYTOMAG-60K and HSCYTMAG-60SK kits (Millipore, MA, USA) following the manufacturers′ protocols to measure a panel of inflammatory-related proteins (N = 32) including 10 chemokines, 12 cytokines and 6 growth factors. Due to a high rate of nondetects (>75%), we excluded four analytes (IL-12, IL1-RA, sIL2-RA and Flt3ligand) from further statistical analyses leaving 28 proteins in 268 samples.
Inflammatory methylome definition
Transcriptomic-based definition of the inflammatory methylome
The 1027 inflammation-related genes list assembled by Loza et al. was used to define our inflammatory transcriptome and of these, 845 genes were assayed in our population [Citation34]. Using the manufacturer supplied annotation data, we looked up for the 845 inflammatory genes and mapped 11,502 CpG sites corresponding to 824 genes. The methylation-expression analyses were conducted in the subset of 173 participants with both DNA methylation and gene. Out of the 11,502 selected CpG sites, 4389 had on average seven missing values and were consequently imputed by the mean. We then ‘de-noised’ DNA methylation data, by subtracting potential technical confounding effects from the methylation levels. As previously described [Citation39], we ran a linear mixed model (including chip ID and position on the chip – as random intercepts) and subtracting the random effect estimates from the observed methylation levels. Expression levels of each of the 824 inflammatory genes were then regressed against methylation levels in the subset of CpG sites present in the given gene. In these analyses, linear mixed models were used between mRNA expression (dependent variable) and DNA methylation (independent variable) controlling for age, sex and phase (fixed effect) and technical covariates for transcriptomic profiling (i.e., isolation, hybridization and labeling dates) [Citation39]. We declared CpG–transcript pairs as significant based on Bonferroni 5% significance level (per-test significance level α’ = 0.05/[11,502 tests]), and the unique list of CpG sites involved in these associations defines the cis-acting CpG site. We identified 61 cis-acting regulatory CpG sites constitutive of the inflammatory methylome detailed in Supplementary Table 1.
Inflammatory methylome score
The inflammatory methylome score is defined as the average methylation level from the ‘de-noised’ DNA methylation data, across all the 61 cis-acting CpG sites (cis-methylation sites associated with gene expression). The higher the methylome score, the higher the level of methylation.
Alternative inflammatory methylome scores
In order to make the DNA methylation level distribution comparable between samples for each CpG sites, normalized z-scores were computed for each of the 61 cis-acting CpG sites. The z-scores from all CpG sites were subsequently summed up to create a combined inflammatory methylome z-score. As a hypothesis-free alternative, we used the first principal component (PC) from a principal component analyses (PCA) based on denoised DNA methylation data of all the cis-acting CpG sites. Each alternative of the inflammatory methylome score was defined from the from the ‘de-noised’ DNA methylation.
Proteins-based definition of the inflammatory methylome
Using the same approach, we sought for CpG sites whose methylation levels were linked the circulating levels of any of the 28 assayed inflammatory proteins. Using the manufacturer supplied annotation data, we looked up for the 28 proteins, and mapped 205 CpG sites corresponding to 27 proteins (seven CpG sites per protein on average). The methylation-protein analyses were conducted in the subset of 173 participants with both DNA methylation and protein concentration available from the same blood samples. Protein expression of each of the 27 inflammatory proteins were then regressed against methylation levels in the subset of the corresponding 205 CpG sites. In these analyses, linear mixed models were used between protein concentration (dependent variable) and DNA methylation (independent variable) controlling for age, sex and phase (fixed effect) and technical covariates for proteomic profiling including the identifier of the plate (random effect). As an exploratory approach among the 205 CpG–protein pairs tested, we declared a CpG–protein pair as significant based on 5% significance level. The five potential CpG sites associated with protein concentration are described in Supplementary Table 2. The ‘de-noised’ DNA methylation data for these five CpGs sites were used to derive the same three scores detailed above (mean derived score, z-score and principal components 1).
Statistical analyses
Single CpG site analyses
We modeled the relationship between each cis-acting CpG sites (dependent variable) and the binary SEP indicator (the independent variable of interest) using linear mixed models. We included chip ID and position on the chip as random effects to account for technical confounding. Age, gender, center (recorded in three categories: North, Central and South Italy), phase (corresponding to the two experimental batches) were included as fixed effects. We also included two binary variables indicating whether a participant is a prospective breast cancer or lymphoma case to account for the case–control design of EGM (Model 1). The 61 cis-acting CpG sites exhibit a strong pairwise correlation (Supplementary Figure 1). Results from a PCA of these 61 inflammatory markers revealed that 33 PCs explained more than 95% of the total variation seen in the dataset (Supplementary Figure 2). To account for the correlation in the data, the multiple testing corrected significance level was defined as p = 0.05/33 (p = 0.0015).
Inflammatory methylome score analyses
Because the inflammatory methylome scores were based on the ‘de-noised’ DNA methylation data, these were analyzed using linear models. Starting from the fixed effects included in Model 1 and detailed above, we considered smoking status (categorical: current, former, never); alcohol consumption (continuous, g/day); physical activity (categorical: inactive, moderately inactive, moderately active, active) and BMI (continuous variable, kg/m2) as potential mediators. Based on Model 1, we controlled for each behavioral factor and BMI separately. Model 2 included the behavioral factors listed above and BMI.
Life course analyses of the inflammatory methylome scores
We developed four time-sequenced linear models adjusted for the chronologically ordered of life course SEP resulting in:
Model A: Age, gender, case–control status, phase, center and father’s occupation;
Model B-1: Model A + education;
Model B-2: Model A + highest household occupational position;
Model C: Model B-1 + highest household occupational position;
Model D was subsequently built upon Model C to control for potential mediators including the three behavioral factors described above and BMI.
Sensitivity analyses
Model 1, 2 and life course models were also run for each alternative definition of the score (z-score and PC1) and the two definitions of the inflammatory methylome (transcriptomic or proteomic based).
Cell type estimation
For each type of analyse, we further adjusted the regression models for blood cell composition, estimated according to the methods proposed by Houseman using the R package EpiDISH. In brief, the EpiDISH package uses blood cell-specific DNA methylation reference profiles of known cell-type-specific DNAse hypersensitive sites to provide cell-count estimates by robust partial correlations. We obtained relative proportions of B-cells, TCD4+ cells, TCD8+ cells, natural killer (NK) cells, monocytes, neutrophils and eosinophils subsequently combined to derive the proportion of lymphocytes, granulocytes and monocytes. We found that the EPIC samples included in this study (N = 173) contained an average of 29.7% lymphocytes, 62.2% granulocytes and 8.1% of monocytes.
Targeted integration of corresponding gene expression & protein levels data
For both transcriptomic- and proteins-based definition of the inflammatory methylome, we defined the corresponding score at the transcriptomic and proteomic level. Briefly, for each of the 61 genes, we defined a dichotomized indicator: ‘high gene expression level’ = 1, and ‘low gene expression level’ = 0 based on the highest quartile of the gene expression level, and summed these across the 61 genes. For each of the five proteins, the score was calculated following the same procedure based on the highest quartile of the log-transformed concentrations. Spearman correlation was then used to assess the relationship between the inflammatory methylome and transcriptome scores and the inflammatory methylome and proteome scores.
Statistical analyses were performed using R v3.5.0.
Results
Study population
Characteristics of the 173 participants with both gene expression and DNA methylation are summarized in . For each SEP indicator, participants in the disadvantaged group tend to be older, to have a higher BMI and to be nonsmokers compared with their advantaged counterparts.
Table 1. Summary characteristics of the study population by life course socioeconomic position.
Description of the inflammatory methylome
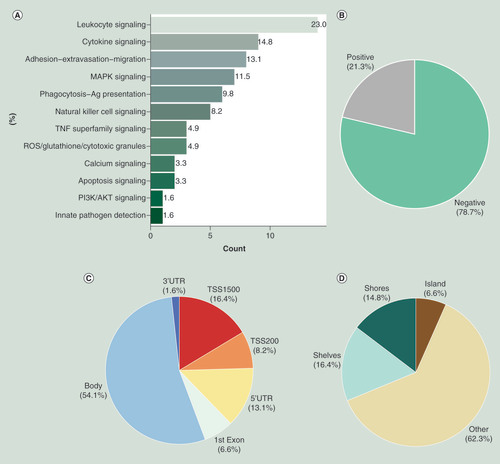
We identified 61 out of 11,502 potential cis-acting regulatory methylation sites (expression Methylation Site, eMS) as CpG sites for which methylation was associated with expression of the CpG site’s closest gene at a Bonferroni threshold (p < 4.3 × 10⁻⁶; Supplementary Table 1). Most of CpG sites were from the leukocyte (23%) and cytokine (14.8%) signaling subpathways (). The vast majority (78.7%) of the CpG sites were inversely associated with transcripts levels in cis (). Overall, the majority of probes (>50%) were situated in gene bodies, followed by approximately 15% of probes situated within 1500 bp upstream of TSS (). We identified the majority of cis-eMS (62.3%) were in open sea, followed by shelves (16.4%), shores (14.8%) and islands (6.6%) (). A similar pattern was observed between CpG sites whose methylation was negatively associated with expression (Supplementary Figure 3), while CpG sites whose methylation was positively associated with expression were mostly located in gene body (Supplementary Figure 4). Few CpG sites were no longer associated with gene expression after controlling for cell type composition (N = 9; p ≥ 0.05; Supplementary Table 1).
Frequency of the 61 cis-eMS defining the inflammatory methylome by (A) inflammatory subpathway; (B) correlation between DNA methylation and gene expression; (C) physical distribution and (D) CpG island and neighborhood context.
eMS: Expression methylation site.
Transcriptomic-based definition of the inflammatory methylome profiles at a single-base resolution
We first examined associations between the 61 CpG sites individually and each SEP along the life course separately using as reference the most advantaged socioeconomic group. Therefore, a negative association indicates a hypomethylation in less advantaged socioeconomic groups. Although no association remains significant after correction for multiple testing with our three SEP indicators, DNA methylation level exhibited general negative associations with father’s occupational position, educational level and the highest household occupational position, respectively, 57, 82 and 80% of the regression coefficient were negative (Supplementary Table 3 & Figures 5–7).
Transcriptomic-based definition of the inflammatory methylome at a score resolution
As detailed in the methods section, DNA methylation score was calculated for the inflammatory methylome by taking the arithmetic mean of the methylation levels from the 61 cis-eMS. Both educational level and the highest household occupational position were found significantly associated with the inflammatory methylome score: participants from disadvantaged socioeconomic groups had a lower inflammatory methylome score (β = -0.0075; p = 0.0067; β = -0.0076; p = 0.0073 for educational level and the highest household occupational position, respectively). The inflammatory methylome score was lower in participants whose father had a low occupational position but the association was not significant (). Adjusting for either behavioral factors, BMI or all covariates together only marginally affected our results: effect size estimates showed consistent signs, and associations remained statistically significant for both participant’s education and the highest household occupational position (p < 0.05 across all models investigated, Supplementary Table 4).
Table 2. Linear regression results for the inflammatory methylome and each of the three life course socioeconomic position factors in the European Prospective Investigation into Cancer and Nutrition-Italy participants from EnviroGenoMarkers (N = 155).
The association between education level and lower inflammatory methylome score was not affected by adjusting for father’s occupational position (, Model B-1, β = -0.008; p = 0.008), and weakened while controlling for the highest household occupational position (, Model C, β = -0.006; p = 0.08). Adjustments for potential (behavioral) mediators further weakened this association, which lost statistical significance (, Model D, β = -0.005; p = 0.139). Further adjustment for the estimated cell type proportions slightly strengthened the association with participant’s education (, fully adjusted model, β = -0.006; p = 0.030). The association between the inflammatory methylome score and the highest household occupational position was weakened by adjusting for father’s occupational position (, Model B-1, β = -0.008; p = 0.009), and no longer significant when controlling participant’s education (, Model B-2, β = -0.008; p = 0.011 and Model C, β = -0.005; p = 0.103) and for potential (behavioral) mediators (, Model D, β = -0.005; p = 0.106) as well as in the fully adjusted model (β = -0.003; p = 0.175).
Table 3. Life course multiple regression analyses and the inflammatory methylome. Results are presented for the inflammatory methlyome score (A), the inflammatory methylome z-score (B) and the first PC (C). Estimates are based on 155 participants with complete socioeconomic position, lifestyle information and DNA methylation data.
As a sensitivity analyses, the inflammatory methylome score was also investigated by considering two alternative definitions: we calculated a z-score and ran a principal component analyses on the 61 cis-eMS (PC1, explaining 44.2% of the variance). Our results were slightly weakened but remained consistent; significant associations between educational level and highest household occupational position and the inflammatory methylome scores were observed (). We identified consistent associations for both alternative scores (z-score and PC1) after adjusting for either behavioral factors, BMI or all covariates together (Supplementary Table 4). Our results and conclusions from the sequentially adjusted model for early-life, young adulthood and adulthood SEP indicators remained markedly stable albeit weakened irrespective of the score considered: the z-score () and the first principal component from the 61 DNA methylation level ().
Testing the functional relevance of the inflammatory methylome at the protein level
To evaluate whether DNA methylation levels affect inflammatory protein concentrations, we looked for CpG sites associated with 27 inflammatory proteins in a subset of 173 EPIC-Italy participants (see Methods section). We identified five potential regulatory methylation sites (pMS) as CpG sites whose methylation was associated with protein level of the CpG site’s closest gene (p < 0.05, Supplementary Table 2). Adjustment for the estimated cell type proportions (see Methods section, lymphocytes and monocytes) slightly weakened the association between DNA methylation level and protein concentrations for two CpG sites. As above, the DNA methylation score was calculated for the inflammatory methylome by taking the arithmetic mean of the methylation levels from the five pMS. We observed a significant association between participant’s education and the highest household occupational position and the inflammatory methylome score where disadvantaged participants had a lower inflammatory methylome score compared with their advantaged counterparts (Supplementary Table 5, Model 1, β = -0.0044; p = 0.025; β = -0.0056; p = 0.005 for educational level and the highest household occupational position, respectively). Effect size estimates showed consistent signs, and associations reached statistical significance for both participant’s education and the highest household occupational position after controlling for either behavioral factors and BMI, or all of them together (Supplementary Table 5, Model 2, β = -0.0043; p = 0.033; β = -0.0051; p = 0.0115 for educational level and the highest household occupational position, respectively). By sequentially controlling for time-ordered SEP, we observed that the association between educational attainment and inflammatory methylome score was slightly weakened by adjusting for father’s occupational position, and no longer significant when controlling for the highest household occupational position (Supplementary Table 6A, Model B-1 and C, respectively, β = -0.005, p = 0.032; β = -0.003; p = 0.24). The association between the highest household occupational position and the inflammatory methylome was not affected upon adjustment for early-life SEP (Model B-2, β = -0.006, p = 0.0072) and weakened when controlling for young adulthood SEP (Model C, β = -0.005, p = 0.047) and upon adjustment for potential mediators (Model D, β = -0.004; p = 0.0821; Supplementary Table 6A). Associations were consistent using either alternative scores (z-score and the principal component 1 explaining 35.6% of the variance, Supplementary Table 6B & C, respectively) and controlling for cell composition marginally affected the results (Supplementary Table 6, fully adjusted model).
Integration of the inflammatory methylome with the inflammatory transcriptome & proteome
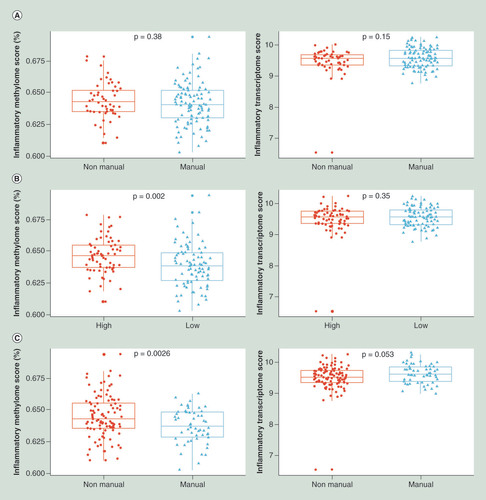
To investigate the potential increased inflammatory responses to a lower inflammatory methylome score at the gene expression level and proteins concentration, we further explored the relationship between the inflammatory methylome and the corresponding transcriptome by life course SEP. Briefly, the 61 genes measured in the same 155 samples with detailed information on SEP and behavioral factors and BMI were combined into a score by taking the mean. We first observed a negative correlation between the inflammatory methylome and transcriptome scores (Spearman correlation = -0.35). Results by life course SEP are given , a modest increase of the corresponding inflammatory transcriptome was observed only in adulthood (), while no differences were observed for early-life and young adulthood SEP ( & B). Additional analyses using the proteins-based definition revealed a modest increase of the corresponding inflammatory proteome only in participant’s whose father had a manual occupation (Supplementary Figure 8A) and no differences were observed later in life (Supplementary Figure 8B & C).
(A) Father’s occupational position; (B) participant’s education and (C) the highest household occupational position from 155 EPIC-Italy participants. t-test mean comparison p-values are reported for each score by SEP.
EPIC-Italy: European Prospective Investigation into Cancer and Nutrition-Italy; SEP: Socioeconomic position.
Discussion
In the present study, we employed a gene candidate approach to specifically look for inflammatory related CpG sites associated with their closest gene at two molecular levels (gene expression and proteins) in order to define a functionally relevant inflammatory methylome. We further investigated the association between SEP at different time points in life and the inflammatory methylome as defined by the methylation levels at the 61 cis-acting CpG sites. While we did not identify any significant association after correction for multiple testing when examining each of the 61 CpGs associated with gene expression in relation to the three SEP indicators separately (which could be due to the limited statistical power our population size yields), the use of an inflammatory methylome score combining methylation levels across all 61 cis-acting CpG sites revealed significant associations with SEP. In particular, we found that while no difference was observed between participants reporting a father with a ‘manual’ occupation compared with those whose father had a ‘non-manual’ occupation, participants with a less advantaged SEP in young adulthood or in adulthood, later in life, had a lower inflammatory methylome score compared with participants with a more advantaged SEP. These associations, independent of major lifestyle-related risk factors, were robust to the definition of the inflammatory methylome score. Analysis using a life course approach indicated a stronger effect of young adulthood SEP on the inflammatory methylome albeit weakened when controlling for SEP in adulthood. This is suggestive of a shared pathway between SEP at each life stage as well as an indirect pathway between educational attainment and the inflammatory methylome. The exploratory analyses testing the functional relevance of CpGs associated with protein concentration showed consistent, though statistically weakened, associations between life course SEP and the protein-based inflammatory methylome.
Some limitations of this study should be considered. We used data from a cancer–case control study nested within the EPIC-Italy cohort meaning that half of the participants developed either a non-Hodgkin’s lymphoma or a breast cancer during the follow-up affecting both representativeness and generalizability of our results. However, blood samples were collected at enrollment when the participants were healthy. We further selected participants with complete information on life course SEP, behavioral variables, BMI and measure of inflammation at multiple molecular levels that are subjected to measurement errors and leading to a small-sample size limiting the statistical power and restricting our methodological choices. All three life course SEP were recorded into binary indicators leading to some degree of misclassification. Associations between SEP and the inflammatory methylome score were independent of major behaviors and lifestyle-related risk factors. We did not investigated the mediating roles of those risk factors within a life course approach using mediation-based methods. Additionally, we cannot rule out: the possibility that other factors may be potentially involved in social differences in DNA methylation including infection, environmental or psychosocial exposures, but these exposures were not available in the study; the presence of time-varying confounding. Conventional statistical methods in the presence of time-varying confounding can result to an overadjustment bias by removing part of the effect of the past exposure and/or collider stratification bias.
We considered only the CpG sites in cis, although some informative sites may also act in trans. As a sensitivity analyses we ran all analyses restricting our definition of the inflammatory methylome on the 48 CpGs sites inversely associated with transcripts levels and results were mostly unchanged (Supplementary Tables 7 & 8). Another limitation is in scores measurement because there is no standard measure for building scores, however, we proposed several scores to approach the inflammatory methylome and our results were consistent. Finally, DNA methylation was assessed from whole blood and could be confounded by cellular heterogeneity [Citation40], however, our results were only marginally affected after correction for cell composition.
Strengths of our study include the use of widely used measures of life course SEP as well as measurement of inflammation at multiple molecular scales (methylation level, gene expression and protein concentration) together with a wide range of information about lifestyle factors that allows us to control for important potential mediators. Moreover, to our knowledge, no other studies have examined associations of life course SEP with inflammation using an integrated approach of multiple omics levels.
Several recent studies have supported the possibility of differential DNA methylation profiles in peripheral blood cells associated with individuals social factors [Citation41] and other risk factors [Citation42]. In a previous study using participants from EPIC-Italy, we reported that indicators of life course SEP were associated with DNA methylation levels in genes (N = 17 genes, corresponding to 403 CpG sites) involved in inflammation [Citation29]. Numerous studies have investigated associations between childhood disadvantage and DNA methylation pattern later in life [Citation22,Citation24,Citation25,Citation28,Citation43]. A genome wide methylation scan was performed in 40 adult men from the 1958 British Birth Cohort and identified differential methylation of 1252 gene promoters [Citation24] Another study showed association of childhood SEP with methylation of SAT2 repetitive elements in more than 80 participants from the New York site of the Collaborative Perinatal Project [Citation22]. A gene candidate approach was performed in more than 1000 participants from the Multi-Ethnic Study of Atherosclerosis focusing on 18 candidate genes related to stress reactivity and inflammation demonstrating that disadvantaged childhood SEP was associated with adulthood DNA methylation in three stress-related genes and two inflammation-related genes [Citation28]. Evidence is accumulating suggesting an association between childhood socioeconomic disadvantage and methylation patterns.
Our study did not find support for the hypothesis that disadvantaged SEP in early life was associated with the inflammatory methylome independent of later in life SEP, which might be partly due to our limited sample size and the selection of the study population. However, differences in our conclusions may also reflect contextual and methodological aspect including the definition of SEP and/or the methods used to analyze DNA methylation level. Nevertheless, our study underlines the influence of education on inflammatory methylome in accordance to another study showing a consistent association between educational attainment and inflammation later in life measured using the CRP [Citation44].
Conclusion
Our study suggests that low SEP, particularly education, is associated with a global hypomethylation of the inflammatory methylome in peripheral blood cells, which potentially increased expression of the corresponding inflammatory genes, and may potentially contribute in the long term to the onset and progression of inflammatory-related disorders like cardiovascular diseases, diabetes and cancers.
More work is needed to examine the functional consequences of the observed inflammatory load. A deeper understanding of the mechanisms by which social environment influences inflammation could have profound implications in treatment and more specifically in prevention, by potentially identifying modifiable environmental factors that affect physiological health.
Future perspective
In the upcoming years, researchers should strive to design longitudinal studies in which participants from disadvantaged populations from early life are included and well characterized along the life course in term of exposures and blood collection to better understand the role of epigenetic variation in response to environmental and psychosocial stressors on adverse health outcomes. Further functional studies will be particularly useful to investigate the downstream consequences of epigenomic variations. Similar efforts should be undertaken to better characterize the complex interplay between environmental stress, genotype and epigenetic to characterize to which extent this complex interplay contribute to explain social inequalities in health.
Chronic inflammation has emerged as a mechanism by which socioeconomic position (SEP) over the life course confers a risk for many health outcomes.
We adopted a gene–candidate approach to explore the inflammatory response to life course SEP.
We defined a functionally relevant inflammatory methylome based on the identification of CpG sites associated with inflammatory-related genes and proteins.
When each CpG sites were examined individually, no significant associations with life course SEP were found.
The use of an inflammatory methylome score revealed significant associations with SEP.
Participants with a less-advantaged SEP in young adulthood and in adulthood had a lower inflammatory methylome score compared with their advantaged counterparts.
These associations were independent of the behavioral factors considered and BMI and robust to the score definition.
The protein-based definition of the inflammatory methylome showed weakened but consistent results.
Integrative analyses suggest that the lower inflammatory methylome was correlated to a modest increase of the corresponding inflammatory transcriptome or proteome.
Ethical conduct of research
For all human investigations, appropriate institutional review board approval was obtained following the principles outlined in the Declaration of Helsinki. In addition, informed consent has been obtained from the participants involved.
Supplemental Figure 1
Download MS Word (1.3 MB)Supplemental Table 2
Download MS Excel (63.4 KB)Supplemental Document 3
Download Zip (1.1 MB)Acknowledgments
The authors thank all the centers that took part in the study and the additional members of the EnviroGenoMarkers Consortium. For further information on the EnviroGenoMarkers Consortium, please visit http://www.envirogenomarkers.net/
Supplementary data
To view the supplementary data that accompany this paper please visit the journal website at: www.tandfonline.com/doi/suppl/10.2217/epi-2019-0261
Financial & competing interests disclosure
This work was supported by the Institut National du Cancer (SHSESP14–082 to R Castagné). This study was supported by the European Commission Horizon 2020 grant number 633666 to P Vineis and the 7th European Framework Programme (FP7) for the Envirogenomarkers (226756 to SA Kyrtopoulos) projects. The Centre for Environment and Health is supported by the Medical Research Council and Public Health England (MR/L01341X/1). M Chadeau-Hyam acknowledges support from Cancer Research UK, Population Research Committee Project grant (‘Mechanomics’ project #22184 to M Chadeau-Hyam). The authors have no other relevant affiliations or financial involvement with any organization or entity with a financial interest in or financial conflict with the subject matter or materials discussed in the manuscript apart from those disclosed.
No writing assistance was utilized in the production of this manuscript.
Additional information
Funding
References
- Stringhini S , CarmeliC , JokelaMet al. Socioeconomic status and the 25 × 25 risk factors as determinants of premature mortality: a multicohort study and meta-analysis of 1.7 million men and women. Lancet Lond. Engl.389(10075), 1229–1237 (2017).
- Adler NE , OstroveJM. Socioeconomic status and health: what we know and what we don’t. Ann. NY Acad. Sci.896, 3–15 (1999).
- Marmot M , FrielS , BellR , HouwelingTA , TaylorS. Closing the gap in a generation: health equity through action on the social determinants of health. Lancet372(9650), 1661–1669 (2008).
- Stringhini S , DugravotA , ShipleyMet al. Health behaviours, socioeconomic status, and mortality: further analyses of the British Whitehall II and the French GAZEL prospective cohorts. PLoS Med.8(2), e1000419 (2011).
- Gallo V , MackenbachJP , EzzatiMet al. Social inequalities and mortality in Europe – results from a large multi-national cohort. PLoS ONE7(7), e39013 (2012).
- McEwen BS . Physiology and neurobiology of stress and adaptation: central role of the brain. Physiol. Rev.87(3), 873–904 (2007).
- Yang EV , GlaserR. Stress-induced immunomodulation and the implications for health. Int. Immunopharmacol.2(2–3), 315–324 (2002).
- Nazmi A , VictoraCG. Socioeconomic and racial/ethnic differentials of C-reactive protein levels: a systematic review of population-based studies. BMC Public Health7, 212 (2007).
- Liu RS , AielloAE , MensahFKet al. Socioeconomic status in childhood and C reactive protein in adulthood: a systematic review and meta-analysis. J. Epidemiol. Community Health71(8), 817–826 (2017).
- Muscatell KA , BrossoSN , HumphreysKL. Socioeconomic status and inflammation: a meta-analysis. Mol. Psychiatry(2018) ( Online ahead of print).
- Chen E , MillerGE , WalkerHA , ArevaloJM , SungCY , ColeSW. Genome-wide transcriptional profiling linked to social class in asthma. Thorax64(1), 38–43 (2009).
- Chen E , MillerGE , KoborMS , ColeSW. Maternal warmth buffers the effects of low early-life socioeconomic status on pro-inflammatory signaling in adulthood. Mol. Psychiatry16(7), 729–737 (2011).
- Levine ME , ColeSW , WeirDR , CrimminsEM. Childhood and later life stressors and increased inflammatory gene expression at older ages. Soc. Sci. Med.130, 16–22 (2015).
- Gaye A , GibbonsGH , BarryC , QuarellsR , DavisSK. Influence of socioeconomic status on the whole blood transcriptome in African Americans. PLoS ONE12(12), e0187290 (2017).
- Cole SW , HawkleyLC , ArevaloJM , SungCY , RoseRM , CacioppoJT. Social regulation of gene expression in human leukocytes. Genome Biol.8(9), R189 (2007).
- Cole SW , HawkleyLC , ArevaloJMG , CacioppoJT. Transcript origin analysis identifies antigen-presenting cells as primary targets of socially regulated gene expression in leukocytes. Proc. Natl Acad. Sci. USA108(7), 3080–3085 (2011).
- Miller GE , ChenE , FokAKet al. Low early-life social class leaves a biological residue manifested by decreased glucocorticoid and increased proinflammatory signaling. Proc. Natl Acad. Sci. USA106(34), 14716–14721 (2009).
- Cole SW . Social regulation of human gene expression: mechanisms and implications for public health. Am. J. Public Health103(S1), S84–S92 (2013).
- Cole SW . Human social genomics. PLoS Genet.10(8), e1004601 (2014).
- Simanek AM , AuerPL. Early life socioeconomic disadvantage and epigenetic programming of a pro-inflammatory phenotype: a review of recent evidence. Curr. Epidemiol. Rep.5, 407–417 (2018).
- McGuinness D , McGlynnLM , JohnsonPCDet al. Socio-economic status is associated with epigenetic differences in the pSoBid cohort. Int. J. Epidemiol.41(1), 151–160 (2012).
- Tehranifar P , WuH-C , FanXet al. Early life socioeconomic factors and genomic DNA methylation in mid-life. Epigenetics8(1), 23–27 (2013).
- Subramanyam MA , Diez-RouxAV , PilsnerJRet al. Social factors and leukocyte DNA methylation of repetitive sequences: the multi-ethnic study of atherosclerosis. PLoS ONE8(1), e54018 (2013).
- Borghol N , SudermanM , McArdleWet al. Associations with early-life socio-economic position in adult DNA methylation. Int. J. Epidemiol.41(1), 62–74 (2012).
- Lam LL , EmberlyE , FraserHBet al. Factors underlying variable DNA methylation in a human community cohort. Proc. Natl Acad. Sci. USA109(Suppl. 2), 17253–17260 (2012).
- Beach SRH , LeiM-K , BrodyGHet al. Parenting, socioeconomic status risk, and later young adult health: exploration of opposing indirect effects via DNA methylation. Child Dev.87(1), 111–121 (2016).
- van Dongen J , BonderMJ , DekkersKFet al. DNA methylation signatures of educational attainment. NPJ Sci. Learn.3, 7 (2018).
- Needham BL , SmithJA , ZhaoWet al. Life course socioeconomic status and DNA methylation in genes related to stress reactivity and inflammation: the multi-ethnic study of atherosclerosis. Epigenetics10(10), 958–969 (2015).
- Stringhini S , PolidoroS , SacerdoteCet al. Life-course socioeconomic status and DNA methylation of genes regulating inflammation. Int. J. Epidemiol.44(4), 1320–1330 (2015).
- McDade TW , RyanC , JonesMJet al. Social and physical environments early in development predict DNA methylation of inflammatory genes in young adulthood. Proc. Natl Acad. Sci. USA114(29), 7611–7616 (2017).
- Alfano R , GuidaF , GalobardesBet al. Socioeconomic position during pregnancy and DNA methylation signatures at three stages across early life: epigenome-wide association studies in the ALSPAC birth cohort. Int. J. Epidemiol.48(1), 30–44 (2018).
- Smith JA , ZhaoW , WangXet al. Neighborhood characteristics influence DNA methylation of genes involved in stress response and inflammation: the multi-ethnic study of atherosclerosis. Epigenetics12(8), 662–673 (2017).
- Castagné R , DelpierreC , Kelly-IrvingMet al. A life course approach to explore the biological embedding of socioeconomic position and social mobility through circulating inflammatory markers. Sci. Rep.6, 25170 (2016).
- Castagné R , Kelly-IrvingM , CampanellaGet al. Biological marks of early-life socioeconomic experience is detected in the adult inflammatory transcriptome. Sci. Rep.6, 38705 (2016).
- Hebels DGAJ , GeorgiadisP , KeunHCet al. Performance in omics analyses of blood samples in long-term storage: opportunities for the exploitation of existing biobanks in environmental health research. Environ. Health Perspect.121(4), 480–487 (2013).
- Palli D , BerrinoF , VineisPet al. A molecular epidemiology project on diet and cancer: the EPIC-Italy Prospective Study. Design and baseline characteristics of participants. Tumori.89(6), 586–593 (2003).
- Hallmans G , AgrenA , JohanssonGet al. Cardiovascular disease and diabetes in the Northern Sweden Health and Disease Study Cohort – evaluation of risk factors and their interactions. Scand. J. Public Health Suppl.61, 18–24 (2003).
- Georgiadis P , LiampaI , HebelsDGet al. Evolving DNA methylation and gene expression markers of B-cell chronic lymphocytic leukemia are present in pre-diagnostic blood samples more than 10 years prior to diagnosis. BMC Genomics18(1), 728 (2017).
- Chadeau-Hyam M , VermeulenRCH , HebelsDGet al. Prediagnostic transcriptomic markers of Chronic lymphocytic leukemia reveal perturbations 10 years before diagnosis. Ann. Oncol.25(5), 1065–1072 (2014).
- Teschendorff AE , ZhengSC. Cell-type deconvolution in epigenome-wide association studies: a review and recommendations. Epigenomics9(5), 757–768 (2017).
- Esposito EA , JonesMJ , DoomJR , MacIsaacJL , GunnarMR , KoborMS. Differential DNA methylation in peripheral blood mononuclear cells in adolescents exposed to significant early but not later childhood adversity. Dev. Psychopathol.28(4 Pt 2), 1385–1399 (2016).
- Terry MB , Delgado-CruzataL , Vin-RavivN , WuHC , SantellaRM. DNA methylation in white blood cells. Epigenetics6(7), 828–837 (2011).
- Bush NR , EdgarRD , ParkMet al. The biological embedding of early-life socioeconomic status and family adversity in children’s genome-wide DNA methylation. Epigenomics10(11), 1445–1461 (2018).
- Berger E , CastagnéR , Chadeau-HyamMet al. Multi-cohort study identifies social determinants of systemic inflammation over the life course. Nat. Commun.10(1), 773 (2019).