
 ?Mathematical formulae have been encoded as MathML and are displayed in this HTML version using MathJax in order to improve their display. Uncheck the box to turn MathJax off. This feature requires Javascript. Click on a formula to zoom.
Abstract
Aim: DNA methylation is a key epigenetic mechanism regulating gene expression. Identifying differentially methylated regions is integral to DNA methylation analysis and there is a need for robust tools reliably detecting regions with significant differences in their methylation status. Materials&methods: We present here a reproducibility-optimized test statistic (ROTS) for detection of differential DNA methylation from high-throughput sequencing or array-based data. Results: Using both simulated and real data, we demonstrate the ability of ROTS to identify differential methylation between sample groups. Conclusion: Compared with state-of-the-art methods, ROTS shows competitive sensitivity and specificity in detecting consistently differentially methylated regions.
DNA methylation is a major epigenetic mechanism that plays a central role in gene regulation. It affects a wide spectrum of biological states from normal development and aging to complex diseases such as cancer [Citation1,Citation2] and diabetes [Citation3,Citation4]. Among the available platforms for DNA methylation detection, methods based on bisulfite conversion are the most popular, including both microarray- and high-throughput sequencing-based techniques [Citation5]. For methylation microarray data, Illumina Infinium platform has been widely used, including for instance more than 10,000 samples in the Cancer Genome Atlas (TCGA) and around 40,000 human samples in the Gene Expression Omnibus [Citation6]. With high-throughput sequencing techniques, whole-genome bisulfite sequencing provides whole-genome coverage with single-base resolution, whereas reduced representation bisulfite sequencing (RRBS) is a cost-effective alternative, covering genomic areas enriched with a high CpG content (∼85% of the CpG islands in the human genome) [Citation7,Citation8].
The primary goal of DNA methylation analysis is to identify systematic differences between groups of samples, such as cases versus controls. To enable reliable detection of differentially methylated regions (DMRs) for further validation and interpretation, robust tools are needed to rank DMRs on the basis of their significance. Although computational tools have already been developed for differential methylation analysis [Citation9–13], the field lacks consensus on the best tools. While a recent comparison highlighted the differences between the methods, none of the compared methods could be considered as a generally applicable leading methodology [Citation14].
To address the need for a method enabling robust identification of DMRs, we demonstrate here the utility of our reproducibility-optimized test statistic (ROTS) [Citation15] for differential DNA methylation analysis. ROTS was originally designed for differential gene expression analysis and its good performance has been shown in a number of gene and protein expression studies [Citation15–18]. Here, we adapted ROTS to DNA methylation studies and showed its benefits in both sequencing- and array-based DNA methylation data.
Materials&methods
Sequencing datasets&preprocessing
Simulated DNA methylation sequencing data were generated as described in [Citation14] using dataSim2.R downloaded from the online repository containing the source code and additional resources for the article. The read coverage of the simulated data was modeled by a binomial distribution and the methylation background followed beta distribution [Citation14]. A total of 12 different simulation scenarios were considered, including methylation change of 10, 15 or 25%, number of sites of 5000 or 50,000 and proportion of true positives of 5 or 20%. Five samples were simulated in the control group and five samples in the case group.
The real DNA methylation sequencing data were from a previous RRBS study on human pluripotent stem cells [Citation19]. The data included six samples before and six samples after spontaneous transformation to abnormal karyotypes, referred to as normal and abnormal samples, respectively. The DNA libraries were sequenced using 50 bp reads on the Illumina HiSeq2000 or HiSeq2500 platform. The data were downloaded from www.ncbi.nlm.nih.gov/bioproject under the accession number PRJNA310646.
The quality control and preprocessing of the sequenced reads were performed using Trim Galore! 0.4.1 along with Cutadapt 1.9.dev. The nondefault Trim Galore! parameters used were --stringency = 3 (to remove adapter parts overlapping with three or more bases) and --rrbs (to remove filled-in cytosines). The preprocessed reads were mapped to the hg19 reference genome using Bismark version 0.10 [Citation20] with Bowtie 2 version 2.0.5 [Citation21] using default parameters. The methylation calling was performed using the Bismark methylation extractor module in default mode, resulting in base-level methylation values representing the proportion of methylation in range 0–100. Only CpG sites with a methylation coverage of at least ten reads were used in the downstream analysis. Base-pair resolution cytosine methylation levels were further summarized to 100 bp windows by taking the median across the base-level methylation level values within each window.
For statistical testing, we required that a feature (single site or window) had at least three nonmissing values in both sample groups. Additionally, features with a constant value across all samples when binarized (values below 50 converted to zero and values above or equal to 50–100) were excluded, leaving 33,282 single sites or 18,238 windows for statistical testing.
Array-based dataset&preprocessing
The array-based DNA methylation data were downloaded from TCGA database via the National Cancer Institute (NCI) Genomic Data Commons data portal under the project named TCGA Kidney Renal Clear Cell Carcinoma (TCGA-KIRC). The data included baseline tumor samples from 398 patients diagnosed with clear cell renal cell carcinoma (ccRCC) together with clinical information, involving 132 metastatic and 266 nonmetastatic patients. Two Illumina Infinium DNA methylation platforms, HumanMethylation27 (HM27) BeadChip and HumanMethylation450 (HM450) BeadChip, were used to obtain the methylation profiles [Citation6].
The microarray data were preprocessed by TCGA using the R package methylumi version 2.22.0 [Citation22]. Briefly, the DNA methylation level for each CpG locus was summarized as a beta value ranging from zero to one, representing the proportion of methylation. Probes corresponding to loci having nonsignificant quality values (p > 0.05) were filtered out, leaving 21,073 probes for statistical testing.
ROTS
The ROTS is a data adaptive approach. Instead of making any a priori assumptions about the characteristics of the data, ROTS utilizes a family of t-type statistics (dα) to optimize the reproducibility Rk(dα) of the k top-ranked features in pairs of bootstrapped datasets [Citation16]. More specifically, ROTS maximizes the reproducibility z-statistic Zk(dα):
over parameters α and the top list size k. Here, Rk(dα) and denote the reproducibility of the bootstrapped and randomized data, respectively, and sk(dα) is the estimated standard deviation of the bootstrap distribution. The reproducibility Rk(dα) is defined as the average overlap of the k top-ranked features over B pairs of bootstrap datasets. For each pair b of bootstrap data matrices (
,
) the reproducibility is calculated as
where denotes the rank of feature g in data
with the statistic dα and #S is the cardinality of set S.
The test statistics dα for a genomic feature of g (here DNA methylation region) is defined as
where and
are the average methylation levels of feature g in the experimental conditions i and j and sg represents the estimated standard error and α1.#x00A0;≥ 0 and α2.#x00A0;∈ {0,1} are the parameters to be optimized.
As input data, ROTS requires a matrix of preprocessed and normalized data with columns representing the samples and rows representing the methylation regions. The ROTS package and a detailed manual are freely available through Bioconductor at http://bioconductor.org/packages/ROTS.
Differential methylation analysis of the sequencing data
Differential methylation analysis of the DNA methylation sequencing data was performed using ROTS, RnBeads and MethylKit using the same input data.
For ROTS (version 1.5.4 on R 3.3.3), the methylation values in range 0–100 were scaled to range zero-to-one, the number of bootstraps was set to B = 1000 and the maximum number of top-ranked features for reproducibility optimization was set to K = 10,000. ROTS reports a top list size k, which gives the highest reproducibility Z-score. If the reported k is close to the value of the parameter K, the maximum top list size might have been too small and increasing it should be considered. It is recommended that the value of K should be considerably higher than the number of features expected to be significantly different between the sample groups [Citation15]. As the reported k was 480 and 525 for the human embryonic stem cell RRBS data and array-based methylation data, respectively, the selected value of K was considerably larger than the reported k, as recommended.
For RnBeads (version 1.6.1 on R 3.3.3), the parameter exploratory.region.profiles was used to consider the prefiltered 100 bp windows as input. The following additional parameters were used: filtering.high.coverage.outliers = TRUE, filtering.sex.chromosomes.removal = FALSE, filtering.coverage.threshold = 10, filtering.snp = ‘no’, differential.site.test.method = ‘limma’. RnBeads uses hierarchical linear models implemented in R package Limma to calculate p-values, which are subjected to multiple-testing correction using the false discovery rate (FDR) method.
For MethylKit (version 1.1.7), its built-in function of tiling window analysis was used for the initial window-wise analysis with win.size = 100 and step.size = 100. Bases having read coverage below ten and bases with more than 99.9th percentile of coverage in each sample were removed as a default procedure during the MethylKit run. The window-wise results were then further filtered to cover the same regions that were used as input for the other methods. MethylKit uses logistic regression to calculate p-values and sliding linear model method [Citation23] to adjust the p-values to q-values.
Regions with an FDR below 0.05 and a methylation change larger than 15% between the groups were considered as significantly differentially methylated regions (DMRs). DMRs were ranked based on the p-values calculated using the respective statistical test implemented in each of the tested tools.
Differential methylation analysis of the array-based data
Differential methylation analysis of the array-based DNA methylation data was performed using ROTS (version 1.5.4 on R 3.3.3) and Limma (version 3.32.5). The beta values were further transformed into so called M-values (), as suggested previously [Citation24]. For ROTS, the number of bootstraps was set to B = 1000 and the maximum number of top-ranked features for reproducibility optimization to K = 10,000. The differentially methylated probes were ranked based on the p-values calculated using the respective statistical test implemented in the tested tools.
Results
Simulated data
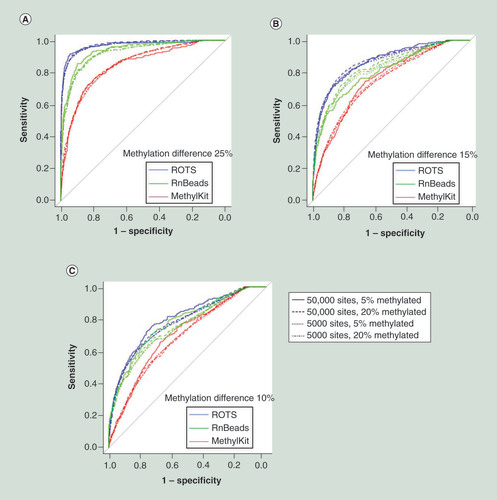
We first evaluated the performance of ROTS on simulated DNA methylation sequencing data, produced similarly as in a previous simulation study [Citation14] and compared it with two popular tools, MethylKit [Citation9] and RnBeads [Citation10]. The simulated datasets consisted of five samples in case and control groups across either 5000 or 50,000 sites, of which five or 20% were known to have a methylation change of 10, 15 or 25%.
As expected, the larger the methylation changes, the better all the methods performed. The receiver operating characteristic curves showed that ROTS confidently assigned DMRs with higher sensitivity and specificity than both RnBeads and MethylKit; in 11 out of 12 simulation scenarios, the differences were statistically significant (; DeLong’s test p < 0.05, Supplementary Table 1).
ROC curves of ROTS, RnBeads and MethylKit were determined in simulated datasets consisting of five samples in case and control groups across either 5000 or 50,000 sites, of which five or 20% were known to have a methylation change of (A) 25, (B) 15 or (C) 10%. With each method, the differentially methylated regions were ranked on the basis of their p-value.
ROC: Receiver operating characteristic; ROTS: Reproducibility-optimized test statistic.
Human embryonic stem cell RRBS data
Next, we used ROTS to reanalyze the previously published RRBS dataset on human embryonic stem cells, consisting of six samples in the normal group and six samples in the abnormal group [Citation19]. As the majority of DMRs reported are in the range of several hundred to a few thousand bases [Citation25], we focused here on 100 bp regions, but differential methylation of single CpG cytosines was also analyzed (Supplementary Figure 1).
ROTS identified 291 DMRs between the normal and abnormal groups with a FDR <0.05 and an absolute methylation change >15%. With MethylKit and RnBeads, the corresponding numbers were 6470 and 133, respectively. All DMRs detected by ROTS were also detected by MethylKit, while only 18% of the ROTS-identified DMRs were detected by RnBeads (). When looking only at the 100 top-ranked DMRs for each method, the overlap of ROTS with MethylKit decreased to 38%, while the overlap of ROTS with RnBeads remained at 18% (). All but one of the DMRs detected by RnBeads were also detected by MethylKit, with the overlap decreasing to 18% when focusing on the 100 top-ranked DMRs. Analysis of single cytosine sites showed similar performance with 365, 10,470 and 317 cytosines detected as differentially methylated by ROTS, MethylKit and RnBeads, respectively (Supplementary Figure 1).
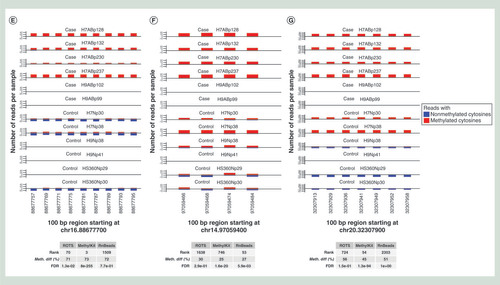
(A) Overlaps of all statistically significantly differentially methylated 100 bp regions (DMRs) detected by MethylKit, RnBeads and ROTS at false discovery rate of 0.05. (B) Overlaps of 100 top-ranked DMRs detected by MethylKit, RnBeads and ROTS. (C) Volcano plots showing the relationship between the estimated methylation change (x-axis) and its significance (y-axis). The purple dots represent DMRs with a p-value <0.05 and a methylation change >15%. (D) Heatmaps showing the 100 top-ranked DMRs identified by MethylKit, RnBeads or ROTS. The colors indicate the methylation level (methylation percentage) of each DMR. Missing values are shown in white. The normal and abnormal samples are marked in blue and white, respectively. (E–G) Representative examples of highly-ranked DMRs detected by (E) ROTS and MethylKit but not by RnBeads, (F) by RnBeads but not by ROTS and (G) by MethylKit but not by ROTS or RnBeads. The six abnormal (case, six upper tracks) and six normal (control, six lower tracks) samples are shown as separate tracks. The numbers of bisulfite-converted (blue) and nonconverted (red) cytosines at CpG sites with at least ten reads coverage are shown. Similar plots for all the 100 top-ranked DMRs with each method are shown in Supplementary files 2–4.
FDR: False discovery rate; ROTS: Reproducibility-optimized test statistic.
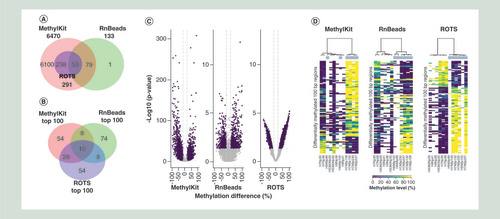
Investigation of the methylation change versus its significance suggested that the ideal ‘V’-shape of the volcano plot was more prominent with ROTS than with the other tools (). Especially with RnBeads, the relationship between the methylation change and its significance was considerably distorted. In line with this, a heatmap visualization of the 100 top-ranked DMRs with each method revealed that ROTS had the clearest separation between the sample groups (). Notably, eight out of the nine differentially methylated CpG sites validated in the original study on the basis of their MethylKit analysis [Citation19] were identified as significant at FDR <0.1 with both ROTS and MethylKit, but only one with RnBeads (Supplementary Table 2). The one site that was not detected by ROTS and MethylKit was filtered out due to its low read coverage.
To further explore the quality of the DMRs reported by the tools, we inspected the 100 top-ranked DMRs with each method in detail (–G, Supplementary Figures 2–5, Supplementary files 2–4). The median rank of the 100 top-ranked DMRs with ROTS was 343 and 154 with RnBeads and MethylKit, respectively, while the median rank of the 100 top-ranked DMRs with MethylKit was 601 and 173 with RnBeads and ROTS, respectively and with RnBeads 737 and 475 with MethylKit and ROTS, respectively.
Array-based DNA methylation data on renal cell carcinoma
After confirming the competitive performance of ROTS with the simulated DNA methylation sequencing data, we assessed its utility in array-based DNA methylation data on ccRCC. Despite the emergence of the sequencing techniques, array-based DNA methylation data still contribute a valuable source of information in the field. Here, we used DNA methylation profiles of 398 ccRCC patients provided by the TCGA to detect DMRs between metastatic and nonmetastatic patients [Citation26]. To benchmark the performance of ROTS, the analysis results were compared with those of Limma [Citation27], which is part of the currently widely used DNA methylation analysis workflows [Citation24,Citation28].
Both ROTS and Limma detected a large number of DMRs at FDR <0.05 (7581 and 9431, respectively), but overall, the methylation changes between the metastatic and nonmetastatic patients were small. Only 296 DMRs had a methylation change of at least 10% and only 24 DMRs had at least 15%; both ROTS and Limma detected all these DMRs as significant at FDR <0.05. When focusing only on 100 top-ranking DMRs with ROTS and Limma, hierarchical clustering grouped the patients into two main clusters, one cluster comprising mainly of metastatic patients and the other mainly of nonmetastatic patients (Supplementary Figure 6).
Runtime
The human embryonic stem cell RRBS dataset was used to study the differences in the runtime of the three methods. The differential methylation analyses were performed with a standard Macintosh laptop computer with a 2.9 GHz Intel Core i7 processor and 16 GB of RAM. MethylKit was the fastest method to run with the differential methylation analysis taking 3 min and 17 s. RnBeads took 5 min and 29 s to run while ROTS’ runtime was 9 min 58 s. Although ROTS was the slowest method to run, it should be noted that the preprocessing of sequencing data (including alignment to the reference genome and extraction of the methylation values) is a much more time-consuming and computationally demanding step in the overall analysis than the differential methylation analysis where the differences in runtime between the methods are relatively small.
Discussion
Here, we have studied the suitability of ROTS to differential methylation analysis using simulated and real data and have compared its performance with that of widely-used differential methylation analysis tools. Our results show that ROTS works well with different types of methylation data and they support the conclusion that ROTS is able to robustly identify DMRs between conditions.
In the differential methylation analysis of the RRBS data, MethylKit identified a considerably higher number of DMRs than either ROTS or RnBeads (). Similar behavior has been detected in a previous study, where nine methods for differential methylation analysis were compared with MethylKit identifying over 10,000 DMRs whereas most of the other methods identified 5000 or less DMRs [Citation29]. In concordance with these results, MethylKit DMR detection has been found to have high sensitivity but low specificity [Citation14].
The top 100 DMRs detected by ROTS distinctly separated the normal and abnormal samples, while the results suggest that MethylKit and RnBeads allowed more variation between the replicates compared with ROTS (). Similarly, a detailed inspection of the 100 top-ranked DMRs in each method supported that the DMRs detected by ROTS had high agreement between the biological replicates (, Supplementary File 2). These DMRs were also relatively highly ranked according to RnBeads and MethylKit (median rank 343 and 154, respectively). The top DMRs identified only by MethylKit or RnBeads, instead, tended to show considerable variation between the biological replicates (–G, Supplementary files 3–4).
In the array-based data, both ROTS and Limma reported a large number of DMRs and the differences in methylation between the nonmetastatic and metastatic patients were small. Notably, in the hierarchical clustering of the 100 top-ranking DMRs, ROTS grouped only 23% of the metastatic patients in the nonmetastatic cluster, compared with 34% with Limma. Overall, ROTS suggested a somewhat larger number of patients into the metastatic cluster than Limma (175 and 133 patients with ROTS and Limma, respectively). It should be noted that the original study had some limitations in determining the status of clinical metastasis at the time of the nephrectomy [Citation26] and, hence, some of the patients defined as nonmetastatic may actually have been metastatic or later developed metastatic disease. This can potentially explain also the relatively small methylation changes observed between the groups.
ROTS was originally designed for differential expression analysis of gene expression microarray data and it has previously been shown in an independent study to work well with RNA-sequencing data [Citation30]. The present results show that it performs well also with sequencing- and array-based methylation data. Similarly, previous comparison studies have concluded that methods designed originally for microarray data, such as Limma, are suitable also for sequencing data and often work at least as well as methods developed specifically for sequencing data [Citation31,Citation32]. Among the methods compared in this study, the differential methylation analysis in RnBeads uses Limma, while MethylKit is developed specifically for differential methylation analysis of sequencing data. Limma and ROTS are based on moderated t-statistics whereas MethylKit does not have any distributional assumptions about the normality of the data, but regardless, performs worse. Notably, ROTS p-values are not directly based on any parametric assumptions about the distribution of the data, but they are estimated by permutation.
Conclusion
Our results showed the benefits and versatility of ROTS for effective detection of DNA methylation changes between sample groups. The method is applicable to both high-throughput sequencing and array-based DNA methylation data. Thanks to its data-adaptive approach, ROTS was able to detect accurately group-specific DMRs with high consistency across replicates, as compared with state-of-the-art methods. This is crucial to ensure reproducible findings.
DNA methylation is a key epigenetic mechanism that has been shown to play a role in common diseases like cancer and diabetes.
Accurate detection of differentially methylated regions is still a major challenge in DNA methylation analysis.
There is a need for a robust tool that reliably detects significantly differentially methylated regions between sample groups.
Reproducibility-optimized test statistic (ROTS) is a data-adaptive approach that has previously been shown to yield reliable results in several gene and protein expression studies.
We demonstrated the applicability of ROTS to differential methylation analysis using both simulated and real data sets.
ROTS showed good performance with sequencing- as well as array-based methylation data.
Compared to popular methylation analysis methods ROTS accurately identified differentially methylated regions with high consistency across replicates.
We believe that ROTS will provide researchers an accurate, reliable and easy-to-use tool for differential methylation analysis.
ROTS is implemented as an R package and freely available through Bioconductor (www.bioconductor.org).
Supplemental document 1
Download PDF (4 MB)Supplemental document 2
Download PDF (3 MB)Supplemental document 3
Download PDF (3 MB)Supplemental document 4
Download PDF (3.2 MB)Acknowledgments
The authors thank the Elo lab for fruitful discussions and comments on the manuscript.
Supplementary data
To view the supplementary data that accompany this paper please visit the journal website at: www.tandfonline.com/doi/suppl/10.2217/epi-2019-0289
Financial & competing interests disclosure
This work was supported by the European Research Council ERC (grant number 677943), European Union’s Horizon 2020 research and innovation program (grant number 675395), Academy of Finland (grant numbers 296801, 304995, 310561, 313343 and 329278), Juvenile Diabetes Research Foundation JDRF (grant number 2-2013-32), Business Finland (grant number 1877/31/2016) and Sigrid Juselius Foundation. Turku Graduate School (UTUGS) also supported this work. Our research is also supported by University of Turku, Åbo Akademi University, Biocenter Finland and ELIXIR Finland node. The authors have no other relevant affiliations or financial involvement with any organization or entity with a financial interest in or financial conflict with the subject matter or materials discussed in the manuscript apart from those disclosed.
No writing assistance was utilized in the production of this manuscript.
Data sharing statement
ROTS is freely available through Bioconductor (https://www.bioconductor.org). The human embryonic stem cell RRBS data were downloaded from BioProject under the accession number PRJNA310646 and the array-based DNA methylation data from TCGA database under the project name TCGA-KIRC.
References
- Klutstein M , NejmanD , GreenfieldR , CedarH. DNA methylation in cancer and aging. Cancer Res.76(12), 3446–3450 (2016).
- Joo JE , DowtyJG , MilneRLet al. Heritable DNA methylation marks associated with susceptibility to breast cancer. Nat. Commun.9(1), 867 (2018).
- Paul DS , TeschendorffAE , DangMAet al. Increased DNA methylation variability in type 1 diabetes across three immune effector cell types. Nat. Commun.7, 13555 (2016).
- Rönn T , LingC. DNA methylation as a diagnostic and therapeutic target in the battle against Type 2 diabetes. Epigenomics7(3), 451–460 (2015).
- Kurdyukov S , BullockM. DNA methylation analysis: choosing the right method. Biology (Basel)5(1), 3 (2016).
- Zhou W , LairdPW , ShenH. Comprehensive characterization, annotation and innovative use of Infinium DNA methylation BeadChip probes. Nucleic Acids Res.45(4), e22 (2017).
- Gu H , SmithZD , BockC , BoyleP , GnirkeA , MeissnerA. Preparation of reduced representation bisulfite sequencing libraries for genome-scale DNA methylation profiling. Nat. Protoc.6(4), 468–481 (2011).
- Meissner A , GnirkeA , BellGW , RamsahoyeB , LanderES , JaenischR. Reduced representation bisulfite sequencing for comparative high-resolution DNA methylation analysis. Nucleic Acids Res.33(18), 5868–5877 (2005).
- Akalin A , KormakssonM , LiSet al. methylKit: a comprehensive R package for the analysis of genome-wide DNA methylation profiles. Genome Biol.13(10), R87 (2012).
- Assenov Y , MüllerF , LutsikP , WalterJ , LengauerT , BockC. Comprehensive analysis of DNA methylation data with RnBeads. Nat. Methods11(11), 1138–1140 (2014).
- Stockwell PA , ChatterjeeA , RodgerEJ , MorisonIM. DMAP: differential methylation analysis package for RRBS and WGBS data. Bioinformatics30(13), 1814–1822 (2014).
- Park Y , WuH. Differential methylation analysis for BS-seq data under general experimental design. Bioinformatics32(10), 1446–1453 (2016).
- Hansen KD , LangmeadB , IrizarryRA. BSmooth: from whole genome bisulfite sequencing reads to differentially methylated regions. Genome Biol.13(10), R83 (2012).
- Wreczycka K , GosdschanA , YusufD , GrüningB , AssenovY , AkalinA. Strategies for analyzing bisulfite sequencing data. J. Biotechnol.261, 105–115 (2017).
- Suomi T , SeyednasrollahF , JaakkolaMK , FauxT , EloLL. ROTS: an R package for reproducibility-optimized statistical testing. PLoS Comput. Biol.13(5), e1005562 (2017).
- Elo LL , FilénS , LahesmaaR , AittokallioT. Reproducibility-optimized test statistic for ranking genes in microarray studies. IEEE/ACM Trans. Comput. Biol. Bioinform.5(3), 423–431 (2008).
- Jaakkola MK , SeyednasrollahF , MehmoodA , EloLL. Comparison of methods to detect differentially expressed genes between single-cell populations. Brief Bioinform.18(5), 735–743 (2017).
- Seyednasrollah F , RantanenK , JaakkolaP , EloLL. ROTS: reproducible RNA-seq biomarker detector-prognostic markers for clear cell renal cell cancer. Nucleic Acids Res.44(1), e1 (2016).
- Konki M , PasumarthyK , MalonzoMet al. Epigenetic silencing of the key antioxidant enzyme catalase in karyotypically abnormal human pluripotent stem cells. Sci. Rep.6, 22190 (2016).
- Krueger F and rewsSR. Bismark: a flexible aligner and methylation caller for bisulfite-seq applications. Bioinformatics27(11), 1571–1572 (2011).
- Langmead B , TrapnellC , PopM , SalzbergSL. Ultrafast and memory-efficient alignment of short DNA sequences to the human genome. Genome Biol.10(3), R25 (2009).
- Triche TJ , WeisenbergerDJ , VanDen Berg D , LairdPW , SiegmundKD. Low-level processing of Illumina Infinium DNA Methylation BeadArrays. Nucleic Acids Res.41(7), e90 (2013).
- Wang HQ , TuominenLK , TsaiCJ. SLIM: a sliding linear model for estimating the proportion of true null hypotheses in datasets with dependence structures. Bioinformatics27(2), 225–231 (2011).
- Maksimovic J , PhipsonB , OshlackA. A cross-package Bioconductor workflow for analysing methylation array data. F1000Res.5, 1281 (2016).
- Bock C . Analysing and interpreting DNA methylation data. Nat. Rev. Genet.13(10), 705–719 (2012).
- Network CGAR . Comprehensive molecular characterization of clear cell renal cell carcinoma. Nature499(7456), 43–49 (2013).
- Smyth GK . Linear models and empirical bayes methods for assessing differential expression in microarray experiments. Stat. Appl. Genet. Mol. Biol.3, Article3 (2004).
- Wilhelm-Benartzi CS , KoestlerDC , KaragasMRet al. Review of processing and analysis methods for DNA methylation array data. Br. J. Cancer109(6), 1394–1402 (2013).
- Klein HU , HebestreitK. An evaluation of methods to test predefined genomic regions for differential methylation in bisulfite sequencing data. Brief Bioinform.17(5), 796–807 (2016).
- Soneson C , RobinsonM. Bias, robustness and scalability in single-cell differential expression analysis. Nat. Methods.15(4), 255–261 (2018).
- Seyednasrollah F , LaihoA , EloLL. Comparison of software packages for detecting differential expression in RNA-seq studies. Brief Bioinform.16(1), 59–70 (2015).
- Rapaport F , KhaninR , LiangYet al. Comprehensive evaluation of differential gene expression analysis methods for RNA-seq data. Genome Biol.14, 3158 (2013).