
Abstract
Aim: To identify a panel of DNA methylation markers for the early diagnosis of colorectal cancer (CRC). Materials & methods: Using public omics data and our pyrosequencing data, we developed and validated a global methylation model and a CpG-methylation-based model for CRC screening. Results: Both of the models yielded high sensitivity and specificity for distinguishing CRC and its precursors (colorectal adenoma and colorectal laterally spreading tumor) from normal controls in eight independent datasets and our newly collected samples. More importantly, the two-CpG-based model showed high specificity in excluding inflammatory bowel diseases and other 13 cancer types. Conclusion: A diagnostic model based on two CpGs (cg09239744 and cg12587766) may be a powerful tool for CRC screening.
Colorectal cancer (CRC) is the third most commonly diagnosed type of cancer and the second cause of cancer-related deaths worldwide [Citation1]. The majority of CRC arises from precancerous lesions, such as colorectal adenoma and colorectal laterally spreading tumor (LST) [Citation2,Citation3]. Early detection of CRC and its precursors will substantially decrease the morbidity and improve patients’ prognosis [Citation4]. Currently, the most widely used screening methods for CRC are fecal occult blood test, fecal immunochemical test, imaging examinations and colonoscopy [Citation5,Citation6]. However, these methods have various limitations, resulting into low screening rates of CRC. For instance, fecal occult blood test and fecal immunochemical test have high false-positive rate despite they are simple and cheap. As for imaging examinations and colonoscopy, they are time-consuming and resource intensive. Moreover, imaging examinations have the radiation and only detect lesions over a certain size. The procedure of colonoscopy is invasive and uncomfortable, so that the compliance of most people is very poor [Citation5]. Therefore, finding effective biomarkers for the early detection of CRC, especially colorectal adenoma and LST, has a great significance for CRC prevention and control.
In human cancers, loss-of-gene function is mainly caused by genetic and epigenetic abnormity. The alteration of DNA methylation, the main epigenetic feature, occurs earlier and more frequent than genetic alteration during CRC development [Citation7,Citation8]. Recent studies have demonstrated that DNA methylation has potential to be a reliable diagnostic marker for CRC screening [Citation9–12]. Of note, two methylation tests have been applied into the clinic in the USA, namely stool-based ‘ColoSure™ test’ [Citation11] and blood-based ‘Epi proColon test’ [Citation12]. For the ColoSure test detecting methylated VIM, the sensitivity for CRC and adenoma detection range from 53 to 83% and from 50 to 84%, respectively [Citation11]. The Epi proColon test, detecting methylated SEPT9, yielded a 48.2% sensitivity and 91.5% specificity for CRC detection in a large-scale prospective study. Nevertheless, the methylated SEPT9 showed low sensitivity (11.2%) for detecting adenomas, limiting its utility in clinical practice [Citation13]. In addition, current studies on CRC screening did not considered whether their markers were tumor-specific and excludable from the possibility of other cancers.
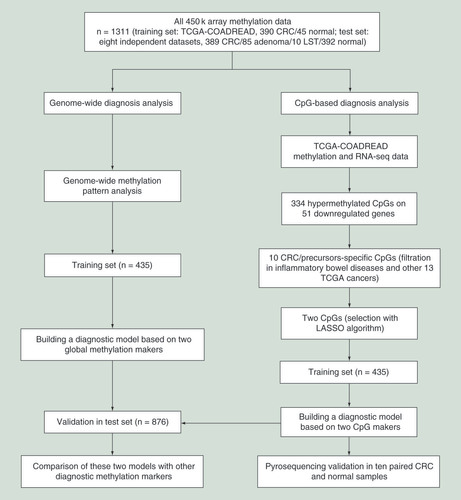
In this study, as shown in , we first identified two global methylation markers and two specific CpG markers for the diagnosis of CRC and its precursors by analyzing methylation data from three public databases: The Cancer Genome Atlas (TCGA), Gene Expression Omnibus (GEO) and ArrayExpress. Then, a global methylation model and a two-CpG-based model were constructed, and their generalization ability were tested in eight independent datasets. We further compared performance of the two models and previous methylation markers for differentiating CRC and its precursors from normal samples, inflammatory bowel diseases (i.e., Crohn diseases and ulcerative colitis) and other 13 cancer types. Moreover, the predictive value of our two CpGs were validated with pyrosequencing in ten paired CRC and adjacent normal samples. Our findings show that the two CpG markers identified in this study may be reliable indicator for the diagnosis of CRC and its precursors.
CRC: Colorectal cancer; LASSO: Least Absolute Shrinkage and Selector Operation; LST: Colorectal laterally spreading tumor; TCGA: The Cancer Genome Atlas.
Materials & methods
Public data collection & preprocessing
Methylation data (level 3) and related clinical information of 15 cancer types (Supplementary Table 1), including COAD (38 normal, 313 tumor) and READ (7 normal, 98 tumor), were retrieved from TCGA database up to January 2019. The methylation level of each CpG was expressed as a β-value, calculated as M/(M + U + 100). M and U represent fully methylated and unmethylated signal intensities, respectively. Meanwhile, gene expression data (level 3, Illumina HiSeq_RNASeq Version 2 platform) and related clinical information of COAD (41 normal, 478 tumor) and READ (10 normal, 166 tumor) samples were downloaded from TCGA data portal. Raw count or log2 (normalized count + 1) was used as gene expression level. Only the data of patients without neoadjuvant chemotherapy were included in this study. Moreover, we conducted principal component analysis to detect outliers and then removed all samples with a distance greater than 4.0 with the first two principal components. Without adjustment, TCGA-COADREAD dataset was generated by merging samples from TCGA-COAD dataset and TCGA-READ dataset since principal component analysis and unsupervised hierarchical clustering showed no significant differences (Supplementary Figure 1). Methylation data of TCGA-COADREAD dataset were used as training set in this study. Test set is composed of eight independent methylation datasets downloaded from GEO database (accession numbers: GSE42752, GSE48684, GSE68060, GSE77718, GSE77954, GSE101764 and GSE106556) and ArrayExpress database (accession number: E-MTAB-6450). After removing ineligible samples, methylation data of training and test sets are listed in . In addition, another two methylation datasets were downloaded from the GEO and ArrayExpress, including GSE32146 (ten normal, ten Crohn diseases, five ulcerative colitis) and E-MTAB-5463 (33 normal, 39 Crohn diseases, 39 ulcerative colitis).
Table 1. Characteristics of training and test sets used in this study.
All methylation datasets are based on Illumina HumanMethylation450 Array platform. Human reference genome (GRCh37) was used for the genomic coordinates of the CpGs. We excluded the CpG probes with more than 10% missing values and imputation of the remaining missing values were performed by K-nearest neighbor approach implemented in R ‘impute’ package. Next, we removed the CpG probes with detection p-value >0.01, containing SNPs or multihit probes [Citation14], as well as probes located in chromosome X and Y. Then, normalization and batch effect correction of methylation data were performed using the β-Mixture Quantile dilation method [Citation15] and surrogate variable analysis [Citation16], respectively.
Genome-wide methylation pattern analysis
To investigate the global methylation alterations of CRC and its precursors (colorectal adenoma and LST), we employed a quantile-based z-scores method proposed by Zheng et al. [Citation17] to define CpG island methylator phenotype (CIMP, z-score >2.5) and genome-wide DNA hypomethylation (GDH, z-score <-2.5). Next, we analyzed the proportion of CIMP and GDH in CRC, adenoma, LST and normal colorectal samples in all datasets of training and test sets.
Building & evaluating a global methylation model
Using logistic regression method, we constructed a diagnostic model based on above-mentioned two global methylation markers (i.e., CIMP and GDH) in training set. Receiver operating characteristic (ROC) analyses were performed to assess the performance of the global methylation classifier in training and test sets. Meanwhile, sensitivity and specificity were calculated using an optimized cutoff value with a maximum Youden’s index.
Differential analyses of methylation & gene expression data, as well as correlation analysis between promoter methylation & gene expression
Through R ‘ChAMP’ package, differential methylation analyses were performed using 390 CRC and 45 normal samples as well as the 45 paired CRC and adjacent normal samples from methylation data of TCGA-COADREAD dataset. Then, common differentially methylated (DM) CpGs were identified by overlapping CpGs of these two comparisons with same threshold criteria of Benjamini–Hochberg-adjusted p-value <0.05 and |differential β-value| >0.2. Similarly, comparisons between 610 CRC and 50 normal samples as well as 48 paired CRC and adjacent normal samples from gene expression data of TCGA-COADREAD dataset were performed using R ‘edgeR’ package. Differentially expressed (DE) genes were defined as the overlapping genes with Benjamini–Hochberg-adjusted p-value <0.05 and |log2 (fold change)| >1. Additionally, we calculated Spearman correlation coefficients between the methylation levels of each promoter CpG and the expression level of corresponding gene in 385 CRC samples with matched methylation and gene expression data from TCGA-COADREAD dataset.
Selection of candidate CpG sites
A three-step screening process was designed to identify candidate CpGs. First, through overlap between hypermethylated genes (the genes with at least one promoter hypermethylated CpG), downregulated genes and the 1217 known tumor-suppressor genes (TSGs) [Citation18], we identified hypermethylated CpGs located in the promoter of downregulated TSGs in CRC. Second, we excluded the CpGs whose median methylation levels were higher than 0.12 (approximately the median of these hypermethylated CpGs in normal colorectal samples) in inflammatory bowel diseases of GSE32146 and E-MTAB-5463, and tumor or normal samples of the remaining 13 TCGA cancer types. At last, Least Absolute Shrinkage and Selector Operation (LASSO) algorithm implemented in R ‘glmnet’ package was performed to further narrow the remaining CpGs in 45 paired CRC and normal samples of training set and five-fold cross-validation was used to determine the tuning parameter (λ). In order to avoid overfitting, we adopted 1-standard error (SE) criteria to select the largest value of λ where the partial likelihood deviance was within one SE of the smallest value of partial likelihood deviance.
Building & evaluating a CpG-methylation-based model
Using the logistic regression method, a diagnostic model based on the candidate CpGs was constructed in training set. Then, we comprehensively evaluated the diagnostic ability of the CpG-methylation-based model for CRC and its precursors. First, ROC analyses were performed to assess the predictability of this model in test set. Sensitivity and specificity were calculated using an optimized cutoff value with a maximum Youden’s index. Second, we analyzed the relationship between diagnostic score of the CpG-methylation-based model and clinical characteristics of CRC patients in training set, including age, gender, tumor location and tumor stage of American Joint Commission on Cancer, seventh edition. Finally, we compared performance of our methylation markers with other known methylation markers.
Patient recruitment & sample collection
Ten paired CRC tumor and adjacent normal tissues were collected from ten CRC patients between August 2018 to February 2019. None of the subjects received preoperative radiotherapy or chemotherapy. The histological diagnosis was conducted independently by two experienced pathologists.
Pyrosequencing
Pyrosequencing was performed to calculate the methylation levels of candidate CpG sites in ten pairs of fresh frozen CRC and normal tissues. Genomic DNA was isolated from tissues with OMEGA TISSUE DNA Kit (Omega Bio-Tek, GA, USA) according to the manufacturer’s protocol. The concentration and purity of DNA samples were analyzed using a NanoDrop2000 spectrophotometer (Thermo Scientific, MA, USA). Bisulfite conversion of DNA was performed using an EZ DNA Methylation-Gold™ Kit (Zymo Research, CA, USA) following manufacturer instructions. Then, PCR reactions were performed to amplify bisulphite-converted DNA with TaKaRa EpiTaqTM HS (Takara Bio Inc., Shiga, Japan) with the following conditions: 40 cycles of 98°C for 10 s, 55°C for 30 s and 72°C for 30 s, followed by a final elongation step of 72°C for 1 min and hold at 4°C. After that, PCR products were subjected to pyrosequencing with PyroMark Q96 (Qiagen, Hilden, Germany) following the manufacturer’s manual. All primers are shown in Supplementary Table 2.
Results
Global methylation markers for the diagnosis of CRC & its precursors
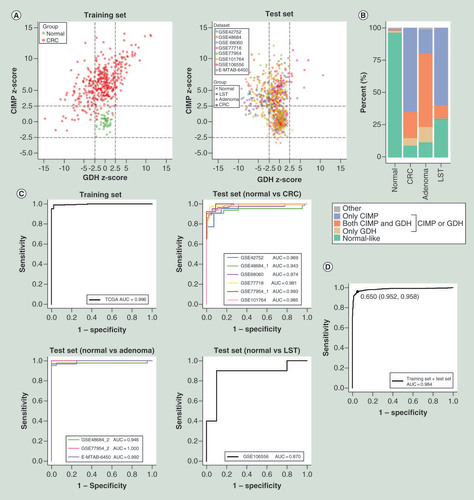
Through calculating CIMP and GDH in training and test sets (A & B), we found 90.8% (707/779) of CRC samples, 87.1% (74/85) of adenoma samples and 70% (7/10) of LST samples had CIMP or GDH. Also, 9.2% (72/779) of CRC samples, 11.8% (10/85) of adenoma samples and 30% (3/10) of LST samples were categorized as ‘Normal-Like’ phenotype (both CIMP z-score and GDH z-score between -2.5 and 2.5). In contrast, 96.3% (421/437) of normal colorectal samples were categorized as ‘Normal-Like’ phenotype, whereas only 2.7% (12/437) of normal colorectal samples had CIMP or GDH. The results indicated that CRC, adenoma and LST had similar genome-wide DNA methylation patterns, confirming that aberrant DNA methylation occurs in the early stage of CRC formation [Citation7,Citation8]. Meanwhile, these two global methylation markers (i.e., CIMP and GDH) had the potential in the differentiation between CRC/precursors and normal colorectal samples.
(A) The quantitative measurements of genome-wide methylation alterations of each sample in training and test sets. (B) The percentage of CIMP, GDH and ‘Normal-Like’ phenotype of CRC and its precursors in training and test sets. Receiver operating characteristic curves of the global methylation model in each dataset (C) and all datasets (D) of training and test sets.
AUC: Area under receiver operating characteristic curve; CIMP: CpG island methylator phenotype; CRC: Colorectal cancer; GDH: Genome-wide DNA hypomethylation; LST: Colorectal laterally spreading tumor.
Diagnostic performance of the global methylation model
Using CIMP and GDH as the covariates in logistic regression, a global methylation model was constructed in training set. ROC analyses revealed that this model had a robust performance (area under ROC curve, AUC: 0.870–1.000, mean 0.971) for differentiating CRC, adenoma and LST from normal controls in each dataset of training and test sets (C). Applying the model, a diagnostic score formula with the regression coefficients was generated: global methylation diagnostic score = -3.033 + 2.255 × z-score of CIMP + 0.917 × z-score of GDH. Additionally, we determined a fixed cutoff value of 0.650 across all datasets by performing ROC analysis in both training and test sets, yielded a sensitivity of 95.8% and specificity of 95.2% for differentiating 874 CRC/precursors from 437 normal controls (D). Using the fixed cutoff value across all datasets and an optimized cutoff value in each dataset, respectively, sensitivity and specificity in each dataset were calculated and the results highlighted that this model could accurately distinguish CRC and its precursors from normal colorectal samples ().
Table 2. Results of receiver-operating characteristic analyses of the global methylation model.
DM CpGs & DE genes, as well as correlation between promoter methylation & gene expression
Through performing differential methylation analyses using methylation data of TCGA-COADREAD dataset, we identified 17,498 hypermethylated and 21,084 hypomethylated CpGs in common (Benjamini–Hochberg-adjusted p < 0.05 and |differential β-value| >0.2). Similarly, we identified 3263 upregulated genes and 2795 downregulated genes (Benjamini–Hochberg-adjusted p-value <0.05 and |log2 [fold-change]| >1) by performing differential expression analyses using gene expression data of TCGA-COADREAD dataset. Unsupervised hierarchical clustering and heatmap of the DM CpGs and DE genes allowed for the separation of CRC samples from normal colorectal samples (Supplementary Figure 2). Further investigation showed that 54.6% of all DM CpGs were hypomethylated in CRC. Also, 94.4% of CpGs in CpG islands (CGI) were hypermethylated and 79.1% of non-CGI CpGs were hypomethylated. The proportion of hypermethylated CpGs was the highest in CGI, and the proportion declined rapidly from 94.4 to 6.7% as their distance relative to CGI increased (Supplementary Figure 3A). In the promoter regions, including TSS1500, TSS200, 5′UTR and 1stExon [Citation19], 63.0% of the CpGs were hypermethylated, obviously higher than that of gene body, 3′UTR and IGR (Supplementary Figure 3B).
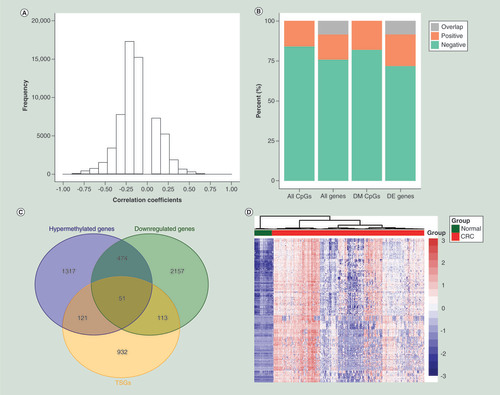
To further decipher the relationship between promoter methylation and gene expression, we performed Spearman rank correlation test in 385 CRC samples with matched methylation and expression data. As expected, overall negative correlation was observed between promoter methylation and gene expression with a Bonferroni-corrected p-value <0.05 threshold (A). When the threshold was set as Bonferroni-corrected p-value <0.05 and |correlation coefficient| >0.3, the result also confirmed that promoter methylation negatively regulated gene expression in CRC (B). Specifically, of 122,448 promoter CpGs, the methylation levels of 10,281 (1971) CpGs were significantly negatively (positively) correlated with gene expression. Of corresponding 15,713 genes with methylation and expression data, the expression levels of 3585 (1025) genes were negatively (positively) correlated with the methylation level of at least one promoter CpG. Furthermore, of 38,582 DM CpGs, methylation levels of 2187 (479) promoter CpGs were negatively (positively) correlated with gene expression. Of 6058 DE genes, the expression levels of 1092 (382) genes were negatively (positively) correlated with the methylation level of at least one promoter CpG.
Correlation between promoter methylation and gene expression when the threshold was set as Bonferroni-corrected p-value <0.05 (A) or the combination of Bonferroni-corrected p-value <0.05 and |correlation coefficient| >0.3 (B). (C) Overlap of differentially methylated genes, DE genes and the 1217 known tumor suppressor genes. (D) Unsupervised hierarchical clustering and heatmap of 334 hypermethylated CpGs in training set.
CRC: Colorectal cancer; DE: Differentially expressed.
CpG methylation markers for the diagnosis of CRC & its precursors
To obtain a panel of CpGs with high sensitivity and specificity, we first identified 334 hypermethylated CpGs located in the promoter of 51 downregulated TSGs by overlapping 1963 hypermethylated genes, 2795 downregulated genes and the 1217 known TSGs (C [Citation18]). Unsupervised hierarchical clustering and heatmap of the 334 CpGs indicated obvious discrimination between CRC samples and normal colorectal samples in training set (D). Then, a filtration procedure (see the ‘Materials & methods’ section) for the 334 CpGs was performed in Crohn diseases, ulcerative colitis, as well as another 13 TCGA cancer types, and only ten CRC/precursors-specific CpGs were retained (Supplementary Table 3 & A). Finally, we repetitively executed LASSO regression with five-fold cross-validation for the ten CpGs and identified two consistent CpGs (cg09239744 and cg12587766), corresponding to GRIN2A and LIFR, respectively (B & C). Supplementary Figure 4 showed the methylation levels of the two CpGs in CRC, adenoma, LST and normal colorectal samples in each dataset of training and test sets. Additionally, a total of 25 DM CpGs located in the promoter of GRIN2A and LIFR. All CpG sites in the promoter of GRIN2A (14/14) and 72.7% (8/11) of CpGs in LIFR promoter were hypermethylated in CRC (Supplementary Table 4), demonstrating that CpGs in close proximity tend to be comethylated [Citation20].
(A) Scatter plot of biological significance (differential β-value) versus the statistical significance (-log10[adjusted p-value]) showing the differences of ten CRC/precursors-specific CpGs between tumor and normal samples in training set. (B) Five-fold cross-validation in the LASSO logistical regression analysis for determining the tuning parameter (λ). The two dotted vertical lines are drawn at the optimal values by minimum criteria (left) and 1-SE criteria (right), respectively. (C) LASSO logistic regression coefficient profiles of the ten CpGs. A vertical line is drawn at the optimal value by one SE criteria and two CpGs (cg09239744 and cg12587766) with nonzero coefficients were obtained.
CRC: Colorectal cancer; LASSO: Least absolute shrinkage and selector operation; SE: Standard error.
![Figure 4. Identification of two candidate CpG sites. (A) Scatter plot of biological significance (differential β-value) versus the statistical significance (-log10[adjusted p-value]) showing the differences of ten CRC/precursors-specific CpGs between tumor and normal samples in training set. (B) Five-fold cross-validation in the LASSO logistical regression analysis for determining the tuning parameter (λ). The two dotted vertical lines are drawn at the optimal values by minimum criteria (left) and 1-SE criteria (right), respectively. (C) LASSO logistic regression coefficient profiles of the ten CpGs. A vertical line is drawn at the optimal value by one SE criteria and two CpGs (cg09239744 and cg12587766) with nonzero coefficients were obtained.CRC: Colorectal cancer; LASSO: Least absolute shrinkage and selector operation; SE: Standard error.](/cms/asset/c307bd29-9cbb-4198-b8f6-8576d3508f21/iepi_a_12324020_f0004.jpg)
Diagnostic performance of the two-CpG-based model
On basis of the two CpGs, we built a diagnostic model using logistic regression in training set. Accordingly, a diagnostic score formula was obtained by multiplying the coefficients estimated from this model: CpG-based diagnostic score = -1.737 + 12.306 × β-value of cg09239744 + 13.191 × β-value of cg12587766. ROC analyses showed the model had robust performance (AUC: 0.900–0.990, mean 0.961) for discriminating between CRC/precursors and normal controls in each dataset of training and test sets (A). Through performing ROC analyses in both training and test sets, we determined a fixed cutoff value of 2.517 across all datasets, yielded a sensitivity of 90.2% and specificity of 95.2% for differentiating 874 CRC/precursors from 437 normal colorectal samples (B). This model achieved a high sensitivity and specificity with the fixed cutoff value across all datasets (sensitivity: 81.3–96.9%, mean 89.0%; specificity: 81.8–100%, mean 92.3%) or an optimized cutoff value in each dataset (sensitivity: 90.0–96.9%, mean 93.2%; specificity: 75.0–100%, mean 94.1%) in training and test sets (), suggesting the model could accurately distinguish CRC/precursors from normal colorectal samples.
Receiver operating characteristic curves of the two-CpG-based model in each dataset (A) and all datasets (B) of the training and test sets.
AUC: Area under receiver operating characteristic curve; CRC: Colorectal cancer; LST: Colorectal laterally spreading tumor; TCGA: The Cancer Genome Atlas.
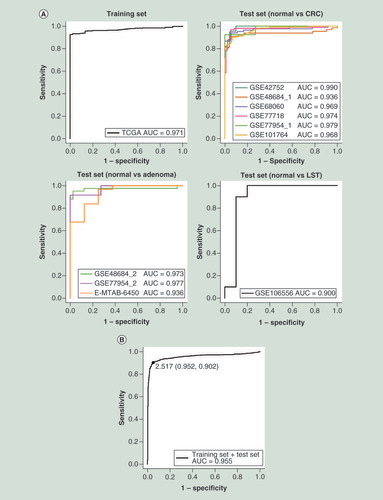
Table 3. Results of receiver operating characteristic analyses of the two-CpG-based model.
In addition, the CpG-based diagnostic scores of CRC (n = 779), adenoma (n = 85) and LST (n = 10) samples were significantly higher than that of normal colorectal samples (n = 437, p < 0.001) (Supplementary Figure 5A). Older CRC patients (age ≥60, n = 247) had substantially higher diagnostic scores compared with younger patients (age <60, n = 132, p < 0.001) (Supplementary Figure 5B). The diagnostic scores of left colon cancer samples (n = 103) were lower than that of right colon cancer samples (n = 166, p = 0.002), and slightly higher than that of rectal cancer samples (n = 91, p = 0.018) (Supplementary Figure 5C). Nevertheless, the diagnostic scores of CRC patients were not associated with gender and tumor stage (Supplementary Figure 5D & E).
Comparison of diagnostic accuracy between our two diagnostic models & other methylation markers
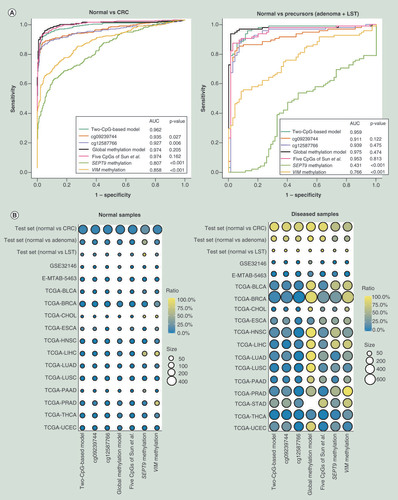
To verify whether our two-CpG-based model had superior ability to detect CRC and its precursors, we compared the diagnostic accuracy of our two diagnostic models and other known methylation markers using the same methodology. First of all, ROC analyses of different methylation markers in test set were performed and the comparison of AUC values was conducted by Z test. The results unveiled that our two-CpG-based model is comparable to the global methylation model and five CpGs of Sun et al. [Citation10], and outperformed promoter methylation of VIM [Citation11] and SEPT9 [Citation12] for distinguishing CRC and its precursors from normal samples (A). Furthermore, compared with other methylation markers, the two-CpG-based model could distinguish CRC and its precursors from inflammatory bowel diseases and other cancers more effectively (B). Specifically, when using two-CpG-based model, only a small proportion of normal samples (0–12.5%, mean 1.0%) and other diseased samples (0–18.7%, mean 6.4%) from patients with Crohn diseases, ulcerative colitis or another 12 TCGA cancer types were misdiagnosed as CRC/precursors, except for tumor tissues (38.0%) of gastric cancer. Meanwhile, the sensitivity and specificity of different methylation markers in different diseases were shown in Supplementary Table 5. It should be noted that 38.0% of gastric cancer were falsely predicted as CRC/precursors. Therefore, we need to consider the possibility of gastric cancer when the diagnostic scores without the presence of CRC/precursors are higher than the threshold. Overall, our two-CpG-based model was a better predictor for CRC screening than were the two single CpGs and other methylation markers.
(A) Receiver operating characteristic analyses of different methylation markers in test set for differentiating CRC and its precursors (colorectal adenoma and LST) from normal colorectal samples. (B) The prediction status of different methylation markers in different diseases. The color represents the percentage of different samples being predicted as CRC or its precursors. The size of each circle represents the number of samples.
AUC: Area under ROC curve; CRC: Colorectal cancer; LST: Colorectal laterally spreading tumor.
Pyrosequencing validation for the two CpG markers in CRC & matched normal tissues
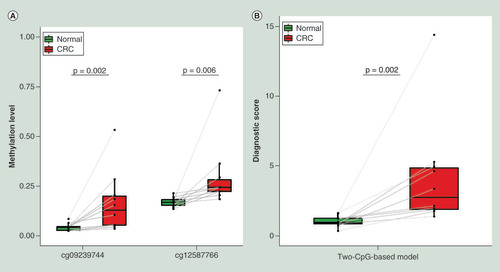
To substantiate whether the two CpGs are clinically applicable, we used pyrosequencing to quantify the methylation levels of the two CpGs in ten paired CRC and adjacent normal tissues. The representative pyrosequencing images were shown in Supplementary Figure 6. Both of the CpGs were significantly hypermethylated in CRC (p < 0.05, A). According to the formula obtained from the two-CpG-based model, the combined diagnostic scores in tumor tissues were significantly higher than that in normal tissues (p = 0.002, B). Thus, the two CpGs identified in our study are promising diagnostic markers for CRC screening.
The methylation levels (A) and the combined diagnostic scores (B) of the two CpGs in ten paired CRC and adjacent normal tissues. The difference between two groups was determined by paired Wilcoxon rank sum test.
CRC: Colorectal cancer.
Discussion
For CRC screening, the current widely used detection methods have various limitations, such as poor detection rate of precancerous lesions, time-consuming, high cost and so on, restricting their clinical utility [Citation5,Citation6]. In this study, through analyzing DNA methylation patterns of CRC, adenoma, LST and normal colorectal samples, we identified two global methylation markers, namely CIMP and GDH. Subsequently, we constructed a global methylation model based on the two markers, and the model displayed good discriminatory power between CRC/precursors and normal controls in eight independent datasets. Furthermore, using integrated analysis of promoter DNA methylation and gene expression, we identified two specific CpGs: cg09239744 and cg12587766. The performance of a diagnostic model based on the two CpGs is robust and comparable to the global methylation model. Finally, pyrosequencing, a cheap and effective methylation detection technique in clinical practice, was used to confirmed diagnostic efficacy of the two CpGs in CRC.
It is well established that aberrant promoter hypermethylation silences TSGs and GDH causes genomic instability, leading to CRC initiation and progression [Citation8,Citation21]. As expected, we observed that promoter methylation was significantly negatively correlated with gene expression in CRC. CIMP is characterized by high prevalence of promoter CpG island methylation and has been used as a molecular marker for pathological classification of CRC [Citation22]. A recent study from Zheng et al. [Citation17] suggested that CIMP and GDH were effective markers for the diagnosis of hepatocellular cancer. Likewise, we demonstrated that the combination of CIMP and GDH achieved a high diagnostic efficacy for CRC and its precursors.
Several studies have suggested that DNA methylation panels, especially CpG methylation markers, can be used to diagnose multiple cancers, including CRC [Citation9,Citation10,Citation23,Citation24], hepatocellular cancer [Citation20,Citation25], prostate cancer [Citation26], endometrial cancer [Citation27] and so on. For instance, Heiss and Brenner [Citation9] reported a panel of leukocyte DNA methylation markers and yet had a relatively poor performance for CRC diagnosis. Five CpGs identified by Sun et al. [Citation10] showed excellent diagnostic ability for CRC, with the sensitivity and specificity of 89.4% in Chinese patients. However, these markers could be nonspecific for CRC and they also did not take the precursors of CRC into account. Moreover, some methylation panels comprised a large number of markers and was lack of a diagnostic score formula, making them unfeasible in clinical practice. In the present study, we identified two CRC/precursors-specific CpGs by performing a multistep-screening strategy and then develop a logistic regression model with high sensitivity and specificity for differentiating CRC and its precursors from normal controls. The two CpGs identified in our study are located in the promoters of GRIN2A and LIFR, respectively. The expression of GRIN2A [Citation28] and LIFR [Citation29] has been demonstrated to be significantly downregulated and their promoters are hypermethylated in CRC. Likewise, our findings showed that all CpGs in the promoter of GRIN2A and 72.7% of CpGs in LIFR promoter were hypermethylated and negatively correlated with corresponding gene expression, which also substantiated the hypothesis that CpGs in close vicinity tend to be comethylated [Citation20].
To date, there are two commercial methylation markers for CRC screening in the USA, namely VIM methylation [Citation11] and SEPT9 methylation [Citation12]. Herein, we compared performance of our two methylation models and these known methylation markers, including five CpGs from Sun et al. [Citation10], VIM methylation, and SEPT9 methylation. Compared with other methylation markers, our two-CpG-based model could discriminate CRC and its precursors from not only normal samples but also Crohn diseases, ulcerative colitis and other 13 cancer types more accurately. In addition, due to comprising fewer markers, our two-CpG-based model is cheaper and easier to be measured in clinical practice. Nevertheless, some limitations of this study need to be noted. First, we did not conduct a non-invasive assessment for the two-CpG-based model, which is the key issue for the clinical application of this model. Second, the sample size of the precursors of CRC, especially LST, is small in this study and should be enlarged in next studies.
Conclusion
The present study reveals that CRC and its precursors have similar genome-wide methylation patterns, and describes a novel diagnostic model based on two CpGs (cg09239744 and cg12587766) for the diagnosis of CRC and its precursors. The performance of two-CpG-based model is superior to that of previously published methylation markers and has high specificity in excluding inflammatory bowel diseases and other cancers. Therefore, our two CpGs may be promising diagnostic markers for CRC and its precursors. The meaning of the diagnostic markers is to assist in the identification of people with high CRC risk and improve compliance of people to colonoscopy.
Future perspective
With continuous development of genome-wide technologies, DNA methylation is becoming a research hotspot in the field of cancer biomarkers. Our study suggests that two CpGs (cg09239744 and cg12587766) may serve as diagnostic markers for CRC and its precursors. It is worth noting that noninvasive assessment for the two CpGs in blood or stool is crucial for their clinical application. Therefore, our next study will focus on evaluating the diagnostic ability of the two CpGs with pyrosequencing using blood samples. To do this, some challenges need to be addressed, such as enrolling enough patients with CRC or its precursors as well as healthy individuals, extracting eligible cell-free DNA from blood, and exploring a diagnostic score formula integrating the two CpGs in blood.
Aberrant DNA methylation has been suggested to frequently occur in the early stage of colorectal cancer (CRC) formation.
Genome-wide methylation analysis demonstrated that CRC, colorectal adenoma and colorectal laterally spreading tumor had alteration of similar DNA methylation patterns.
The combination of two global methylation markers, including CpG island methylator phenotype and genome-wide DNA hypomethylation, achieved a high diagnostic efficacy for CRC and its precursors.
Promoter methylation was significantly negatively correlated with gene expression in CRC.
We successfully developed a two-CpG-based model to accurately discriminate CRC and its precursors from not only normal samples but also inflammatory bowel diseases and other cancers.
Pyrosequencing can be used to detect the methylation levels of our two CpG markers.
Author contributions
X Wu, M Feng and X Wang were responsible for the design of the study. X Wang performed the data analysis and drafted the manuscript. D Wang collected human colorectal samples and helped to analyze the data. H Zhang helped to check the data. X Wu, M Feng and H Zhang critically revised the manuscript. All the authors read and approved the final manuscript.
Ethical conduct of research
All subjects gave their informed consent for inclusion before they participated in the study. The study was conducted in accordance with the Declaration of Helsinki, and the protocol was approved by the Ethics Committee of Zhongnan Hospital of Wuhan University (approval number: 2015011).
Supplemental Information 1
Download Zip (792.5 KB)Acknowledgments
The authors thank TCGA, GEO, and ArrayExpress databases for their contribution. The authors also thank all patients who contributed samples for this study.
Supplementary data
To view the supplementary data that accompany this paper please visit the journal website at: www.tandfonline.com/doi/suppl/10.2217/epi-2019-0299
Financial & competing interests disclosure
This work was supported by National Natural Science Foundation of China (nos. 81770283 and 81473441), Health and Family Planning Commission of Hubei Province (no. WJ2017M249) and Clinical Medical Research Center of Peritoneal Cancer of Wuhan (no. 2015060911020462). The authors have no other relevant affiliations or financial involvement with any organization or entity with a financial interest in or financial conflict with the subject matter or materials discussed in the manuscript apart from those disclosed.
No writing assistance was utilized in the production of this manuscript.
Additional information
Funding
References
- Bray F , FerlayJ , SoerjomataramI , SiegelRL , TorreLA , JemalA. Global cancer statistics 2018: GLOBOCAN estimates of incidence and mortality worldwide for 36 cancers in 185 countries. CA Cancer J. Clin.68(6), 394–424 (2018).
- Zhu L , YanF , WangZet al. Genome-wide DNA methylation profiling of primary colorectal laterally spreading tumors identifies disease-specific epimutations on common pathways. Int. J. Cancer143(10), 2488–2498 (2018).
- Sakai E , OhataK , ChibaHet al. Methylation epigenotypes and genetic features in colorectal laterally spreading tumors. Int. J. Cancer135(7), 1586–1595 (2014).
- Brenner H , StockC , HoffmeisterM. Colorectal cancer screening: the time to act is now. BMC Med.13, 262 (2015).
- Issa IA , NoureddineM. Colorectal cancer screening: an updated review of the available options. World J. Gastroenterol.23(28), 5086–5096 (2017).
- Song LL , LiYM. Current noninvasive tests for colorectal cancer screening: an overview of colorectal cancer screening tests. World J. Gastrointest. Oncol.8(11), 793–800 (2016).
- Luo Y , WongCJ , KazAMet al. Differences in DNA methylation signatures reveal multiple pathways of progression from adenoma to colorectal cancer. Gastroenterology147(2), 418–429.e418 (2014).
- Schuebel KE , ChenW , CopeLet al. Comparing the DNA hypermethylome with gene mutations in human colorectal cancer. PLoS Genet.3(9), 1709–1723 (2007).
- Heiss JA , BrennerH. Epigenome-wide discovery and evaluation of leukocyte DNA methylation markers for the detection of colorectal cancer in a screening setting. Clin. Epigenet.9, 24 (2017).
- Sun X , TianY , ZhengQet al. A novel discriminating colorectal cancer model for differentiating normal and tumor tissues. Epigenomics10(11), 1463–1475 (2018).
- Ned RM , MelilloS , MarroneM. Fecal DNA testing for colorectal cancer screening: the ColoSure test. PLoS Curr.3, Rrn1220 (2011).
- Wang Y , ChenPM , LiuRB. Advance in plasma SEPT9 gene methylation assay for colorectal cancer early detection. World J. Gastrointest. Oncol.10(1), 15–22 (2018).
- Church TR , WandellM , Lofton-DayCet al. Prospective evaluation of methylated SEPT9 in plasma for detection of asymptomatic colorectal cancer. Gut63(2), 317–325 (2014).
- Zhou W , LairdPW , ShenH. Comprehensive characterization, annotation and innovative use of Infinium DNA methylation BeadChip probes. Nucleic Acids Res.45(4), e22 (2017).
- Teschendorff AE , MarabitaF , LechnerMet al. A beta-mixture quantile normalization method for correcting probe design bias in Illumina Infinium 450 k DNA methylation data. Bioinformatics (Oxford, England)29(2), 189–196 (2013).
- Leek JT , JohnsonWE , ParkerHS , JaffeAE , StoreyJD. The sva package for removing batch effects and other unwanted variation in high-throughput experiments. Bioinformatics (Oxford, England)28(6), 882–883 (2012).
- Zheng Y , HuangQ , DingZet al. Genome-wide DNA methylation analysis identifies candidate epigenetic markers and drivers of hepatocellular carcinoma. Brief Bioinform.19(1), 101–108 (2018).
- Zhao M , KimP , MitraR , ZhaoJ , ZhaoZ. TSGene 2.0: an updated literature-based knowledgebase for tumor suppressor genes. Nucleic Acids Res.44(D1), D1023–1031 (2016).
- Sandoval J , HeynH , MoranSet al. Validation of a DNA methylation microarray for 450,000 CpG sites in the human genome. Epigenetics6(6), 692–702 (2011).
- Xu RH , WeiW , KrawczykMet al. Circulating tumour DNA methylation markers for diagnosis and prognosis of hepatocellular carcinoma. Nat. Mater.16(11), 1155–1161 (2017).
- Sahnane N , MagnoliF , BernasconiBet al. Aberrant DNA methylation profiles of inherited and sporadic colorectal cancer. Clin. Epigenet.7, 131 (2015).
- Weisenberger DJ , SiegmundKD , CampanMet al. CpG island methylator phenotype underlies sporadic microsatellite instability and is tightly associated with BRAF mutation in colorectal cancer. Nat. Genet.38(7), 787–793 (2006).
- Bartak BK , KalmarA , PeterfiaBet al. Colorectal adenoma and cancer detection based on altered methylation pattern of SFRP1, SFRP2, SDC2, and PRIMA1 in plasma samples. Epigenetics12(9), 751–763 (2017).
- Naumov VA , GenerozovEV , ZaharjevskayaNBet al. Genome-scale analysis of DNA methylation in colorectal cancer using Infinium HumanMethylation450 BeadChips. Epigenetics8(9), 921–934 (2013).
- Cheng J , WeiD , JiYet al. Integrative analysis of DNA methylation and gene expression reveals hepatocellular carcinoma-specific diagnostic biomarkers. Genome Med.10(1), 42 (2018).
- Tang Y , JiangS , GuYet al. Promoter DNA methylation analysis reveals a combined diagnosis of CpG-based biomarker for prostate cancer. Oncotarget8(35), 58199–58209 (2017).
- Ying J , XuT , WangQ , YeJ , LyuJ. Exploration of DNA methylation markers for diagnosis and prognosis of patients with endometrial cancer. Epigenetics13(5), 490–504 (2018).
- Kim MS , ChangX , NagpalJKet al. The N-methyl-D-aspartate receptor type 2A is frequently methylated in human colorectal carcinoma and suppresses cell growth. Oncogene27(14), 2045–2054 (2008).
- Cho YG , ChangX , ParkISet al. Promoter methylation of leukemia inhibitory factor receptor gene in colorectal carcinoma. Int. J. Oncol.39(2), 337–344 (2011).