
Abstract
Aim: To provide a comprehensive understanding of gene regulatory networks in the developing human brain and a foundation for interpreting pathogenic deregulation. Materials & methods: We generated reference epigenomes and transcriptomes of dissected brain regions and primary neural progenitor cells (NPCs) derived from cortical and ganglionic eminence tissues of four normal human fetuses. Results: Integration of these data across developmental stages revealed a directional increase in active regulatory states, transcription factor activities and gene transcription with developmental stage. Consistent with differences in their biology, NPCs derived from cortical and ganglionic eminence regions contained common, region specific, and gestational week specific regulatory states. Conclusion: We provide a high-resolution regulatory network for NPCs from different brain regions as a comprehensive reference for future studies.
Transcription is the driver of cell differentiation and specification involving multilateral interactions between epigenetic modifications and transcription factors. While significant progress has been made in defining transcriptional programs within distinct brain cell types [Citation1-5], we still lack comprehensive knowledge of how these programs are shaped by mitotically inherited epigenetic states during brain development. Current models, based primarily on studies of the murine hematopoietic system, posit that specific histone epigenetic states are ‘primed’ in early development and subsequently engaged by the transcriptional machinery following cellular division and differentiation. In vitro models suggest that epigenetic priming and stage-specific transcription factor engagement may also occur during neuronal differentiation [Citation6], and studies on CpG methylation during in vitro differentiation and in cortical tissue during fetal brain development revealed developmental-specific methylation states in both human and mouse [Citation7-9]. An in vitrostudy on enhancer and transcriptome landscapes during early fetal cortex development using human-induced pluripotent stem cell-derived cortical organoids also revealed a major role of enhancer landscape in regulating radial glial cell growth and cortical neuron specification [Citation10].
The early fetal period, gestational week 8 (GW8) to mid-gestation (GW18), is a critical period in neocortex development involving extensive neurogenesis and cellular migration [Citation11]. This period is transcriptionally dynamic within and across different brain regions [Citation5,Citation12], and is associated with a directional loss of DNA methylation [Citation13] and dynamic changes in enhancer gene regulation with gestational week [Citation10]. However, our current understanding of the dynamic DNA methylation states associated with fetal brain development are based on reduced representation techniques that have focused on CpG-rich regions within gene promoters leaving intergenic regulatory regions largely unexplored [Citation14]. Furthermore, the spatiotemporal landscape of histone modifications during fetal brain development and their interplay with DNA methylation states remains to be defined.
Primary neural progenitor cells (NPCs) can be enriched from dissected fetal brain tissue and propagated as neurospheres in culture [Citation15]. NPCs are heterogeneous populations of progenitor cells at different stages of pluripotency, including neuroepithelial cells, radial glial cells and other intermediate progenitors. During the neurogenesis period, NPCs originating from the germinative area including ganglionic eminence (GE) migrate to the cortical layers and NPCs originating from outer cortical layers are characterized by a more differentiated neuronal phenotype compared with GE-derived NPCs [Citation16-18]. Indeed, NPCs derived from different brain regions have distinct cellular compositions based on their level of specification and differentiation [Citation19-21]. However, the regulatory and transcriptional states that drive NPC development in different brain regions during early fetal development is largely unknown.
To address these gaps, we analyzed the transcriptional and epigenetic state of brain tissue and matched NPCs from four human fetuses. From these data we construct regulatory network models for primary human NPCs and the brain regions from which they were derived at three developmental stages. Comparisons of these models revealed that NPCs derived from different fetal brain regions and at different developmental stages are defined by distinct regulatory states. NPCs derived from different brain regions retain epigenetic signatures specific to these regions that are consistent with the differentiation stages of the cells. Consistent with in vitro models NPCs derived from later developmental stages are characterized by a directional increase in active regulatory transcriptional states. Lastly, transcriptional networks derived from fetal brain-derived NPC from monozygotic (MZ) twins display distinct regulatory states as early as midgestation. Our data provide the first comprehensive mapping of the epigenomes and transcriptomes of human fetal brain cells, and a foundation for further understanding of brain development and diseases.
Material & methods
Human tissue samples & cell culture
Human brain tissues were obtained from fetuses at GW13, GW15 and GW17 after informed consent. Gestational week was calculated from the first day of the last menstrual period. Mothers and the fetuses were healthy at the time of sample acquisition. Fetuses and tissue samples were assessed at the time of sample acquisition and were deemed to be phenotypically normal. As far as we are aware, the mothers did not suffer any complications during pregnancy. Samples were identified through unlinked codes in accordance with the federal Health Insurance Portability and Accountability Act guidelines. Specific brain regions were carefully dissected based on landmark and immediately frozen in liquid nitrogen or processed for cell culture. Cortical and GE regions were clearly identified and confirmed by HE section on adjacent tissue. Cells were extracted by gentle tissue dissociation with the Neural Tissue Dissociation kit with papain (Miltenyi Biotec Inc., CA, USA) and were plated at low density in ultra-low attachment cell culture flasks (Corning, NY, USA) in neural stem cell media (STEMCELL Technologies Inc., BC, Canada) supplemented with EGF(20 ng/ml), bFGF(10 ng/ml) and heparin (2 ug/ml). Cells growing as neurospheres were fed weekly by adding fresh media and passaged every 2 weeks by gentle manual dissociation. After 2-3 passages, neurospheres were harvest and frozen in liquid nitrogen.
Whole-genome bisulphite sequencing
Genomic DNA from NPCs were extracted, bisulphite treated and sequenced as previously described [Citation22] (see also Supplemental Experimental Procedures). Sequence reads were directionally aligned to the human genome (GRCh37-lite) as described [Citation14]. Differentially methylated regions (DMRs) were identified from differential methylation analysis using a C++ tool with p<p005 [Citation23] and dynamic growth approach to concatenate adjacent differential methylated CpGs within 500 bp. Regions with less than three CpGs were filtered out. On average, DMRs are approximately 250 bp across all samples.
Methylated DNA immunoprecipitation sequencing
Methylated DNA immunoprecipitation sequencing (MeDIP-seq) was performed and fractional methylation calls extracted (see also Supplemental Experimental Procedures). Differential methylated CpGs were identified with fractional methylation call differences greater than 0.6 and hypermethylation greater than 0.75. DMRs were concatenated from differential methylation CpGs with the same dynamic growth approach used for whole-genome bisulfite sequencing (WGBS). Regions with less than four CpGs were filtered. On average, MeDIP DMRs are approximately 100 bp across all samples.
Methylation-sensitive restriction enzyme sequencing
Methylation-sensitive restriction enzyme sequencing (MRE-seq) was performed as previously described [Citation22] (see also Supplemental Experimental Procedures), and the signals were calculated for DMRs identified with WGBS for validation.
Chromatin immunoprecipitation sequencing
Chromatin immunoprecipitation sequencing (ChIP-seq) for H3K4me1, H3K4me3, H3K9me3, H3K27me3 and H3K36me3 were performed and raw reads aligned as described [Citation22]. Enriched regions were identified with FindER v0.9.3b (www.epigenomes.ca/finder.html) (see also Supplemental Experimental Procedures). Differentially marked promoters were identified by calculating ChIP-seq signals for promoter regions (TSS +/- 1.5 kb), ranking promoters for all 52418 protein-coding and noncoding genes based on their signal level. Promoters with <=5000 differences in rank in pairwise comparisons were identified as differentially marked.
RNA & miRNA sequencing
RNA-seq and miRNA-seq were performed and raw reads aligned to a custom transcriptome (build from the National Center for Biotechnology Information GRCh37-lite reference and Ensembl v65 (GenCode v10) annotations), and reads per kilobase of transcript per million reads mapped (RPKM) calculated for genes and exons (see also Supplemental Experimental Procedures). Differentially expressed genes were identified by an in-house matlab tool as previously described [Citation22] using entropy-based thresholds with false discovery rate (FDR)=0.01. Isoforms were identified by employing the same differential expression analysis on exons and exon RPKM cutoff to identify exons expressed (>10% gene RPKM) in one sample but not the other (<1%).
Single nucleotide variance identification
Single nucleotide variants (SNVs) were called using SAMtools mpileup with-C50 to reduce the effect of reads with excessive mismatches, and BCFtools with-D100 to exclude sites with read depth greater than 100 for cortex and GE NPCs from all four subjects [Citation24]. SNPs not included in dbSNP build 138 were filtered out. SNVs were compared between each of the six pairs among the four subjects to obtain discordant variants in NPCs. The overlap of the discordant variants from the two-cell types were taken as the discordant SNVs between the pair.
Transcriptional regulation analysis
GREAT (McLean et al.) and DAVID (Huang et al.) were employed to study biological processes and pathways associated with regulatory regions and genes using default parameters [Citation57,Citation61]. To study the transcription factor activities in regulatory regions, Homer was used to identify enriched transcription factors with q-value <0.01 and percent of regions with motif >20% [Citation25]. Transcription factor target genes were identified with Homer annotated transcription factor binding site (TFBS) within a genomic window encompassing the transcriptional start site(TSS) +/- 1.5kb. Transcriptional regulation network was visualized using Cytoscape [Citation26].
Results
Epigenome profiling of human fetal brain
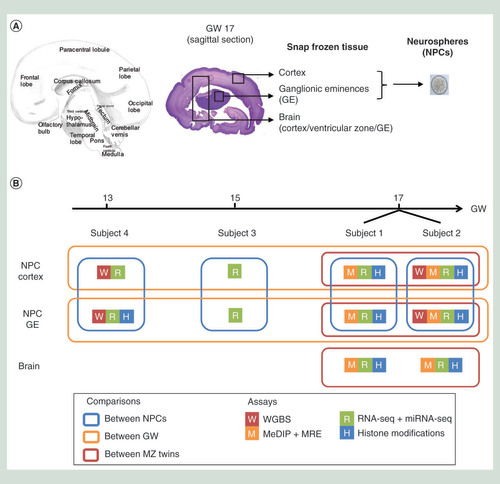
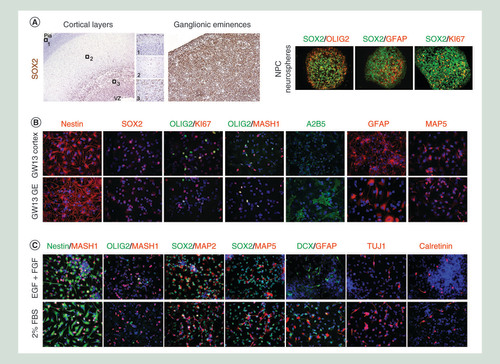
To explore the gene regulatory landscape of the developing human brain, dissected brain tissue and primary neurospheres derived from cortex and GE were obtained from four phenotypically normal human fetuses at GW13, GW15 and GW17 (). Immunohistochemistry analysis of primary neurospheres cultures showed cell-type specificity with cortex-derived neurospheres displaying an increased neuronal phenotype compared with GE-derived neurospheres ( & Supplementary Figure 1). To confirm the progenitor status of the neurosphere cultures, they were differentiated into neuroblasts (DCX+, CALRETININ+, TUJ1+) and astrocytes (GFAP+) ( & Supplementary Figure 1). Massively parallel sequencing based assays were employed to generate ChIP-seq, WGBS, MeDIP-seq, MRE-seq and mRNA-sequencing (RNA-seq) datasets from the dissected primary brain tissue and the neurospheres derived from cortex and GE following the International Human Epigenome Consortium guidelines (B & Supplementary Table 1) [Citation27]. To validate our findings, we used an independent cohort of 23 fetal brain samples ranging from GW8 to GW17 with Illumina 450K DNA methylation profiles [Citation28], and 12 of these samples were also profiled through RNA-seq (European Genome-phenome Archive Accession Number: EGAS00001003368).
(A) Human brain coronal section highlighting the section plan used during dissection to isolate specific regions as pictured by the boxed area on the hematoxylin eosin section. (B) Summary of sample information and bioinformatics analysis design. Boxes outline the pairwise comparisons, including comparisons between cortex and GE-derived NPCs (blue), across three gestational weeks (orange), and between MZ twins (red).
GE: Ganglionic eminence; GW: Gestational week; MZ: Monozygotic; NPC: Neural progenitor cell; WGBS: Whole-genome bisulfite sequencing.
(A) Cells isolated from the cortex or GE are able to proliferate when cultured as neurospheres and maintain a stem/progenitor phenotype, confirmed by the expression of SOX2 and OLIG2. (B) When grown in presence of growth factors, NPCs express a mixture of stem cell markers (NESTIN+, SOX2+, OLIG2+), glial progenitors (OLIG2+, A2B5+, MASH1-), astrocytes (GFAP+) and neuroblasts (MAP5+) with cortex-derived NPCs presenting a more neuronal phenotype (MASH1 high, MAP5 high) while the GE-derived NPCs have a more glial phenotype (A2B5 high, GFAP more differentiated). (C) In 2% serum, NPCs are differentiate into a neuronal lineage, from an immature neuroblast (MAP2+, MAP5+) to a migrating neurons (Doublecortin DCX+, TUJ1+) to a postmitotic neuron (CALRETININ+), as well as into GFAP+ astrocytes.
FBS: Fetal bovine serum; GE: Ganglionic eminence; GW: Gestational week; NPC: Neural progenitor cell.
To establish genetic relationships between twin fetuses we called SNVs from RNA-seq reads [Citation29] and performed pair-wise comparisons across subjects. On average, 11,227 discordant SNVs were identified across all pairs, except the GW17 twins for which only 1784 were found (Supplementary Figure 1 & Supplementary Table 2). Interestingly, discordant SNVs identified between the GW17 twins were homozygous in one twin and heterozygous in the other, hence can be either the result of genetic differences or the result of allele-specific expression. To distinguish these possibilities, we examined discordant SNVs using MeDIP-seq reads and found that all examined discordant sites were heterozygous across all three tissue and cell types, suggesting that the discordance observed in RNA-seq at these positions was due to allele specific expression. We concluded that the GW17 twins (referred to as Subject1 and Subject2) were genetically identical and thus MZ.
NPCs derived from different fetal brain regions & at different developmental stages are epigenetically distinct
To identify common regulatory states of NPCs, we defined enhancer regions within the genomes of cortex and GE-derived NPCs as regions marked by H3K4me1 [Citation30]. We selected H3K4me1 as it provides a broader view of both primed and active enhancer states and is used as standardized enhancer mark by the NIH Roadmap Epigenomics Mapping Consortium [Citation14]. This analysis identified 39,033 core enhancers shared across all NPCs regardless of development stage or brain region from which they were derived (Supplementary Table 3). Intersecting NPC core enhancers with TFBSs predicted by Homer [Citation25] revealed 13 transcription factors significantly enriched (q<0.01 and >20% enhancers with motif) (Supplementary Figure 2), including the master regulators of pluripotency NANOG and SOX3, as well as key regulators of brain development such as LHX3, a transcription factor involved in the specification of motor neurons and interneurons [Citation31], and OLIG2, implicated in the early stages of oligodendrocyte specification and maturation [Citation32-37]. This core set of enhancers is predicted to play a role in defining the regulatory state of NPCs within the developing fetal brain (Supplementary Figure 2).
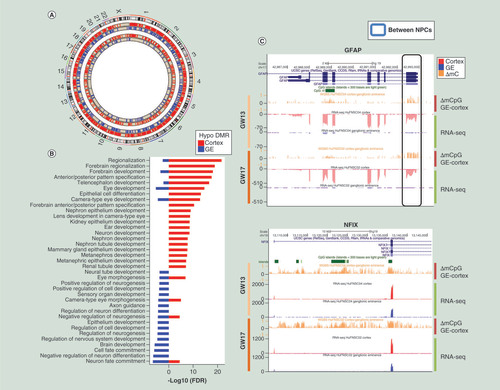
We next sought to establish whether cortical and GE tissue-derived NPCs retained distinct regulatory states following the in vitro expansion associated with their generation. We first identified DNA methylation signatures of cortex and GE NPCs derived at each developmental stage independently. We identified DMRs genome wide (see methods) between cortex and GE-derived NPCs by pairwise comparisons of WGBS datasets. DMRs were validated using MeDIP-seq and MRE-seq datasets [Citation38,Citation39] generated from matching NPCs (Supplementary Figure 3). On average, 1412 DMRs (average length 327 bp) covering 20,008 CpGs were identified between cortex and GE-derived NPCs, with 646 DMRs identified at GW13 and 2178 in GW17 suggesting increased divergence in DNA methylation with developmental age (A & Supplementary Table 4). Directionality was also observed between NPCs with 3.5-fold more DMRs hypomethylated in cortex-derived NPCs compared with GE-derived NPCs. Consistent with differences in cell migration and fates between cortex and GE-derived NPCs [Citation40], genes associated with cortex-specific hypomethylated DMRs were found to be enriched in forebrain regionalization, while those associated with GE-specific hypomethylated DMRs were enriched in neuronal migration and differentiation (B). These findings suggest that NPCs derived from distinct brain regions retain the epigenetic signatures specific to these regions.
(A) DMRs between cortex and GE-derived NPCs. More hypomethylated DMRs were identified in cortex NPCs (red) compared with GE NPCs (blue). Moreover, there were fewer DMRs found in GW13 (Subject 4, inner circles) than GW17 (Subject 2, outer circles). (B) GREAT Gene Ontology biological processes showed enrichment (region-based binomial and hypergeometric FDR <0.05) in forebrain development terms in cortex hypomethylated DMRs (red), and neuron differentiation and cell fate commitment in GE hypomethylated DMRs (blue). (C) University of California, Santa Cruz genome browser tracks of examples of key regulators that were hypomethylated in the promoters and upregulated in cortex-derived NPCs, top panel: GFAP, bottom panel: NFIX.
DMR: Differentially methylated region; FDR: False discovery rate; GE: Ganglionic eminence; NPC: Neural progenitor cell.
To examine the transcriptional output of NPCs alone and in association with regulatory states, we generated RNA-seq libraries (Supplementary Table 1). Pairwise comparisons (see methods) identified 382 cortex NPC-specific and 456 GE NPC-specific genes differentially expressed in at least two subjects (hypergeometric p <1026; Supplementary Table 5). Consistent with an increased divergence in DNA methylation with gestational week, NPCs derived from GW17 exhibited nearly twice the number of differential expressed genes as GW13 (Supplementary Figure 2). In addition, exon level differential expression analysis also identified twice as many putative gene isoforms in GW17 as in GW13, suggesting more divergent transcriptomes between cortex and GE NPCs in the later developmental age (Supplementary Figure 2). Associating differential expressed protein coding genes with H3K4me3 promoter density (TSS +/- 1.5kB; see methods; Supplementary Table 6) identified 159 differentially expressed genes with gains/losses in H3K4me3 promoter density, a majority of which (74.8%) showed expected orientation, in other words, gain of H3K4me3 with upregulation and vice versa. Gains and losses in H3K27me3 promoter density were associated with 508 differentially expressed genes with a majority (75.4%) in the expected orientation, in other words, gain of H3K27me3 with downregulation and vice versa.
Functional analysis of genes differentially expressed in both GW13 and GW17 between cortex and GE-derived NPCs revealed enrichment in genes implicated in neurogenesis and cell morphogenesis regulation (Supplementary Figure 2), including GFAP(C), an astrocyte marker associated with brain disorders including gliomas [Citation41–43]; NFIX(C), an active transcription factor essential for the development of a number of organ systems including brain [Citation44,Citation45]; FEZF1, a transcription repressor involved in the axonal projection and proper termination of olfactory sensory neurons [Citation46];OTX1 and OTX2, essential in patterning the developing brain [Citation47]; and VAX1, involved in forebrain and visual system development [Citation48].
Taken together, our analysis between cortex and GE-derived NPCs supports a model of distinct epigenetic and transcriptional states in fetal brain regions as early as GW13 that become increasingly divergent with developmental age. We also provide evidence that NPCs derived from distinct brain regions retain region of origin signatures when cultured as neurospheres.
NPCs undergo epigenetic & transcriptional activation during early development
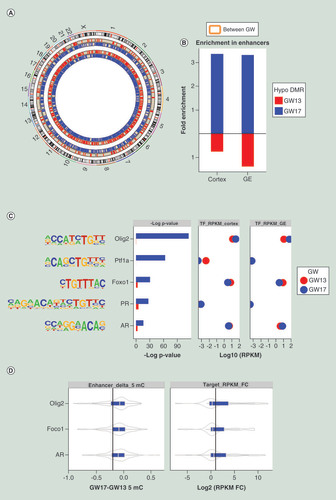
The classical view of epigenetic patterning during development posits a model whereby cellular differentiation is accompanied by epigenetic restriction [Citation49]. To explore whether evidence of such epigenetic restriction could be found within the genomes of cells separated by 4weeks of fetal brain development, hypomethylated DMRs between GW13 and GW17 were identified in cortex and GE-derived NPCs respectively (A & Supplementary Table 4). In agreement with a previously reported developmentally associated genome hypomethylation in grossly dissected human fetal brain tissue [Citation13], we observed 3.4-fold increase in the number of CpGs within hypomethylated DMRs in GW17 NPCs compared with GW13 (A). Functional enrichment analysis of genes associated with GW17 hypomethylated DMRs revealed enrichment in cell fate commitment and brain cell differentiation (Supplementary Figure 4). Consistent with the enhancer activation in early cortical development [Citation10], GW17-specific hypomethylated CpGs within DMRs were significantly enriched in core NPC enhancers (hypergeometric p < 10−26), while GW13-specific DMRs showed no such enrichment (B), suggesting that a loss of CpG methylation at active enhancers follows the establishment of histone mediated enhancer states during brain development.
(A) DMRs between GW13 and GW17. We identified more hypomethylated DMRs in GW17 (blue) than GW13 (red) in both GE-derived NPCs (inner circles) and cortex-derived NPCs (outer circles). (B) Fold enrichment of DMRs between GW13 and GW17 in core NPC enhancers. GW13 hypomethylated DMRs, shown in red, were not enriched in the enhancers, while GW17 hypomethylated DMRs, shown in blue, were enriched. (C) Transcription factors exclusively enriched (Benjamini corrected p <0.01, left panel and percent of enhancers with motif >20%) in GW17 unique enhancers, and their transcription levels in cortex-derived NPCs (middle panel) and GE-derived NPCs (right panel). GW13 expression values are shown in red, and GW17 are shown in blue. Out of the five transcription factors, OLIG2, FOXO1 and AR were expressed. (D) Methylation differences between GW17 and GW13 in enhancers with the particular transcription factor binding sites showed hypomethylation in GW17 (left panel). The vertical line, indicating hypomethylation greater than 0.2, was used as a cut-off for hypomethylated enhancers. Fold change of transcriptional levels between GW17 and GW13 for the nearest genes of the hypomethylated enhancers identified in the left panel showed upregulation in GW17 (right panel). The vertical line indicates twofold increase in expression.
DMR: Differentially methylated region; FC: Fold change; GE: Ganglionic eminence; NPC: Neural progenitor cell; RPKM: Reads per kilobase of transcript, per million mapped reads; TF: Transcription factor.
To validate this observation, we examined the DNA methylation states of fetal brain regions across developmental stages in an independent cohort generated by 450K array (Supplementary Table 1). Consistent with our observation of a directional loss of methylation with development stages, we found an increase in the number of probes that were hypomethylated in GW17 (difference in beta value >0.15) compared with those that were hypomethylated in any of the GW13 individuals (Supplementary Figure 5). Furthermore, 241 out of the 667 probes within hypomethylated regions identified by WGBS were also hypomethylated in 450K array, a 12-fold enrichment of all hypomethylated probes identified in 450K array. Genes associated with these 241 probes were also highly enriched in neurogenesis and neuron development (Supplementary Figure 5), suggesting that the 450K array data were able to validate our findings andthatWGBS provided a more comprehensivemeasurement of DNA methylation. However, only 47% of DMRs identified from WGBS are probed in 450K array and of them 66% have less than three probes within the region, leaving the majority of the enhancer landscape unmeasured.
We next explored gene promoters (TSS +/- 1.5kb) differentially marked by H3K4me3 and H3K27me3 between GW13 and GW17. H3K4me3 differentially marked the promoters of 526 protein-coding genes with 2.6-fold more genes gaining H3K4me3 in GW17 compared with GW13. We observed the opposite trend in H3K27me3 with a sixfold decrease in H3K27me3-marked gene promoters in GW17 compared with GW13 (Supplementary Table 6), consistent with a more active promoter histone modification landscape in GW17. A subset of the genes associated with the differentially marked promoters were also differentially expressed with a majority (73%) in the expected orientation and significantly enriched in genes related to neurogenesis and axonogenesis (Supplementary Figure 4).
To explore the transcription factor regulatory network of GW13 and GW17 NPCs, we overlapped gestational week specific enhancers, differentially marked by H3K4me1 between GW13 and GW17, with TFBSs and identified five transcription factors exclusively enriched in GW17 specific enhancers, three of which were expressed in both cortex and GE-derived NPCs (C). The three expressed transcription factors play important roles in brain development: OLIG2, FOXO1, involved in cell specification [Citation50]; and androgen receptors (AR), involved in sex differences in brain morphology and behavior [Citation51]. Enhancers containing these TFBSs were also enriched in hypomethylated CpGs [Citation52] at GW17 (D), and genes associated with these hypomethylated enhancers [Citation25] were transcriptional upregulated in GW17 compared with GW13 (D). The OLIG2 promoter itself was also hypomethylated and its transcript upregulated in both cortex and GE NPCs at GW17 (A & Supplementary Figure 5). Moreover, 60% of OLIG2 target genes were both hypomethylated in their promoters and upregulated (B), and were enriched (FDR <0.05) in genes implicated in neurogenesis in both cortex and GE-derived NPCs (C). Among the predicted 132 target genes, 25 were differentially expressed between GW13 and GW17, of which 22 genes were upregulated at GW17 (D). These upregulated genes were highly enriched (FDR <0.05) in genes critical for axon guidance and cell migration, including EPHA3[Citation53], NTN1 [Citation54], NTNG1 [Citation55] and SLIT2 [Citation56], reinforcing the critical role of OLIG2 in regulating the transcriptional and epigenetic programming of neurogenesis in early human development.
(A) UCSC genome browser tracks showed OLIG2hypomethylated in promoter region and upregulated in GW17. (B) Heatmap of enhancer signal level (H3K4me1) of GW17 specific enhancers with OLIG2 binding sites (left), their corresponding DNA fractional methylation (middle) and transcription levels of their nearest genes (right) showed hypomethylation of the enhancers and upregulation of the predicted target genes in GW17. (C) DAVID [Citation57] GO biological processes enrichment analysis of OLIG2 target genes indicating significant enrichment for brain development related biological processes. (D) Cytoscape network of OLIG2 target genes that are differential expressed. A total of 22 genes were upregulated in GW17 (red) while only 3 were downregulated (green). The size of the circles corresponds to the fold change of expression levels between GW17 and GW13. Among the upregulated genes, EPHA3, NTN1, NTNG1 and SLIT2 were associated with axon guidance and cell migration.
FDR: False discovery rate; GE: Ganglionic eminence; GO: Gene ontology; GW: Gestational week; mC: Methyl-cytosine; RPKM: Reads per kilobase of transcript; UCSC: University of California, Santa Cruz.
![Figure 5. Regulatory network of OLIG2- (A) UCSC genome browser tracks showed OLIG2hypomethylated in promoter region and upregulated in GW17. (B) Heatmap of enhancer signal level (H3K4me1) of GW17 specific enhancers with OLIG2 binding sites (left), their corresponding DNA fractional methylation (middle) and transcription levels of their nearest genes (right) showed hypomethylation of the enhancers and upregulation of the predicted target genes in GW17. (C) DAVID [Citation57] GO biological processes enrichment analysis of OLIG2 target genes indicating significant enrichment for brain development related biological processes. (D) Cytoscape network of OLIG2 target genes that are differential expressed. A total of 22 genes were upregulated in GW17 (red) while only 3 were downregulated (green). The size of the circles corresponds to the fold change of expression levels between GW17 and GW13. Among the upregulated genes, EPHA3, NTN1, NTNG1 and SLIT2 were associated with axon guidance and cell migration.FDR: False discovery rate; GE: Ganglionic eminence; GO: Gene ontology; GW: Gestational week; mC: Methyl-cytosine; RPKM: Reads per kilobase of transcript; UCSC: University of California, Santa Cruz.](/cms/asset/6196412f-411e-48d9-b1b9-717cdd5f487b/iepi_a_12324040_f0005.jpg)
Taken together, our analysis suggests that epigenetic and transcriptional activation, rather than restriction, is the dominant signature associated with the specification of transcriptional programs associated with early brain development.
Temporal transcriptional programs are specific for NPCs derived from different brain regions
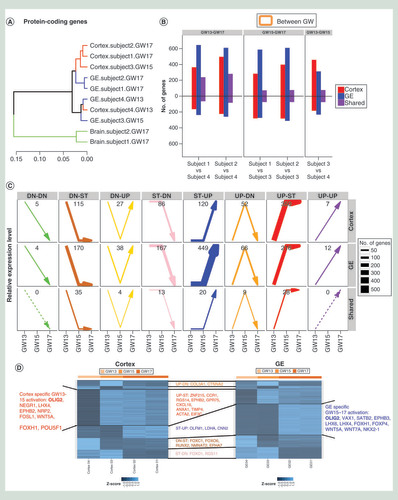
Unsupervised clustering of protein-coding gene expression showed that GW13 NPCs from different brain regions clustered together and with GW15 GE-derived NPCs, while GW15 cortex-derived NPCs clustered with GW17 cortex NPCs (A). These relationships were also observed by independent clustering of the expression of exons, noncoding genes and miRNAs (Supplementary Figure 6). It suggests that NPCs derived from different regions were transcriptionally similar at GW13 but that by GW15 region-specific signatures emerge. Differentially expressed genes between GW13, GW15 and GW17 were identified (Supplementary Table 5), and categorized into eight profile groups based on their temporal expression pattern (upregulated, downregulated and not differentially expressed) between GW13-GW15 and GW15-GW17. While overall, we observed a trend for increasingly gene expression with GW in NPCs (B), differentially expressed genes shared by both cortex and GE-derived NPCs showed no discernable pattern across gestational weeks (C). In contrast an increase in expression was observed between GW13-GW15 in cortex-derived NPCs (C). In GE-derived NPCs, a similar upregulation in gene expression was observed, however, it occurred between GW15 and GW17 (C). Several key factors in brain development followed this pattern (D), including OLIG2, as well as LHX4, a transcription factor critical for nervous system development [Citation58]; WNT5A, involved in regulating axon growth and guidance [Citation59]; and FOXH1, playing key roles in patterning of the forebrain [Citation60]. To validate our results, we investigated the expression levels of the differential expressed genes between different GW in the independent validation cohort of 12 fetal brain samples, and found that these genes were stably expressed through GW8 to GW13 but were significantly upregulated from GW13 to GW17 (t-test p < 0.01) (Supplementary Figure 5).
(A) Unsupervised clustering of expression levels of protein coding genes. NPCs derived from different regions clustered together at GW13. However, by GW15, GE-derived NPCs still clustered with GW13 NPCs, while cortex-derived NPCs branched off and clustered with GW17 cortex NPCs. (B) Number of differentially expressed genes between different gestational weeks (left panel: GW13 vs GW17, middle panel: GW15 vs GW17, right panel: GW13 vs GW15) in cortex-derived NPCs (red), GE-derived NPCs (blue) and shared by two cell populations (purple). Bars pointing up showed upregulation in the later stages, and bars pointing down showed downregulation, suggesting a general trend of upregulation in later stages. (C) Patterns of expression for genes differential expressed between gestational weeks in cortex-derived NPCs (top panel), in GE-derived NPCs (middle panel) and in genes shared by both cortex and GE-derived NPCs (bottom panel). Genes are divided into eight expression profile groups according to differential expression analysis of GW13 vs GW15 and GW15 vs GW17, represented by the arrows of eight different colors. The thickness of the line and the number in each panel corresponded to the number of genes within each category, and the dashed lines means no genes in that category. Cortex-derived NPCs showed dominant transcription activation in GW13-GW15, while GE-derived NPCs showed similar activation but in GW15-GW17. (D) Heatmap for expression values of stage-specific differential expressed genes in cortex NPCs and GE NPCs showed stage-specific expression patterns for key regulators of brain development.
DN: Downregulated; GE: Ganglionic eminence; GW: Gestational week; NPC: Neural progenitor cell; ST: Stable, not differentially expressed; UP: Upregulated.
Taken together, these analysis provide a high-resolution view of the key transcriptional and epigenetic network changes occurring during early fetal brain development and supports a model of increased transcriptional activity associated with different developmental stages in NPCs derived from different brain regions.
Epigenetic & transcriptional differences between MZ twins arise before midgestation
The genomes of MZ twins are genetically identical providing a unique opportunity to study developmental processes that give rise to epigenetic variations during normal development within the womb. To investigate epigenetic differences arising between MZ twins during fetal brain development, we analyzed DNA methylation and histone modification data from brain tissue, and cortex and GE-derived NPCs of the GW17 MZ twins. MZ twin DMRs were identified through pairwise differential methylation in each tissue and cell type respectively (see methods). In dissected brain tissue and cortex-derived NPCs, there was significant asymmetry in the orientation of these DMRs with an average of twofold more hypomethylated DMRs present in subject two compared with subject one(A & Supplementary Table 4). As all samples were processed in the same batch using standardized protocols, we considered it unlikely that the asymmetry is a result of sampling bias or technical differences (see methods). To explore the possible functional significance of these asymmetric MZ twin DMRs, we examined their relationship to protein coding genes. On average, we identified 405 DMRs (12% of total) within the promoters of protein-coding genes, a threefold enrichment compared with that expected by chance (hypergeometric p ∼ 0; Supplementary Figure 7). We associated DMRs to genes, and gene enrichment analysis of the resulting gene sets [Citation61] revealed an enrichment for Homeobox genes (FDR <10−3), many of which have been implicated in relevant biological processes such as forebrain regionalization (B & Supplementary Figure 7). Intersecting DMRs between the MZ twins from all tissue and cell populations, we found six regions consistently differentially methylated in brain tissue and both NPCs, including one region at the promoter of CCDC169(C), suggesting individual specific epigenetic signatures between MZ twins that are common across cell types as early as midgestation.
(A) Total DMR length (top panel), number of enriched bases in enhancers (middle panel) and number of differential expressed genes (bottom panel) between MZ twins. Subject1-specific hypomethylated DMRs/enhancers and upregulated genes were shown in red, and Subject2-specific ones were shown in blue. (B) DMRs between MZ twins in three tissue and cell populations from GREAT [Citation61] functional enrichment analysis all showed enrichment in Homeobox protein domains. (C) UCSC genome browser MeDIP-seq tracks showed hypermethylation in Subject2 compared with Subject1 at the promoter region of CCDC169 in dissected brain tissue as well as cortex and GE-derived NPCs. (D) DAVID [Citation57] functional enrichment analysis for genes differentially methylated in their promoters and differentially expressed between the MZ twins showed enrichment in brain developmental processes.
DE: Differential expression; DMR: Differentially methylated region; FDR: False discovery rate; GE: Ganglionic eminence; GOBP: Gene ontology – biological process; GOMF: Gene ontology – molecular function; MeDIP-seq: Methylated DNA immunoprecipitation sequencing; MZ: Monozygotic; NPC: Neural progenitor cell; UCSC: University of California, Santa Cruz.
![Figure 7. Epigenetic and transcriptional differences between monozygotic twins arise early in fetal brain development. (A) Total DMR length (top panel), number of enriched bases in enhancers (middle panel) and number of differential expressed genes (bottom panel) between MZ twins. Subject1-specific hypomethylated DMRs/enhancers and upregulated genes were shown in red, and Subject2-specific ones were shown in blue. (B) DMRs between MZ twins in three tissue and cell populations from GREAT [Citation61] functional enrichment analysis all showed enrichment in Homeobox protein domains. (C) UCSC genome browser MeDIP-seq tracks showed hypermethylation in Subject2 compared with Subject1 at the promoter region of CCDC169 in dissected brain tissue as well as cortex and GE-derived NPCs. (D) DAVID [Citation57] functional enrichment analysis for genes differentially methylated in their promoters and differentially expressed between the MZ twins showed enrichment in brain developmental processes.DE: Differential expression; DMR: Differentially methylated region; FDR: False discovery rate; GE: Ganglionic eminence; GOBP: Gene ontology – biological process; GOMF: Gene ontology – molecular function; MeDIP-seq: Methylated DNA immunoprecipitation sequencing; MZ: Monozygotic; NPC: Neural progenitor cell; UCSC: University of California, Santa Cruz.](/cms/asset/d4331ec6-1eca-4bfa-a9e8-cf57c09e8dac/iepi_a_12324040_f0007.jpg)
Gene expression analysis revealed an average of 470 differentially expressed genes in pairwise comparisons across twins in the same cell types enriched in pathways involved in neurogenesis and brain development (Supplementary Figure 7 & Supplementary Table 5). A total of 108 differentially expressed genes were also found to be differentially marked by H3K4me3 with 56% showed expected orientation; 191 by H3K27me3, 60% showed expected orientation. Genes differentially methylated in their promoters and differentially expressed were highly enriched in brain developmental processes (D), including OLIG1 and FOXO1, as well as members of WNT pathway such as SFRP1, SFRP2, WNT3 and WNT7A. The WNT signaling pathway is critical in maintaining normal neurogenesis in developing brain [Citation62] and its deregulation is important for promoting glioma cell proliferation [Citation63]. Intersecting differentially expressed genes between the MZ twins in different tissue and cell types revealed BCL6 as consistently more highly expressed in Subject2 in brain tissue and both NPCs. BCL6 has been shown to control neurogenesis through epigenetic repression of Notch target genes [Citation64].
Our findings thus suggest that epigenetic differences between MZ twins arise as early as GW17 in fetal brain tissue, and that there are individual specific signatures that are consistent across different cell types. Furthermore, these epigenetic differences are associated with differential expression of genes critical to brain development.
Discussion
Reference epigenome mapping efforts [Citation14,Citation27] have largely focused on hematopoietic and epithelial cell types, and there remains a significant gap in our understanding of difficult-to-obtain tissues and cells including those within the human brain. Our analysis provides a valuable resource of epigenomic and transcriptomic signatures and derived regulatory networks of the developing human fetal brain and comprehensive annotation of epigenetic and transcriptional differences between MZ twins, NPCs and different developmental stages in early fetal brain development.
The early fetal period (GW8–GW18) is characterized by a dynamic neurogenesis phase involving proliferation and migration of NPCs [Citation18] and significant effort has been directed at the characterization of the epigenetic and transcriptional dynamics of NPCs [Citation1,Citation4–6,Citation10,Citation65]. Neural migration patterns have not been completely deciphered in the developing human brain, but murine NPCs derived from different brain regions differentiate into neurons and glial cells that colonize distinct brain regions [Citation40,Citation66]. This cellular migration is strictly regulated, including by factors involved in cell–cell adhesion, cell cycle control and interaction with extracellular matrix [Citation67]. We compared the epigenetic states of NPCs derived from two distinct brain regions and identified DNA methylation signatures that could be functionally associated with cell migration patterns specific to these brain regions. Furthermore, tissue specific comparisons suggest that cortex-derived NPCs may be at a more epigenetically and transcriptionally active state compared with GE-derived NPCs. Taking into account temporal analysis of NPCs which suggests an increase in active epigenetic and transcription states with developmental stage, the more active epigenetic state of the cortex-derived NPCs suggests that cortex-derived NPCs are developmentally more advanced than GE-derived NPCs, consistent with the more neuronal phenotype that we observed in cortex-derived NPCs.
Targeted CpG methylation array studies have demonstrated that the genomes of human fetal brain tissue undergo DNA hypomethylation with age [Citation13], and that the bulk of temporal transcriptional changes occur at prenatal stages with the activation of critical regulators during early-mid fetal development [Citation10,Citation12]. Our analysis confirmed a developmentally associated hypomethylation between GW13–17 and extended this to show that this hypomethylation, in particular in enhancer regions, was associated with increased transcription factor binding activities of critical transcription factors, such as OLIG2. The activation of these transcription factors may lead to activation of genes critical for axon guidance and cell migration, suggesting an essential role of epigenetic regulation in increased cell migration activities during this critical developmental period. Furthermore, by comparing the transcription profiles in two distinct NPC populations, we found that the transcriptional activation occurred in waves, and at different developmental stages in NPCs derived from different brain regions. This pattern supports a model where NPCs from both brain regions share a common epigenetic state, possibly inherited from a common progenitor cell, and that cortex-derived NPCs diverged earlier and became more differentiated than GE-derived NPCs, providing additional insight into the spatiotemporal developmental trajectory within the fetal brain.
Postnatal morphological differences in the gross anatomy of the brain tissue of human MZ twins are well documented [Citation68–70]. Previous studies on postnatal MZ twins suggested that the epigenetic differences between the twins arise primarily through exposure to divergent environments [Citation71], and may contribute to phenotypical discordance in development and disease onset [Citation72–75]. However, these studies were unable to find distinct epigenetic signatures at the age of three due to technical limitations [Citation76]. Whether or when these differences arise in prenatal MZ twins and their consequences are still poorly understood. Our analysis of the epigenomes of prenatal MZ twins provides evidence of epigenetic differences as early as GW17 that are associated with the activities of master regulators of brain development such as the WNT family of proteins.
Access to normal phenotyped and cryopreserved fetal brain specimens is challenging and there is a paucity of epigenomic profiles available for comparative research. In the present study we have comprehensively profiled the epigenomic states of biospecimens derived from four normal human fetuses. To validate our observations of a gestational week associated DNA hypomethylation signature and associated induction in gene expression we analyzed an independent cohort of 23 fetal brain samples spanning from GW8 to GW17. However, we were unable to obtain additional relevant epigenomic profiles to validate predicted gestational week enhancer states and in particular our findings of significant epigenomic variation between MZ twins and between NPCs derived from different brain regions. Future studies using targeted approach in a larger cohort are needed to validate these additional findings.
Our analysis provides an unprecedented annotation of epigenetic and transcriptional states of early fetal brain development. Analysis across developmental stages supports a model of epigenetic and transcriptional activation with developmental age, and suggested that cortex-derived NPCs may be at a more advanced epigenetic state than GE-derived NPCs. Our results reveal epigenetic differences between MZ twins during early fetal periods. We provide a high-resolution regulatory network for NPCs from different brain regions, providing a comprehensive reference for future studies in brain development and disease.
Conclusion &future perspective
Our analysis of epigenomic states of normal human fetal brain regions and derived NPCs support a model of temporal epigenetic activation and the establishment of distinct epigenetic states within NPCs derived from different brain regions and across monozygotic twins. These data provide a comprehensive set of epigenomic features for further exploration of the epigenetic state changes associated with normal fetal brain development and its dysfunction in disease.
We provide a high-resolution regulatory network for neural progenitor cells (NPCs) from different brain regions.
NPCs derived from different fetal brain regions are epigenetically distinct and become increasingly divergent with developmental age.
NPCs derived from distinct brain regions retain region of origin signatures when cultured as neurospheres.
NPCs undergo epigenetic and transcriptional activation during early development.
OLIG2 plays a critical role in regulating transcriptional and epigenetic programming of neurogenesis in early human brain development.
NPCs derived from distinct brain regions acquire transcriptional activation at different developmental time points.
Epigenetic differences between monozygotic twins arise as early as GW17.
Epigenetic differences between monozygotic twins are associated with differential expression of genes critical to brain development.
Ethical conduct of research
The authors state that they have obtained appropriate institutional review board approval or have followed the principles outlined in the Declaration of Helsinki for all human experimental investigations. In addition, for investigations involving human subjects, informed consent has been obtained from the participants involved.
Supplemental Data 1
Download PDF (5.8 MB)Acknowledgments
The authors thank the production and technical staff at Canada’s Michael Smith Genome Sciences Centre for the generation of the reference epigenomes.
Supplementary data
To view the supplementary data that accompany this paper please visit the journal website at: www.tandfonline.com/doi/suppl/10.2217/epi-2019-0319
Financial & competing interest disclosure
This work was supported with funding provided by the US National Institutes of Health (NIH) Roadmap Epigenomics Program, NIH grant 5U01ES017154-02 and from Genome British Columbia and the Canadian Institutes of Health Research as part of the Canadian Epigenetics, Environment and Health Research Consortium Network (CIHR-262119). L Li is supported by a Genome Science and Technology Graduate Program Fellowship, University of British Columbia. The authors have no other relevant affiliations or financial involvement with any organization or entity with a financial interest in or financial conflict with the subject matter or materials discussed in the manuscript apart from those disclosed.
No writing assistance was utilized in the production of this manuscript.
Additional information
Funding
References
- Llorens-Bobadilla E , ZhaoS , BaserA , Saiz-CastroG , ZwadloK , Martin-VillalbaA. Single-cell transcriptomics reveals a population of dormant neural stem cells that become activated upon brain injury. Cell Stem Cell17(3), 329–340 (2015).
- Luo Y , CoskunV , LiangAet al. Single-cell transcriptome analyses reveal signals to activate dormant neural stem cells. Cell161(5), 1175–1186 (2015).
- Darmanis S , SloanSA , ZhangYet al. A survey of human brain transcriptome diversity at the single cell level. Proc. Natl Acad. Sci.112(23), 7285–7290 (2015).
- Prajapati B , FatmaM , MaddhesiyaPet al. Identification and epigenetic analysis of divergent long non-coding RNAs in multilineage differentiation of human neural progenitor cells. RNA Biol.16(1), 13–24 (2019).
- Zhu Y , SousaAMM , GaoTet al. Spatiotemporal transcriptomic divergence across human and macaque brain development. Science362(6420), (2018). 10.1126/science.aat8077
- Ziller MJ , EdriR , YaffeYet al. Dissecting neural differentiation regulatory networks through epigenetic footprinting. Nature doi:10.1038/nature13990 (2014) ( Epub ahead of print).
- Lister R , MukamelEA , NeryJRet al. Global epigenomic reconfiguration during mammalian brain development. Science341(6146), 1237905 (2013).
- Numata S , YeT , HydeTMet al. DNA methylation signatures in development and aging of the human prefrontal cortex. Am. J. Hum. Genet.90(2), 260–272 (2012).
- Siegmund KD , ConnorCM , CampanMet al. DNA methylation in the human cerebral cortex is dynamically regulated throughout the life span and involves differentiated neurons. PLoS ONE2(9), e895 (2007).
- Amiri A , CoppolaG , ScuderiSet al. Transcriptome and epigenome landscape of human cortical development modeled in organoids. Science362(6420),10.1126/science.aat6720 (2018).
- Stiles J , JerniganTL. The basics of brain development. Neuropsychol. Rev.20(4), 327–348 (2010).
- Kang HJ , KawasawaYI , ChengFet al. Spatio-temporal transcriptome of the human brain. Nature478(7370), 483–489 (2011).
- Spiers H , HannonE , SchalkwykLCet al. Methylomic trajectories across human fetal brain development. Genome Res.25(3), 338–352 (2015).
- Kundaje A , MeulemanW , ErnstJet al. Integrative analysis of 111 reference human epigenomes. Nature518(7539), 317–330 (2015).
- Reynolds BA , WeissS. Clonal and population analyses demonstrate that an EGF-responsive mammalian embryonic CNS precursor is a stem cell. Dev. Biol.175(1), 1–13 (1996).
- Lavdas AA , GrigoriouM , PachnisV , ParnavelasJG. The medial ganglionic eminence gives rise to a population of early neurons in the developing cerebral cortex. J. Neurosci.19(18), 7881–7888 (1999).
- Ulfig N . Ganglionic eminence of the human fetal brain–new vistas. Anat. Rec.267(3), 191–195 (2002).
- Florio M , HuttnerWB. Neural progenitors, neurogenesis and the evolution of the neocortex. Development141(11), 2182–2194 (2014).
- Götz M , HuttnerWB. The cell biology of neurogenesis. Nat. Rev. Mol. Cell Biol.6(10), 777–788 (2005).
- Hansen DV , LuiJH , ParkerPRL , KriegsteinAR. Neurogenic radial glia in the outer subventricular zone of human neocortex. Nature464(7288), 554–561 (2010).
- Betizeau M , CortayV , PattiDet al. Precursor diversity and complexity of lineage relationships in the outer subventricular zone of the primate. Neuron80(2), 442–457 (2013).
- Gascard P , BilenkyM , SigaroudiniaMet al. Epigenetic and transcriptional determinants of the human breast. Nat. Commun.6, 6351 (2015).
- Raineri E , DabadM , HeathS. A note on exact differences between beta distributions in genomic (methylation) studies. PLoS ONE9(5), e97349 (2014).
- Li H . A statistical framework for SNP calling, mutation discovery, association mapping and population genetical parameter estimation from sequencing data. Bioinformatics27(21), 2987–2993 (2011).
- Heinz S , BennerC , SpannNet al. Simple combinations of lineage-determining transcription factors prime cis-regulatory elements required for macrophage and B cell identities. Mol. Cell38(4), 576–589 (2010).
- Shannon P , MarkielA , OzierOet al. Cytoscape: a software environment for integrated models of biomolecular interaction networks. Genome Res.13(11), 2498–2504 (2003).
- Stunnenberg HG , HirstM. The International Human Epigenome Consortium: a blueprint for scientific collaboration and discovery. Cell167(7), 1897 (2016).
- Kleinman CL , GergesN , Papillon-CavanaghSet al. Fusion of TTYH1 with the C19MC microRNA cluster drives expression of a brain-specific DNMT3B isoform in the embryonal brain tumor ETMR. Nat. Genet.46(1), 39–44 (2014).
- Morin RD , JohnsonNA , SeversonTMet al. Somatic mutations altering EZH2 (Tyr641) in follicular and diffuse large B-cell lymphomas of germinal-center origin. Nat. Genet.42(2), 181–185 (2010).
- Heintzman ND , StuartRK , HonGet al. Distinct and predictive chromatin signatures of transcriptional promoters and enhancers in the human genome. Nat. Genet.39(3), 311–318 (2007).
- Thaler JP , LeeS-K , JurataLW , GillGN , PfaffSL. LIM factor Lhx3 contributes to the specification of motor neuron and interneuron identity through cell-type-specific protein-protein interactions. Cell110(2), 237–249 (2002).
- Lu QR , ParkJK , NollEet al. Oligodendrocyte lineage genes (OLIG) as molecular markers for human glial brain tumors. Proc. Natl Acad. Sci.98(19), 10851–10856 (2001).
- Bouvier C , BartoliC , Aguirre-CruzLet al. Shared oligodendrocyte lineage gene expression in gliomas and oligodendrocyte progenitor cells. J. Neurosurg.99(2), 344–350 (2003).
- Jakovcevski I , ZecevicN. Olig transcription factors are expressed in oligodendrocyte and neuronal cells in human fetal CNS. J. Neurosci.25(44), 10064–10073 (2005).
- Rivera FJ , Couillard-DespresS , PedreXet al. Mesenchymal stem cells instruct oligodendrogenic fate decision on adult neural stem cells. Stem Cells24(10), 2209–2219 (2006).
- Cai J , ChenY , CaiW-Het al. A crucial role for Olig2 in white matter astrocyte development. Development134(10), 1887–1899 (2007).
- Zhou Q , ChoiG , AndersonDJ. The bHLH transcription factor Olig2 promotes oligodendrocyte differentiation in collaboration with Nkx2. 2. Neuron31(5), 791–807 (2001).
- Li D , ZhangB , XingX , WangT. Combining MeDIP-seq and MRE-seq to investigate genome-wide CpG methylation. Methods72, 29–40 (2015).
- Beck S . Taking the measure of the methylome. Nat. Biotechnol.28(10), 1026–1028 (2010).
- Nadarajah B , ParnavelasJG. Modes of neuronal migration in the developing cerebral cortex. Nat. Rev. Neurosci.3(6), 423–432 (2002).
- Rutka JT , SmithSL. Transfection of human astrocytoma cells with glial fibrillary acidic protein complementary DNA: analysis of expression, proliferation, and tumorigenicity. Cancer Res.53(15), 3624–3631 (1993).
- Rodriguez D , GauthierF , BertiniEet al. Infantile Alexander disease: spectrum of GFAP mutations and genotype-phenotype correlation. Am. J. Hum. Genet.69(5), 1134–1140 (2001).
- Zhao W , BianX-W , ShiJ-Q , JiangX-F. Effects of ectopic glial fibrillary acidic protein/green fluorescent protein gene expression on cellular differentiation and proliferation of human glioma cell line. Zhonghua Bing Li Xue Za Zhi33(5), 449–453 (2004).
- Campbell CE , PiperM , PlachezCet al. The transcription factor Nfix is essential for normal brain development. BMC Dev. Biol.8, 52 (2008).
- Mason S , PiperM , GronostajskiRM , RichardsLJ. Nuclear factor one transcription factors in CNS development. Mol. Neurobiol.39(1), 10–23 (2009).
- Shimizu T , HibiM. Formation and patterning of the forebrain and olfactory system by zinc-finger genes Fezf1 and Fezf2. Dev. Growth Differ.51(3), 221–231 (2009).
- Acampora D , BaroneP , SimeoneA. Otx genes in corticogenesis and brain development. Cereb. Cortex9(6), 533–542 (1999).
- Hallonet M , HollemannT , PielerT , GrussP. Vax1, a novel homeobox-containing gene, directs development of the basal forebrain and visual system. Genes Dev.13(23), 3106–3114 (1999).
- Waddington CH . Canalization of development and the inheritance of acquired characters. Nature150, 563–565 (1942).
- Zhou J , LiH , LiXet al. The roles of Cdk5-mediated subcellular localization of FOXO1 in neuronal death. J. Neurosci.35(6), 2624–2635 (2015).
- Zuloaga DG , PutsDA , JordanCL , BreedloveSM. The role of androgen receptors in the masculinization of brain and behavior: what we’ve learned from the testicular feminization mutation. Horm. Behav.53(5), 613–626 (2008).
- Feldmann A , IvanekR , MurrR , GaidatzisD , BurgerL , SchübelerD. Transcription factor occupancy can mediate active turnover of DNA methylation at regulatory regions. PLoS Genet.9(12), e1003994 (2013).
- Egea J , KleinR. Bidirectional Eph–ephrin signaling during axon guidance. Trends Cell Biol.17(5), 230–238 (2007).
- Hamasaki T , GotoS , NishikawaS , UshioY. A role of netrin-1 in the formation of the subcortical structure striatum: repulsive action on the migration of late-born striatal neurons. J. Neurosci.21(12), 4272–4280 (2001).
- Kennedy TE . Cellular mechanisms of netrin function: long-range and short-range actions. Biochem. Cell Biol.78(5), 569–575 (2000).
- Hu H . Chemorepulsion of neuronal migration by Slit2 in the developing mammalian forebrain. Neuron23(4), 703–711 (1999).
- Huang DW , ShermanBT , LempickiRA. Systematic and integrative analysis of large gene lists using DAVID bioinformatics resources. Nat. Protoc.4(1), 44–57 (2009).
- Hunter CS , RhodesSJ. LIM-homeodomain genes in mammalian development and human disease. Mol. Biol. Rep.32(2), 67–77 (2005).
- Blakely BD , ByeCR , FernandoCVet al. Wnt5a regulates midbrain dopaminergic axon growth and guidance. PLoS ONE6(3), e18373 (2011).
- Silvestri C , NarimatsuM , Von BothIet al. Genome-wide identification of Smad/Foxh1 targets reveals a role for Foxh1 in retinoic acid regulation and forebrain development. Dev. Cell14(3), 411–423 (2008).
- Mclean CY , BristorD , HillerMet al. GREAT improves functional interpretation of cis-regulatory regions. Nat. Biotechnol.28(5), 495–501 (2010).
- Malaterre J , RamsayRG , MantamadiotisT. Wnt-Frizzled signalling and the many paths to neural development and adult brain homeostasis. Front. Biosci.12, 492–506 (2007).
- Sandberg CJ , AltschulerG , JeongJet al. Comparison of glioma stem cells to neural stem cells from the adult human brain identifies dysregulated Wnt- signaling and a fingerprint associated with clinical outcome. Exp. Cell Res.319(14), 2230–2243 (2013).
- Tiberi L , VanDen Ameele J , DimidschsteinJet al. BCL6 controls neurogenesis through Sirt1-dependent epigenetic repression of selective Notch targets. Nat. Neurosci.15(12), 1627–1635 (2012).
- Miller JA , DingS-L , SunkinSMet al. Transcriptional landscape of the prenatal human brain. Nature508(7495), 199 (2014).
- Kriegstein AR , NoctorSC. Patterns of neuronal migration in the embryonic cortex. Trends Neurosci.27(7), 392–399 (2004).
- Gressens P . Mechanisms and disturbances of neuronal migration. Pediatr. Res.48(6), 725–730 (2000).
- Biondi A , NogueiraH , DormontDet al. Are the brains of monozygotic twins similar? A three-dimensional MR study. Am. J. Neuroradiol.19(7), 1361–1367 (1998).
- Steinmetz H , HerzogA , SchlaugG , HuangY , JänckeL. Brain (A) symmetry in monozygotic twins. Cereb. Cortex5(4), 296–300 (1995).
- Cavanna AE , SteccoA , RickardsHet al. Corpus callosum abnormalities in Tourette syndrome: an MRI-DTI study of monozygotic twins. J. Neurol. Neurosurg. Psychiatry81(5), 533–535 (2010).
- Lévesque ML , CaseyKF , SzyfMet al. Genome-wide DNA methylation variability in adolescent monozygotic twins followed since birth. Epigenetics9(10), 1410–1421 (2014).
- Weksberg R , ShumanC , CaluseriuOet al. Discordant KCNQ1OT1 imprinting in sets of monozygotic twins discordant for Beckwith-Wiedemann syndrome. Hum. Mol. Genet.11(11), 1317–1325 (2002).
- Singh SM , MurphyB , O’reillyR. Epigenetic contributors to the discordance of monozygotic twins. Clin. Genet.62(2), 97–103 (2002).
- Townsend GC , RichardsL , HughesT , PinkertonS , SchwerdtW. Epigenetic influences may explain dental differences in monozygotic twin pairs. Aust. Dent. J.50(2), 95–100 (2005).
- Galetzka D , HansmannT , ElHajj Net al. Monozygotic twins discordant for constitutive BRCA1 promoter methylation, childhood cancer and secondary cancer. Epigenetics7(1), 47–54 (2012).
- Fraga MF , BallestarE , PazMFet al. Epigenetic differences arise during the lifetime of monozygotic twins. Proc. Natl Acad. Sci.102(30), 10604–10609 (2005).