
Abstract
Aim: Integrated analysis of genomics, epigenomics, transcriptomics and clinical information contributes to identify specific molecular subgroups and find novel biomarkers for pancreatic cancer. Materials & methods: The DNA copy number variation, the simple nucleotide variation, methylation and mRNA data of pancreatic cancer patients were obtained from The Cancer Genome Atlas. Four molecular subgroups (iC1, iC2, iC3 and iC4) of pancreatic cancer were identified by integrating analysis. Results: The iC1 subgroup harbors better prognosis, higher immune score, lesser DNA copy number variation mutations and better genomic stability compared with iC2, iC3 and iC4 subgroups. Three new genes (GRAP2, ICAM3 and A2ML1) correlated with prognosis were identified. Conclusion: Integrated multi-omics analysis provides fresh insight into molecular classification of pancreatic cancer, which may help discover new prognostic biomarkers and reveal the underlying mechanism of pancreatic cancer.
Pancreatic cancer is one of the deadliest diseases that still ranks fourth in the leading causes of cancer-related death in America [Citation1]. Due to the insidious onset, unspecific clinical symptoms, late diagnosis and early metastasis, most patients present with advanced stage of cancer when diagnosed and the 5-year survival rate of pancreatic cancer patients is far below 5% [Citation2,Citation3]. Minimal progress in early diagnosis and effective treatments in patients with advanced stage are made in recent years. It is of great value to identify sensitive and specific biomarkers to improve early diagnosis, treatment and prognosis of pancreatic cancer and the underlying molecular mechanisms of the occurrence and development of pancreatic cancer need further elucidation [Citation3,Citation4].
Recently, a multi-omics analysis of numerous cancers has provided a new perspective of genomics, epigenomics and transcriptomics deregulations in cancers [Citation5]. Genomic aberrances caused by the DNA copy number variation (CNV) and the simple nucleotide variation (SNV) are commonly seen during the incidence and development of pancreatic cancer [Citation6]. CNV is the main source of human genetic diversity and is widely distributed in the genome of human. Increasing amount of research shows that CNV is related with human population diversity and numerous diseases such as neuroblastoma, Type 2 diabetes and obesity [Citation7]. A previous study containing 1027 pancreatic cancer cases and 1031 controls revealed that the copy number of CNVR2966.1 at 6q13 is significantly correlated with the risk of pancreatic cancer (hazard ratio [HR]: 1.31; 95% CI: 1.08–1.60; p = 0.007) [Citation8]. Lee et al. found that the DNA copy number loss of 18q22.3 locus harboring CPGL gene deletion was uniquely associated with poor survival of pancreatic cancer [Citation9]. The whole exome sequencing of 109 pairs of normal and tumor tissues conducted by Witkiewicz et al. discovered that the gain of 8q24 locus involving MYC gene amplification was significantly correlated with poor prognosis of pancreatic cancer [Citation10]. More subsequent studies on the function of CNV in various cancers are needed to clarify the complex regulatory relationship between genomics and transcriptomics.
Besides genomic variation, various genetic factors also play an important role in the development of cancers. Recent studies show that epigenetic mechanisms including DNA methylation (MET), covalent histone modification, RNA editing and gene silencing are crucial for homeostasis of gene expression and cellular function. Epigenetic aberrations are involved in the oncogenesis and development of cancers and may serve as specific targets for cancer treatment [Citation11,Citation12]. Epigenomic dysregulations of genomics due to the aberrant DNA MET play a key regulatory role in the malignant behaviors of various cancers, such as pancreatic cancer and hepatocellular carcinoma [Citation13,Citation14]. Numerous key genes involved in the essential signaling pathways of pancreatic cancer including WNT, cell adhesion, TGF-β, activation of stellate cell and cell integrin harbor different methylation variations [Citation15]. DNA MET variations occur in the early stage of cancers such as pancreatic cancer, breast cancer and colorectal cancer. DNA MET can serve as novel biomarkers for cancer early detection [Citation16].
Although the variations of CNV or MET have massive effects on multiple cancers, respectively, the interaction between CNV and MET remains unclear. If there is a connection between CNV and MET, the role of this connection in cancer development needs further analysis. In this study, we profiled CNV, MET, RNA-Seq (mRNA) expression level and corresponding clinical information of 161 pancreatic cancer samples. Two gene datasets including CNVcor (DNA copy number correlated) genes and METcor (methylation correlated) genes were identified based on the correlation between each gene and CNV and MET. CNVcor meant the aberration of transcriptomics caused by CNVs and METcor represented the deregulation of transcriptomics resulted by DNA MET variations. Significant correlations between CNVcor and METcor genes were identified based on the correlation analysis, suggesting coregulation of transcriptomics by CNV and MET aberrations. Subsequently, we identified four molecular subgroups of pancreatic cancer that were correlated with survival by integrating analysis of CNVcor and METcor genes. Further comparative analysis between subgroups provided novel targets or biomarkers for pancreatic cancer.
Materials & methods
Download TCGA & GEO data of pancreatic cancer
CNV, DNA MET and RNA-Seq (HTSeq counts type) data were obtained for further analysis from TCGA Genomic Data Commons Data Portal (https://portal.gdc.cancer.gov/). Besides, SNV (mutect type) was also obtained. The latest clinical follow-up information was downloaded on 24 March 2019. Finally, 161 patients’ data in the above three datasets were reserved for subsequent analysis. The detailed information of 161 samples of pancreatic cancer were provided in Supplementary Table 1.
External datasets including GSE21501 and GSE71729 were downloaded from GEO website (www.ncbi.nlm.nih.gov/geo/). GSE21501 dataset contained gene expression profiling of 101 pancreatic cancer samples with corresponding clinical information. GSE71729 provided 123 pancreatic cancer samples and corresponding clinical information.
Preprocessing methods of CNV, MET, RNA-Seq & SNV data
The preprocessed methods for CNV data were listed below. Two regions containing 50% overlap were defined as the same region. Regions covered by less than five probes were removed. The GRCh38 GENCODE release 22 was used to map CNV region to its corresponding gene. Multiple CNV regions mapped to the same gene were merged into one and the final CNV value was changed to the average value of these CNV values. For MET data, MET loci that were absent in more than 70% of the samples were deleted. K-Nearest Neighbor algorithm was used to estimate the missing value. Probes in the upstream 2 kb to downstream 200 bp interval of the transcription start site region were saved and mapped to their corresponding genes by using GRCh38 GENCODE release 22. Genes with low expression level (fragments per kilobase of exon per million mapped reads [FPKM] = 0 in >50% of all samples) of RNA-Seq data were removed. SNV data were processed by removing silent mutations and mutations in the intron regions.
Identification of CNVcor (DNA copy number correlated) genes & METcor (methylation correlated) genes
The Pearson correlation coefficients (r) of each gene between CNV or MET were calculated separately and transformed into Z values based on the formula ln([1+r]/[1-r]). Genes with p-value less than 0.05 (p < 0.05) by the correlation coefficient test were selected to constitute CNVcor and METcor datasets separately. CNVcor and METcor gene data were provided in Supplementary Tables 2 and 3.
Identification of molecular subgroups by integrated analysis of CNV, MET & mRNA expression data
In order to comprehensive analysis of multi-omics data, we employed R package iCluster to cluster pancreatic cancer samples based on CNVcor genes, METcor genes and mRNA expression (EXP) data from CNVcor and METcor datasets. The lambda values of CNV, MET and EXP were calculated with 20-times iterations to get the optimal weights for each data [Citation17].
Survival analysis & immune scores calculation
The overall survival (OS) and progression-free survival (PFS) analysis were performed by using R packages ‘survival’ (https://CRAN.R-project.org/package=survival). Relative survival information was obtained from TCGA or GEO clinical data.
Tumor Immune Estimation Resource (TIMER) website was utilized to systematically analyze immunological infiltration of the subgroups of pancreatic cancer [Citation18,Citation19]. The immune scores of six types of immune cells including B, CD4+ T, CD8+ T, neutrophils, macrophages and dendritic cells were calculated. The scores of immunological signatures were also obtained for further analysis.
Results
Comparison between CNVcor & METcor gene datasets
In order to establish CNVcor and METcor genes, we calculated Pearson correlation coefficients between each gene and CNV/MET data, respectively. After that, a total of 2445 CNVcor genes and 3729 METcor genes were obtained with p < 1 × 10⁻⁵ of the correlation coefficient test. The detailed data of CNVcor and METcor gene datasets were provided in Supplementary Tables 2 and 3. From the Z-value distribution situation, we found that the correlation of CNVcor genes shifted to the right and the correlation of METcor genes shifted to left significantly (A, CNVcor skewness = 1.16, METcor skewness = -0.66; D’Agostino test: p < 1 × 10⁻⁵). The above results indicated that CNVcor genes were positively correlated with gene expression and METcor was negatively correlated with gene expression. Because of the large quantity of genes in the CNVcor and METcor datasets, we only selected genes that significantly correlated with OS in each dataset (log rank, p < 0.05). Two hundred and one CNVcor genes and 295 METcor genes were finally obtained for further analysis. There was no obvious intersection between CNVcor and METcor, since only 34 genes were overlapped, indicating absent interaction between CNVcor and METcor datasets (B). The chromosomal distribution of CNVcor genes indicated CNVcor genes were most abundant on chr12, chr8 and chr17 (C & ). METcor genes mainly distributed on chr1, chr2, chr3, chr7, chr11, chr12 and chr17, but almost no distribution on chr18 (Figure 1D, Supplementary Figure 1 & ). The main function of METcor genes was protein coding (E) and METcor genes mainly located in the CpG island region (F).
(A) The Z-values’ distribution diagram of correlations between gene expressions and CNV or MET based on the samples of pancreatic cancer, respectively. The y-axis represents density profile. Red areas show the correlation between gene expressions and copy number variation. Green areas indicate the correlation between gene expressions and DNA methylation. (B) The overlap between CNVcor genes and METcor genes visualized by the Venn diagram. Red circle stands for the CNVcor genes. Blue circle stands for the METcor genes. The percentage of overlapped genes to CNVcor and METcor genes is 16.9 and 11.5%, respectively. (C) The chromosomal distributions of CNVcor genes are presented in the top panel. The bottom panel indicates the correlations between chromosomes and CNVcor genes. The y-axis in the top panel stands for the ratio of CNVcor genes on different chromosomes. In the bottom panel, the y-axis means the correlation coefficients between CNVcor genes and corresponding chromosomes. (D) The chromosomal distributions of METcor genes. The y-axis stands for the proportion of METcor genes on different chromosomes. (E) The gene function annotation for METcor genes. The x-axis represents ratio of METcor genes separated by different functional types. (F) The distribution proportion of METcor genes locations. The x-axis means proportion of METcor genes separated by different methylated locations.
CNV: DNA copy number variation; MET: DNA methylation.
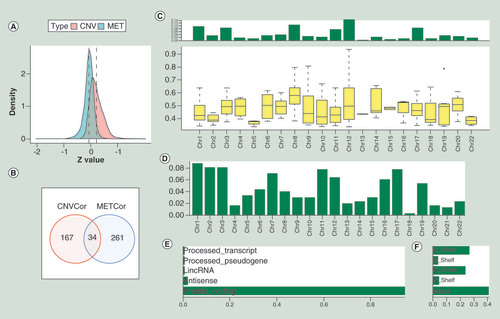
Table 1. The distribution of CNVcor genes on different chromosomes based on the Fisher test.
Table 2. The distribution of METcor genes on different chromosomes based on the Fisher test.
Identification of subtypes of CNVcor & METcor datasets
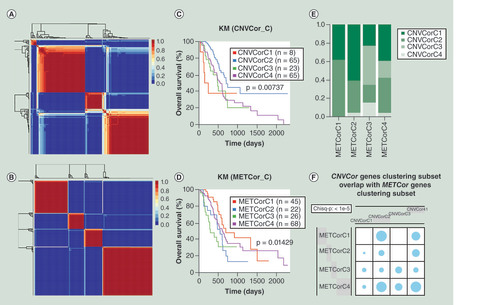
We used non-negative matrix factorization (NMF) to cluster CNVcor and METcor datasets and ‘brunet’ method of NMF was employed with 50 iterations [Citation20]. Cluster number K was set at 2–10. Due to the small sample size of the pancreatic cancer, the minimal number of each cluster was set at 5. R package NMF was used to decide the mean value of silhouette width of the unity membership matrix. The most optimal number of clusters was decided by integrated analysis of cophenetic correlation coefficient, residual sum of squares and mean value of silhouette width. The best number of clusters was both four for CNVcor (A & Supplementary Figure 2A) and METcor (B & Supplementary Figure 2B) datasets. The four subtypes of CNVcor dataset showed significantly difference in OS (C; p < 0.05) and PFS (Supplementary Figure 2C; p < 0.05). There were also significant differences in OS and PFS in the four subtypes of METcor dataset (D & Supplementary Figure 2D, p < 0.05). Significant overlaps between CNVcor subtypes and METcor subtypes were observed (E & F; Chisq-p < 1 × 10⁻⁵).
(A) Non-negative matrix factorization clustering map of CNVcor genes. (B) Non-negative matrix factorization clustering map of METcor genes. (C) Kaplan–Meier survival analysis of the four subgroups of CNVcor dataset. (D) Kaplan–Meier survival analysis of the four subgroups of METcor dataset. (E) Overlaps between subgroups of CNVcor dataset and subgroups of METcor dataset. (F) The significant test for overlaps between CNVcor and METcor subgroups. Blue circle stands for overlap between different subgroups and its size represents the proportion of overlap. Chi square test was employed for comparison.
CNV: DNA copy number variation; KM: Kaplan–Meier; MET: DNA methylation.
Identification of four subgroups based on integration of CNV, MET & EXP data
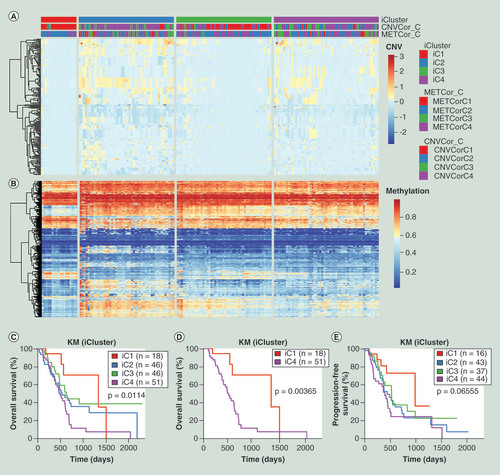
Since CNVcor and METcor datasets were both clustered into four subtypes, the value of K was set at 2 to 3. The lambda values of CNV, MET and EXP data were 0.305, 0.008 and 0.716 when K = 2, and the corresponding lambda values changed to 0.959, 0.014, 0.576 when K = 3. The cluster was repeated 20-times in order to obtain the most optimal result. After clustering, we found that K = 3 (four subgroups) was more significant in prognosis compared with K = 2 (three subgroups), so all the samples were clustered into four groups including iC1 (18 samples), iC2 (48 samples), iC3 (48 samples) and iC4 (53 samples). The results of cluster were showed in A and B, and the detailed data of four subgroups were provided in Supplementary Table 4. The OS analysis showed that there were significant differences between four subgroups (C; p < 0.05). Further OS analysis between iC1 with the best OS prognosis and the other three subgroups showed the difference between iC1 and iC4 was the most significant (D; p < 0.01). The PFS analysis between four subgroups also showed partial significant difference since the p = 0.06555 (E).
(A) Heatmap of CNVcor genes expression levels of four subgroups (iC1, iC2, iC3 and iC4) identified by iCluster. (B) Heatmap of METcor genes expression levels of four subgroups (iC1, iC2, iC3 and iC4). (C) Kaplan–Meier overall survival analysis of four subgroups (iC1, iC2, iC3 and iC4). (D) Kaplan–Meier overall survival analysis between iC1 and iC4 subgroups. (E) Kaplan–Meier progression-free survival analysis of four subgroups (iC1, iC2, iC3 and iC4).
CNV: DNA copy number variation; EXP: mRNA expression; KM: Kaplan–Meier; MET: DNA methylation.
Correlations between CNV & MET variations
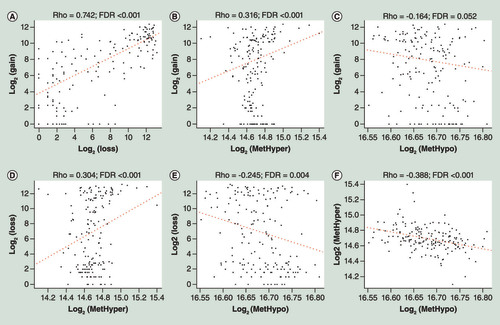
To study the relationships between CNV and MET aberrance, CNV data were defined as CNV gain (β-value > 0.3) and CNV loss (β-value < -0.3) and MET data were also divided into two groups including hypermethylation (MetHyper, β-value > 0.8) and hypomethylation (MetHypo, β-value < 0.2). The amount of CNV gain, CNV loss, MetHyper and MetHypo of each sample were recorded separately. There was significant positive correlation between CNV gain and CNV loss (A; R = 0.742; FDR <0.001). CNV gain was positively correlated with MetHyper (B; R = 0.316; FDR <0.001), but correlation between CNV gain and MetHypo was not significant (C). Correlation between CNV loss and MetHyper was also significantly positive (D; R = 0.304; FDR <0.001), however, there was no extremely significant correlation between CNV loss and MetHypo (E). MetHyper and MetHypo had a significantly negative correlation (F; R = -0.388; FDR <0.001). The detailed data were provided in Supplementary Table 5. These results indicated that there was a connection between CNV and MET aberrations.
(A) Correlation between CNV gain and CNV loss frequencies. (B) Correlation between CNV gain and MetHyper frequencies. (C) Correlation between CNV gain and MetHypo frequencies. (D) Correlation between CNV loss and MetHyper frequencies. (E) Correlation between CNV loss and MetHypo frequencies. (F) Correlation between MetHyper and MetHypo frequencies. R stands for Pearson correlation coefficient.
CNV: DNA copy number variation; FDR: False Discovery Rate.
Clinicopathological features & immune scores of pancreatic cancer subgroups
All the pancreatic cancer samples were divided into four subgroups based on the integrated multi-omics data, we further analyzed the clinicopathological information between iC1 and iC2/iC3/iC4 subgroups since iC1 subgroup owned the best prognosis. Significant differences in age and alcoholic exposure were observed between iC1 and iC2/iC3/iC4 ( & Supplementary Figure 3). Besides, iC2/iC3/iC4 subgroups with poor prognosis were more inclined to heavy smokers and advanced clinical stage (Supplementary Figure 3).
Table 3. The comparisons of clinical features between iC1 and iC2/ iC3/ iC4 subgroups.
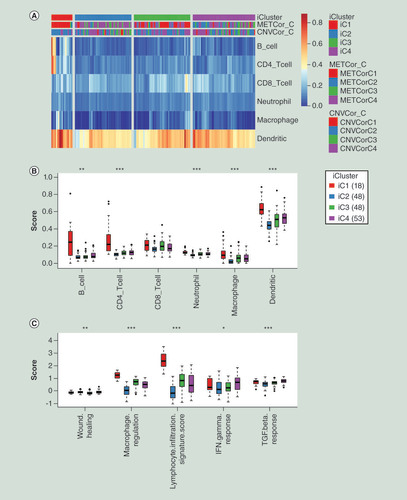
Next, we used TIMER tool to calculate the immune scores of the four individual subgroups. The immune scores of iC1 subgroup were all significantly higher than the other three subgroups in B cell, CD4 T cell, neutrophil cell, macrophage cell and dendritic cell except CD8 T cell (A–B & Supplementary Table 11). Immune signatures analysis also showed that iC1 subgroup had higher scores in the macrophage regulation, lymphocyte infiltration signature, IFN-γ response and TGF-β response compared with the other three groups (C & Supplementary Table 12). Above results indicated that iC1 subgroup might be in the state of immunological enhancement, which could contribute to the prognosis of iC1 subgroup in some degree.
(A) Heatmap of immune scores of total six kinds of immune cells among all samples. iCluster means four subgroups identified by integration of multi-omics data. (B) The comparisons of immune scores of six kind immune cells among four molecular subgroups clustered by iCluster. The Kruskal–Wallis test was employed to calculate the significant level. (C) The comparisons of scores of immune signatures among four molecular subgroups clustered by iCluster. The Kruskal–Wallis test was also used.
*p < 0.05; **p < 0.01; ***p < 0.001.
CNVCor_C: Subgroups of CNVcor genes; METCor_C: Subgroups of METcor genes.
Comparison of molecular characteristics of pancreatic cancer subgroups
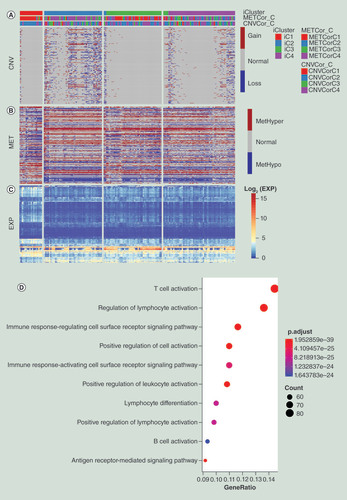
In order to analyze different molecular characteristics among the four subgroups, we calculated the differentially expressed genes (DEGs) between iC1 and iC2/iC3/iC4, respectively. We finally obtained 817 DEGs that commonly existed in the three comparisons. Gene Ontology (GO) enrichment analysis of 817 DEGs found that T-cell activation, regulation of lymphocyte activation, immune response-regulating cell surface receptor signaling pathway, positive regulation of cell activation, immune response-activating cell surface receptor signaling pathway, positive regulation of leukocyte activation, lymphocyte differentiation, positive regulation of lymphocyte activation, B-cell activation, antigen receptor-mediated signaling pathway and other immune-regulation related terms were significantly enriched (D & Supplementary Table 6). Then, CNV data of DEGs were divided into three kinds including CNV gain, CNV loss and CNV normal. MET data of DEGs were also classified into three groups including MetHyper, MetHypo and MET normal based on the previous described methods. The CNV deregulations of iC2 and iC4 were significantly higher than iC1 and iC3, suggesting that CNV might have a certain influence on the prognosis of pancreatic cancer (A & Supplementary Table 13). However, no significant differences in methylation were observed between these subgroups (B & Supplementary Table 13). From the correlation analysis between gene expressions and methylation and CNV (Supplementary Tables 2 & 3), it was found that DEGs with hypomethylation showed a high level of gene expression (C), but a similar relationship was not observed between CNV. We speculated that methylation level might have more influence on the gene expression of DEGs than CNV level based on these results.
(A) Distribution of CNV of DEGs in the iCluster subgroups. (B) Distribution of MET of DEGs in iCluster subgroups. (C) Distribution of DEGs in iCluster subgroups. The order of genes for heatmap was identical among (A–C). (D) Schematic diagram of GO enrichment analysis results.
CNV: DNA copy number variation; DEG: Differentially expressed gene; GO: Gene ontology; MET: DNA methylation.
Relationships between CNV, MET & gene expression
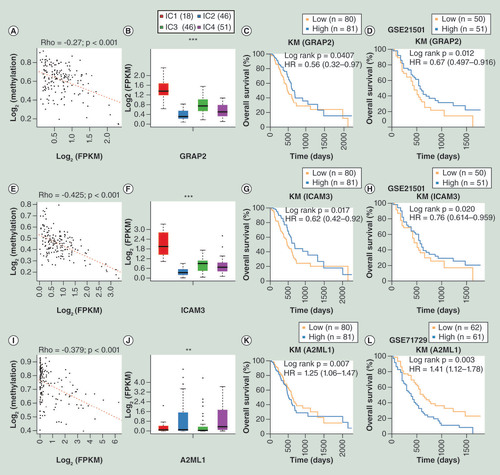
To further analyze the associations among CNV, MET and gene expression, we performed univariate survival analysis of 817 DEGs and 35 DEGs significantly associated with prognosis were identified and selected (Supplementary Table 7; log rank p < 0.05). External GSE21501 and GSE71729 datasets from GEO database were employed to verify the result. Finally, three genes (GRAP2, ICAM3 and A2ML1) related with prognosis for pancreatic cancer in both external and internal datasets were selected (Supplementary Tables 8 & 9). GRAP2 (HR <1) and ICAM3 (HR <1) were favorable prognostic factors, while A2ML1 (HR >1) was an unfavorable prognostic factor (C & D, G & H, K & L). A significantly negative correlation between gene expression and MET were all observed in the three genes (A & B, E & F, I & J), but no significant correlation was observed with CNV.
(A) Correlation between GRAP2 gene expression and MET. (B) Relative expression level of GRAP2 among subgroups clustered by iCluster. (C) OS analysis of GRAP2 based on TCGA database. (D) OS analysis of GRAP2 based on external GSE21501 dataset. (E) Correlation between ICAM3 gene expression and MET. (F) Relative expression level of ICAM3 among subgroups clustered by iCluster. (G) OS analysis of ICAM3 based on TCGA database. (H) OS analysis of ICAM3 based on external GSE21501 dataset. (I) Correlation between A2ML1 gene expression and MET. (J) Relative expression level of A2ML1 among subgroups identified by iCluster. (K) OS analysis of A2ML1 based on TCGA database. (L) OS analysis of A2ML1 based on the external GSE71729 dataset.
*p < 0.05; **p < 0.01; ***p < 0.001.
HR: Hazard ratio; KM: Kaplan–Meier; FPKM: Fragments per kilobase of exon per million mapped reads; MET: DNA methylation; OS: Overall survival; TCGA: The cancer genome atlas..
Comparison of mutation spectrum among pancreatic cancer subgroups
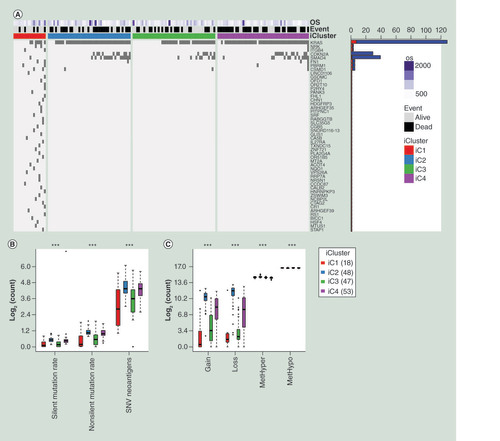
We further analyzed the mutation spectrums of the four subgroups clustered by iCluster. A group of genes with significant differences between iC1 and iC2/iC3/iC4 subgroups were identified and top 50 genes were selected to display according to the rank of Fisher test p-value (A & Supplementary Table 10). The mutation frequency of KRAS, CDKN2A and SMAD4 genes in iC2/iC3/iC4 subgroups with poor prognosis were significantly higher than that in iC1 subgroup (p < 0.05). Overall, the amount of silent mutation, nonsilent mutation and SNV neoantigens of iC1 subgroup were significantly less than that of iC2/iC3/iC4 subgroups (B & Supplementary Table 12). As for CNV gain and CNV loss data, we observed the similar trend that iC1 owned a smaller number of CNV mutations compared with iC2/iC3/iC4 subgroups (C & Supplementary Table 5). Although there were significant differences of MetHyper and MetHypo between the four subgroups, significant differences between iC1 and iC2/iC3/iC4 subgroups were not observed (C & Supplementary Table 5). Above results suggested that genomic instability had an important impact on the prognosis of pancreatic cancer and high rate of mutation and CNV aberrance might lead to worse prognosis.
(A) Top 50 mutated genes between iC1 and the other three subgroups, ranking by p-value of the Fisher test. Names of these 50 genes were listed at the right side of the figure. Bar plot at the right side stands for mutational number. Red plot means mutational number of iC1 and blue plot means mutational number of iC2/iC3/iC4. OS means overall survival days. A dark grid represents one mutation. (B) The distribution of different mutational types in the four subgroups of pancreatic cancer. (C) The distribution of CNV gain, CNV loss, MetHyper and MetHypo in the four subgroups of pancreatic cancer. The Kruskal–Wallis test was used.
***p < 0.001
CNV: DNA copy number variation; OS: Overall survival; SNV: Simple nucleotide variation.
Discussion
Several previous researches have proved that integrated multi-omics analysis of cancers could provide a new method for classification of molecular subgroups, identifying precise targets for therapy or diagnosis [Citation21,Citation22]. With the rapid development of efficient whole genome sequencing, TCGA and GEO databases provide easy access to enormous high-throughput genome sequencing results and corresponding clinical information [Citation23,Citation24]. Pancreatic cancer is the fourth deadliest cancer with extremely low survival rate. The classical TNM staging and diagnostic methods cannot meet the requirements of precision medicine and molecular medicine. Therefore, it is of great importance to establish specific subgroups to help elucidate the underlying mechanism of tumor progression and find new biomarkers based on multi-omics analysis.
Based on the CNV, MET and mRNA data of 161 pancreatic cancer patients from TCGA database, we identified two gene datasets including CNVcor and METcor. The total samples were clustered into four groups based on CNVcor or METcor, respectively. After that, we integrated METcor and CNVcor to cluster the samples and finally identified four molecular subgroups (iC1, iC2, iC3 and iC4). The iC1 subgroup owned better OS and PFS compared with the other three subgroups. Besides, the immune scores of the subgroups showed that iC1 had the highest scores in B cell, CD4 T cell, neutrophil cell, macrophage cell and dendritic cell. The scores of immune signatures (macrophage regulation, lymphocyte infiltration signature, IFN-γ response and TGF-β response) were also higher in iC1 subgroups, indicating iC1 subgroup might in the state of immune activation contributing to the good prognosis. Correlation analysis of clinicopathological information showed that iC1 subgroup tended to light smoker and early stage of tumor. The clinicopathological information of pancreatic cancer patients provided by TCGA database were generated according to the AJCC/UICC 6th or 7th edition, so the latest clinicopathological data based on AJCC/UICC 8th edition cannot be obtained for further analysis such as TNM stage, histologic grade and clinical stage. This limitation can be overcome if the TCGA website updates its clinicopathological information later. These results suggested that integrated multi-omics analysis could provide a novel method for molecular subtypes classification.
The DEGs between iC1 and the other three subgroups were examined. Eight hundred and seventeen common DEGs between iC1 and iC2/iC3/iC4 subgroups were obtained and GO analysis identified various immune-regulation-related terms that were consistent with above immune scores analysis of molecular subgroups. Then, we obtained 35 prognosis-related genes and three genes (GRAP2, ICAM3 and A2ML1) could be verified in external datasets GSE21501 [Citation25] and GSE71729 [Citation26]. Due to the three datasets and corresponding clinical follow-up information were established and collected by different organizations, only three overlapped genes among three datasets might be caused by internal heterogeneity and diversity. The three genes can be verified in three different datasets indicating universal prognosis significance of these genes. Besides, the residual prognosis-related genes also deserve for further study in the future. GRAP2 had been regarded as a tumor-suppressive gene by combing with cyclin D1-interacting protein and inhibited the progression of colon cancer, lung cancer, breast cancer and liver cancer via various mechanisms [Citation27–29]. ICAM3 protein might promote metastasis of breast and lung cancer via facilitating cancer cell stemness [Citation30,Citation31]. A2ML1 had been reported that could predict prognosis of lung cancer and its expression was associated with TRIM58/cg26157385 methylation [Citation32]. After correlation analysis with CNV or MET aberrance, we found a significant negative relationship between the three genes expression level and methylation status, speculating that methylation status plays an important role in gene expression and prognosis. These results suggested that GRAP2, ICAM3 and A2ML1 could serve as potential new biomarkers for therapy, diagnosis and prognosis in pancreatic cancer. We will investigate the biological and clinical functions of the three new targets (GRAP2, ICAM3 and A2ML1) in pancreatic cancer in the further study since little literatures had been reported.
Based on the mutation spectrum analysis, the iC1 subgroup with the best prognosis contained lesser mutation of KRAS, CDKN2A and SMAD4, which were considered as classical oncogenes compared with the other three subgroups [Citation33]. In addition, we observed that iC1 subgroup possessed lower number of mutations and CNV aberrances than the other subgroups. These results demonstrated that genomic stability had significant impact on the prognosis of pancreatic cancer. Besides, the correlation analysis indicated a close relationship between CNV and MET aberrances. The multi-omics analysis can take full advantage of genomics, epigenomics, and transcriptomics data to identify different molecular subgroups and new biomarkers.
Conclusion
We performed systematic analysis of pancreatic cancer based on multiple omics data in this study. We found that CNV and MET could regulate gene expression individually or together, suggesting the coordinated dysregulation of genomics and epigenomics on transcriptomics. Integrated analysis of CNV, MET and mRNA data help to establish four clinically related molecular subgroups of pancreatic cancer and identify three new biomarkers. New clinical and mechanistic perspectives from multi-omics analysis could contribute to accurate diagnosis and treatment for pancreatic cancer patients.
Future perspective
Pancreatic cancer is a malignant disease with extreme difficulties in early diagnosis and treatment. Understanding the molecular mechanism behind occurrence and development of pancreatic cancer is a key to improve the OS and find therapeutic targets. Unfortunately, the classical TNM stage simply stratifies patients merely based on clinical presentation, which is far from the demand of precision medicine. Besides, most of the traditional biomarkers or targets for pancreatic cancer only focus on one aspect of genomics, epigenomics and transcriptomics. With the rapid development and decreased price of sequencing technique, we can access to enormous high-throughput genome sequencing data. It is convenient to obtain multi-omics data of individuals in the future. Therefore, we integrate genomics, epigenomics, transcriptomics and clinical data of 161 pancreatic cancer patients to establish four molecular subgroups (iC1/iC2/iC3/iC4). The iC1 subgroup harbors better prognosis, higher immune scores, less mutation and better genomic stability compared with the other three subgroups. In addition, the comparisons between our established molecular subgroups and the previous reported molecular subtypes of pancreatic cancer were conducted to find similar molecular portraits. After preliminary analysis, we found that the iC1 subgroup had similar features with immunogenic and quasimesenchymal subgroups. The immunogenic subgroup was built by Bailey et al. and characterized by close association with immune infiltration and immune pathways [Citation34]. The quasimesenchymal subgroup showed high expression of mesenchyme-associated genes and more sensitive to gemcitabine, which was established by Collisson et al. [Citation35]. The comparative study may contribute to find more specific molecular features of pancreatic cancer subgroups, which deserves future investigation. In this study, we identified 35 prognosis-related genes and three genes could be verified in two external datasets. The detailed mechanisms behind these genes in the progression of pancreatic cancer should be elucidated in our future studies. The integrated analysis of multi-omics data can contribute to develop precision management of pancreatic cancer. The outcomes of multi-omics analysis will improve as more data of pancreatic cancer patients become available.
Integrated analysis of genomics, epigenomics, transcriptomics and clinical information data from 161 pancreatic cancer patients help identify four prognosis-related molecular subgroups including iC1, iC2, iC3 and iC4.
The iC1 subgroup harbors better prognosis and higher scores of immune cells and immune signatures, indicating an immunological enhancement state of iC1 subgroup.
We obtained 35 prognosis-related genes from the differentially expressed genes between iC1 and the other three subgroups, three genes (GRAP2, ICAM3 and A2ML1) can be verified in two external datasets.
The mutation frequencies of KRAS, CDKN2A and SMAD4 genes are lower in the iC1 subgroup. The iC1 subgroup owns better genomic stability since it contains less mutations and DNA copy number variation (CNV) aberrances.
Integrated analysis of multi-omics data can contribute to develop precision management of pancreatic cancer. More multi-omics data of patients are needed to improve the credibility of molecular subgroup classification.
Ethical conduct of research
The authors state that they have obtained appropriate institutional review board approval or have followed the principles outlined in the Declaration of Helsinki for all human or animal experimental investigations. In addition, for investigations involving human subjects, informed consent has been obtained from the participants involved.
Supplemental information 1
Download Zip (12.1 MB)Acknowledgments
The results published here are in whole or part based upon data generated by the TCGA Research Network: https://www.cancer.gov/tcga.
Supplementary data
To view the supplementary data that accompany this paper please visit the journal website at: www.tandfonline.com/doi/suppl/10.2217/epi-2019-0374
Financial & competing interests disclosure
This work was supported by the National Natural Science Foundation of China (grant numbers: 81902953 and 30973501); Natural Science Foundation of Liaoning Province (grant number: 180530068); the Outstanding Young Doctor Fund of China Medical University (grant number: QGZD2018050); Liaoning BaiQianWan Talents Program (grant number: 3200417003); 345 Talent Project of Shengjing Hospital of China Medical University. The authors have no other relevant affiliations or financial involvement with any organization or entity with a financial interest in or financial conflict with the subject matter or materials discussed in the manuscript apart from those disclosed.
The writing assistance used in the production of this manuscript was provided by American Journal Experts (AJE). The funding for AJE writing assistance was provided by the 345 Talent Project of Shengjing Hospital of China Medical University.
Additional information
Funding
References
- Siegel RL , MillerKD , JemalA. Cancer statistics, 2019. CA Cancer J. Clin.69(1), 7–34 (2019).
- Mcguigan A , KellyP , TurkingtonRC , JonesC , ColemanHG , MccainRS. Pancreatic cancer: a review of clinical diagnosis, epidemiology, treatment and outcomes. World J. Gastroenterol.24(43), 4846–4861 (2018).
- Hidalgo M . Pancreatic cancer. N. Engl. J. Med.362(17), 1605–1617 (2010).
- Garrido-Laguna I , HidalgoM. Pancreatic cancer: from state-of-the-art treatments to promising novel therapies. Nat. Rev. Clin. Oncol.12(6), 319–334 (2015).
- Mo Q , ShenR , GuoC , VannucciM , ChanKS , HilsenbeckSG. A fully Bayesian latent variable model for integrative clustering analysis of multi-type omics data. Biostatistics19(1), 71–86 (2018).
- Waddell N , PajicM , PatchAMet al. Whole genomes redefine the mutational landscape of pancreatic cancer. Nature518(7540), 495–501 (2015).
- Girirajan S , CampbellCD , EichlerEE. Human copy number variation and complex genetic disease. Annu. Rev. Genet.45, 203–226 (2011).
- Huang L , YuD , WuCet al. Copy number variation at 6q13 functions as a long-range regulator and is associated with pancreatic cancer risk. Carcinogenesis33(1), 94–100 (2012).
- Lee JH , GiovannettiE , HwangJHet al. Loss of 18q22.3 involving the carboxypeptidase of glutamate-like gene is associated with poor prognosis in resected pancreatic cancer. Clin. Cancer. Res.18(2), 524–533 (2012).
- Witkiewicz AK , McmillanEA , BalajiUet al. Whole-exome sequencing of pancreatic cancer defines genetic diversity and therapeutic targets. Nat. Commun.6, 6744 (2015).
- Hung YH , HsuMC , ChenLT , HungWC , PanMR. Alteration of epigenetic modifiers in pancreatic cancer and its clinical implication. J. Clin. Med.8(6), 903 (2019).
- Sharma S , KellyTK , JonesPA. Epigenetics in cancer. Carcinogenesis31(1), 27–36 (2010).
- Lomberk G , BlumY , NicolleRet al. Distinct epigenetic landscapes underlie the pathobiology of pancreatic cancer subtypes. Nat. Commun.9(1), 1978 (2018).
- Zucman-Rossi J , VillanuevaA , NaultJC , LlovetJM. Genetic landscape and biomarkers of hepatocellular carcinoma. Gastroenterology149(5), 1226–1239, e1224 (2015).
- Silverman BR , ShiJ. Alterations of epigenetic regulators in pancreatic cancer and their clinical implications. Int. J. Mol. Sci.17(12), 2138 (2016).
- Eissa MaL , LernerL , AbdelfatahEet al. Promoter methylation of ADAMTS1 and BNC1 as potential biomarkers for early detection of pancreatic cancer in blood. Clin. Epigenetics11(1), 59 (2019).
- Shen R , OlshenAB , LadanyiM. Integrative clustering of multiple genomic data types using a joint latent variable model with application to breast and lung cancer subtype analysis. Bioinformatics25(22), 2906–2912 (2009).
- Li T , FanJ , WangBet al. TIMER: a web server for comprehensive analysis of tumor-infiltrating immune cells. Cancer Res.77(21), e108–e110 (2017).
- Li B , SeversonE , PignonJCet al. Comprehensive analyses of tumor immunity: implications for cancer immunotherapy. Genome Biol.17(1), 174 (2016).
- Gaujoux R , SeoigheC. A flexible R package for nonnegative matrix factorization. BMC Bioinformatics11, 367 (2010).
- Woo HG , ChoiJH , YoonSet al. Integrative analysis of genomic and epigenomic regulation of the transcriptome in liver cancer. Nat. Commun.8(1), 839 (2017).
- Zheng M , HuY , GouRet al. Integrated multi-omics analysis of genomics, epigenomics, and transcriptomics in ovarian carcinoma. Aging (Albany NY)11(12), 4198–4215 (2019).
- Cancer Genome Atlas Research Network (Electronic address: [email protected]) . Integrated genomic characterization of pancreatic ductal adenocarcinoma. Cancer Cell32(2), 185–203, e113 (2017).
- Barrett T , WilhiteSE , LedouxPet al. NCBI GEO: archive for functional genomics data sets – update. Nucleic Acids Res.41(Database issue), D991–D995 (2013).
- Stratford JK , BentremDJ , AndersonJMet al. A six-gene signature predicts survival of patients with localized pancreatic ductal adenocarcinoma. PLoS Med.7(7), e1000307 (2010).
- Moffitt RA , MarayatiR , FlateELet al. Virtual microdissection identifies distinct tumor- and stroma-specific subtypes of pancreatic ductal adenocarcinoma. Nat. Genet.47(10), 1168–1178 (2015).
- Chang TW , ChenCC , ChenKY , SuJH , ChangJH , ChangMC. Ribosomal phosphoprotein P0 interacts with GCIP and overexpression of P0 is associated with cellular proliferation in breast and liver carcinoma cells. Oncogene27(3), 332–338 (2008).
- Chen KY , ChenCC , TsengYL , ChangYC , ChangMC. GCIP functions as a tumor suppressor in non-small cell lung cancer by suppressing Id1-mediated tumor promotion. Oncotarget5(13), 5017–5028 (2014).
- Ma W , StaffordLJ , LiDet al. GCIP/CCNDBP1, a helix-loop-helix protein, suppresses tumorigenesis. J. Cell. Biochem.100(6), 1376–1386 (2007).
- Shen W , XieJ , ZhaoSet al. ICAM3 mediates inflammatory signaling to promote cancer cell stemness. Cancer Lett.422, 29–43 (2018).
- Shen W , ZhangX , DuRet al. ICAM3 mediates tumor metastasis via a LFA-1-ICAM3-ERM dependent manner. Biochim. Biophys. Acta. Mol. Basis. Dis.1864(8), 2566–2578 (2018).
- Zhang W , CuiQ , QuW , DingX , JiangD , LiuH. TRIM58/cg26157385 methylation is associated with eight prognostic genes in lung squamous cell carcinoma. Oncol. Rep.40(1), 206–216 (2018).
- Kamisawa T , WoodLD , ItoiT , TakaoriK. Pancreatic cancer. Lancet388(10039), 73–85 (2016).
- Bailey P , ChangDK , NonesKet al. Genomic analyses identify molecular subtypes of pancreatic cancer. Nature531(7592), 47–52 (2016).
- Collisson EA , SadanandamA , OlsonPet al. Subtypes of pancreatic ductal adenocarcinoma and their differing responses to therapy. Nat. Med.17(4), 500–503 (2011).