
Abstract
Aim: This study was conducted to reveal epigenetic landscape in infantile hemangiomas (IHs) and identify transcription factors (TFs) and their downstream genes active in IHs. Materials & methods: We performed Assay for Transposase Accessible Chromatin (ATAC-seq)with RNA-seq in three pairs of IHs and their adjacent normal tissues. Functions of candidate TFs were investigated in human umbilical vein endothelial cells (HUVECs). Results: Chromatin of IH tissues is less compact. Some candidate genes and TFs were identified. In HUVECs, SPDEF inhibited cell viability and tube formation, and promoted apoptosis; SOX4 exerted the opposite effect. SPDEF may act through EPHA5, ZBTB46 and SASH1; SOX4 may act through MMP12 and HIVEP3. Conclusion: Epigenetics plays a role in IHs. SPDEF and SOX4 may act in IHs.
Infantile hemangiomas (IHs) are the most common benign vascular tumors in infants. IHs are typically noticed within a few days of birth and undergo a unique course of disease, wherein a rapid proliferating phase is followed by spontaneous regression. In approximately 10–15% of cases, IHs cause disfigurement and dysfunction due to rapid proliferation of the tumor [Citation1]. The pathogenesis of IHs, and factors that cause spontaneous regression after the proliferation remain unclear. The protocell hypothesis has been widely accepted [Citation2,Citation3]. Although both sporadic and familial IHs are known, no causative mutations or chromosome changes have been identified to date [Citation4,Citation5]. Epigenetic regulation is likely to play an important role in the development of IHs. Moreover, it has been confirmed that DNA methylation levels, along with those of miRNAs, circRNAs and lncRNAs are altered in IHs [Citation6–9].
Nuclear DNA in eukaryotic cells undergo complex and orderly folding into chromosomes with the aid of proteins. In order for genes to be expressed, chromatin must be in open conformation. Open chromatin allows regulatory proteins to bind to DNA and modulate its functions [Citation10]. The Assay for Transposase Accessible Chromatin with sequencing(ATAC-seq) identifies the sequences of the accessible open chromatin regions using Tn5 transposase [Citation11,Citation12]. This simple method requires only small amounts of the sample to yield clear and reproducible sequencing results, and closely resembles ChIP-seq [Citation12]. Cost-effective ATAC-seq is a powerful method for obtaining information on the open chromatin regions, as well as genes that are transcribed under disease conditions and their regulatory elements [Citation13]. Importantly, detecting changes in open chromatin can reveal the role of epigenetic regulation in IHs.
To determine the different chromatin accessibility of IHs and normal skin, and understand how gene expression is regulated in IHs, we used ATAC-seq in combination with RNA-seq, which are mutually authenticating [Citation14,Citation15]. By combining analysis of the regulation of the transcription process from DNA to RNA, we identified genes and transcription factors (TFs) which possibly act in the pathogenesis of IHs.
Material & methods
Samples
Proliferative hemangioma was diagnosed by two independent doctors according to clinical features and Doppler sonography. Samples were collected from March 2018 to March 2019 at the Department of Plastic Surgery, Shandong Provincial Hospital. Three paired samples were used, including tumor of proliferative IHs (abbreviated as T) and the normal tissues adjacent to but farther than 1cm from the outermost edge of the tumors (abbreviated as S). The tumors were divided into two parts after excision: one part was flash-frozen in liquid nitrogen for subsequent experiments, and the other part was paraffin-embedded and sectioned for hematoxylin and eosin and immunohistochemical staining for glucose transporter 1[Citation16]. The tumors were reconfirmed by pathological examination (), and the normal tissues were confirmed to be free of tumor invasion. General information on patients and tumors is shown in .
(A) HE stain of sample 1, 10.0×. (B) Immunohistochemistry of GLUT-1 of sample 1, 20.0×. (C) HE stain of sample 2, 10.0×. (D) Immunohistochemistry of GLUT-1 of sample 2, 20.0×. (E) HE stain of sample 3, 10.0×. (F) Immunohistochemistry of GLUT-1 of sample 3, 20.0×.
HE: Hematoxylin and eosin.
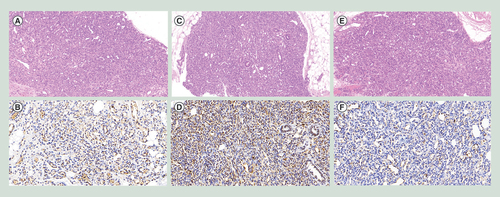
Table 1. Characteristics of patients.
ATAC-seq & statistical analysis
The nuclei of cryopreserved tissue was processed according to Omni-ATAC[Citation17]. Approximately 50,000 nuclei obtained from Optiprep (Sigma-Aldrich, MO, USA) differential centrifugation were suspended in transposition reaction mix. After purification, transposed DNA fragments were amplified for 14 cycles with primers designed according to Buenrostro and colleagues [Citation12]. The barcode sequences of PCR Primer 2 are shown in Supplementary File 1.1. The PCR products were eluted and quantified using Agilent Bioanalyzer 2100. The standard libraries were established and sequenced on a HiSeq X Ten using 150-bp paired-end reads (PE150).
Clean reads were obtained using Trimmomatic (v. 0.26) and aligned to hg19 reference genome (RefSeq) by Bowtie 2 [Citation18]. After filtering out non-nucleus and duplication reads, properly paired reads with mapping qualities ≥30 were used for subsequent analyses. The bam files of the T and S samples were merged by Samtools and subsequently styleDnase.pl of Homer2 was used for peaks calling [Citation19]. The procedure to obtain differentially enriched peaks and motif enrichment was conducted according to the protocol provided by Scharer and colleagues [Citation20].
RNA-seq & statistical analysis
Total RNA was extracted with TRIzol reagent (Invitrogen Life Technologies, CA, USA). RNA purity was analyzed using a NanoPhotometer (IMPLEN, CA, USA), concentration was determined using a Qubit 3.0 Fluorometer (Life Technologies, CA, USA) and quality tested with the Agilent 2100 RNA Nano 6000 Assay Kit (Agilent Technologies, CA, USA). Poly(A)+ RNA was separated using magnetic beads oligo (dT) from Invitrogen. A cDNA library was prepared using fragmented RNA according to protocols [Citation21], and the RNA was used to generate double-stranded cDNA by reverse transcription with random hexamer primers.
The cDNA libraries were subjected to Novaseq 6000seq with PE150. Raw reads from Illumina were filtered to obtain clean reads, which the subsequent analysis was based on. Clean reads were mapped to RefSeq by HISATS [Citation22]. Fragments perkilobase per million reads (FPKM) was used to quantitatively estimate gene expression values [Citation23]. DESeq2 was used to analyze differential gene expression [Citation24]. Genes with |log2 Fold change| ≥1 and padj<0.05 were chosen as the differentially expressed genes [Citation23].
Preliminary function of candidate TFs
SPDEF and SOX4 were chosen as candidate TFs. Human umbilical vein endothelial cells (HUVECs) (Procell, Wuhan, China) were cultured under DMEM-high glucose (Hyclone, UT, USA) with 20% fetal bovine serum (Hyclone) at 37°C and 5% CO2. After cell attachment for 24h, transfection was performed. There were four groups: blank group without treatment (blank group), negative control group with empty plasmid (NC group), SPDEF overexpression plasmid group (SPDEF group) and SOX4 overexpression plasmid group (SOX4 group). The pENTER transfer vector plasmid constructed with SPDEF or SOX4 genes through AsiSI/MluI cutting sites (Vigene Biosciences, Jinan, China) were used. During cell transfection, Opti-MEM (Gibco, NY, USA) and Liopfectamine 2000 Reagent (Thermo Fisher Scientific, MA, USA) were used. The experiment was performed in triplicate. See Supplementary File 2 for western blot of transfection validation. Tukey’s multiple comparisons test of GraphPad Prism 8.0.2 was used to analyze the data.
After 24, 48, 72 and 96h of transfection, MTT assay was used to detect cell viability, and absorbance was measured at 490nm. After 48h of transfection, flow cytometry was performed to detect apoptosis (Annexin V assay) and cell cycle (PI method). Matrigel assay was used to detect in vitro angiogenesis. Matrigel (10μl) and cell suspension (50μl; 300,000 cells/ml) were added to each well of a μ-Slide. Figures were obtained after 8h of culture.
GRB14, EPHA5, ZBTB46and SASH1 were primarily chosen as candidate genes of SPDEF; MMP12 and HIVEP3 were chosen as candidate genes of SOX4. After 48h of transfection, real-time PCR was performed to detect changes in gene expression after HUVECs were transfected by the overexpression plasmid. Takara MiniBEST universal RNA extraction kit (Takara, Tokyo, Japan) was used for RNA extraction. Primescript RT reagent kit with gDNA Eraser (perfect real time) (Takara) was used for genomic DNA removal and reverse transcription reaction. Light cycler 480 SYBR Green I Master (Roche, Basel, Switzerland) was used for real-time PCR, and primer sequences are included in Supplementary File 1.2.
Results
Mapping open chromatin of IHs with ATAC-seq
Processed data files of ATAC-seq are shown in Supplementary File 3.1–3.6. The distinct period distribution of all ATAC-seq libraries showed that most of the insert fragments were small, representing inter-nucleosomal open chromatin (A). The accessibility of transcriptional start sites was significantly enriched (B &C).
(A) Distribution of insert size in reads. The short fragments represent sequence reads in open chromatin of sub-nucleosome (<150bp), while the larger ones represent reads that span one nucleosome. (B) Reads density distribution in chromosomes. In order to visualize the distribution of reads in the gene body and its flanking 2-kb range.(C) Proportion of peaks regions matched to elements in the human genome. (D) Scatter plot of the accessibility at each peak. The red points represent T-S peaks. The green points represent S-T peaks.
Down: Downregulated; TES: Transcription end site;TSS: Transcription start site; Up: Upregulated.
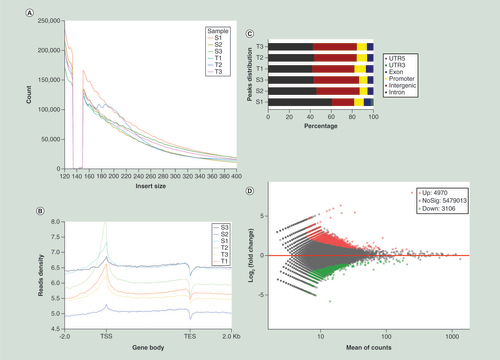
After merging data, we found 4970 differential peaks that represent T to be more open than S (abbreviated as T-S), and 3106 differential peaks that represent S to be more open than T (abbreviated as S-T). In general, differentially open chromatin regions showed more accessibility in IH tissue (D). In detail, T-S peaks mapped to 3888 genes, including 708 genes that contained more than one differentially accessible region and 11 peaks mapped to no gene; S-T differential peaks mapped to 2507 genes, including 409 genes that contained more than one differentially accessible region, and 9 peaks mapped to no gene. Moreover, 839 genes had mapped peaks from both T-S and S-T. For T-S and S-T peaks which were annotated as promoters, 75.8 and 78.6% were promoters of protein-coding genes, and 19.8 and 21.4% were promoters of ncRNA genes, respectively. Additionally, the one-to-one pairing comparison of the three specimen pairs showed that the chromatin of T was more accessible than that of S.
Detecting gene expression with RNA-seq
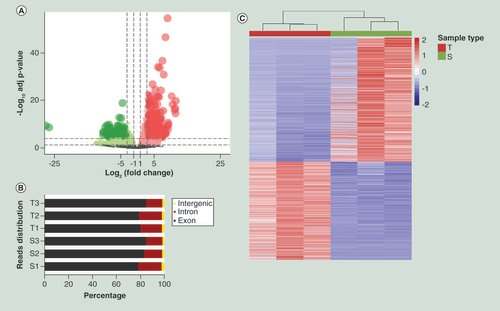
Processed data file of RNA-seq is shown in Supplementary File 4. There were 3286 differentially expressed genes, including 1453 upregulated genes (A). In general, most of the sequences mapped to the exon regions. Due to alternative splicing or new transcripts, as well as noisy signals, some sequences may have mapped to intron or intergenic regions, respectively (see B). Hierarchical clustering was performed to visualize the differentially expressed genes (see C).
(A) Volcano plot. The red points in the plot represent the differentially expressed transcripts between IHs and adjacent normal tissue with statistical significance. (B) Proportion of reads matched to elements in the human genome. (C) Hierarchical cluster analysis of all the deregulated genes annotated by reads.
ATAC-seq: Assay for Transposase Accessible Chromatin using sequencing;IH: Infantile hemangioma.
Integration of ATAC-seq with RNA-seq
Among the genes mapped by T-S peaks, 155 genes had the same trend in RNA-seq, indicating an intersection of mapped genes between more accessible chromatin and upregulated RNA when comparing T with S (A). Among them, 45 genes corresponded to more than one peak (Supplementary File 5). As for S-T, 97 genes were found, including 63 genes corresponding to more than one peak (Figure4A, Supplementary File 6). Hierarchical clustering was performed to visualize the overall integrated differential peaks (B). To gain further insight into the function of these genes, gene ontology (GO) and Kyoto Encyclopedia of Genes and Genomes (KEGG) pathway were analyzed (Supplementary File 7 &8). Rap 1 signaling pathway, Ras signaling pathway, Apelin signaling pathway and MAPK signaling pathway are among the top 20 KEGG enrichment pathways.
(A) Venn diagram. Overlap of genes that have the same trend in RNA-seq and ATAC-seq. (B) Hierarchical cluster analysis of all the deregulated genes annotated by peaks. (C &D) Open regions at motif of SPDEF. (E &F) Open regions at motif of SOX4.
ATAC-seq:Assay for Transposase Accessible Chromatin using sequencing.
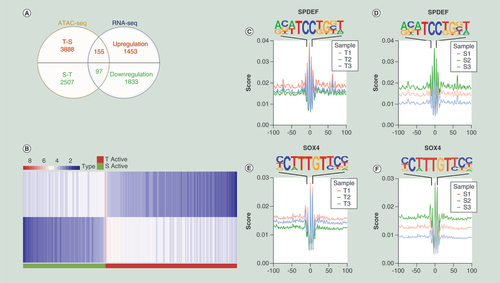
Only 5.2 and 7.6% of the ATAC-seq peaks mapped to differentially expressed genes, for T-S and S-T, respectively. Because many of the genes mapped by ATAC-seq peaks were not differentially expressed, we sought to determine whether these differentially accessible peaks were enriched for particular TF-binding sites. Finally, known Homer TFs SPDEF, REVERB, TBX20, EBF1, SOX4, GATA:SCL and SOX6 were identified (). In the integration data, SPDEF only regulated T-S genes, and the others only regulated S-T genes. Except REVERB, the other TFs exhibited relevant expression in RNA-seq. Possible downstream genes with a motif for these TFs, following integration of results from the two analyses, are marked in . Based on literature data and integration analysis, we preliminary considered that the possible TFs were SPDEF and SOX4. Open region patterns were observed at the sequence motifs for SPDEF and SOX4 (C–F).
Table 2. TFs binding homer known motifs enriched in chromatin regions of infantile hemangiomas.
Table 3. TFs and their corresponding genes after integration.
Preliminary function of SPDEF & SOX4
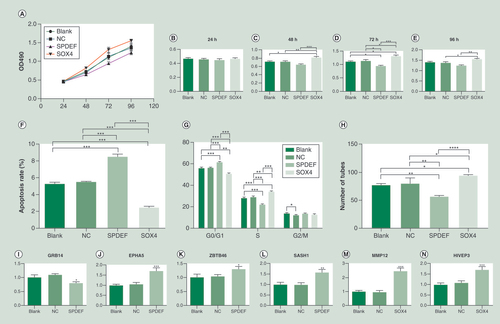
In the MTT assay, the cell viability began to show a difference from 48h of culture. At 48 and 72h, the cell viability of the SOX4 group was higher than that of the other groups. At 96h, the cell viability of the SOX4 group was higher than that of the NC and SPDEF groups. The cell viability of the SPDEF group was lower than that of the SOX4 group at 48 and 96h, and that of other groups at 72h. The overall trend was that the cell viability of the SPDEF group decreased while that of the SOX4 group increased (A–E). Flow cytometry showed that the SPDEF group had an increased apoptotic rate while SOX4 group was just the opposite (F). SPDEF group had increased cells in the G0/G1 phase, and decreased cells in the S phase, while the SOX4 group was just the opposite. There was no statistical difference in the number of cells in the G2/M phase between the two groups (G). As for in vitro angiogenesis, tube formation decreased in the SPDEF group and increased in the SOX4 group (H). PCR showed that after the transfection of the SPDEF overexpressed plasmid, EPHA5, ZBTB46 and SASH1 showed increased expression (p<0.05), while GRB13 showed decreased expression (p=0.004)I–N). With the increased expression of SOX4, MMP12 and HIVEP3 showed increased expression (p<.0005).
(A) Cell viability after 24, 48, 72 and 96h of transfection. (B) 24h. (C) 48h. (D) 72h. (E) 96h. (F) Apoptosis after 48h of transfection. (G) Cell cycle after 48h of transfection. (H) Tube formation by Matrigel assay. (I–L) The relative mRNA levels under SPDEF overexpression. (M &N) The relative mRNA levels under SOX4 overexpression.
*p < 0 .05; **p < 0 .01; ***p < 0 .001; ****p < 0 .0001.
ATAC-seq: Assay for Transposase Accessible Chromatin using sequencing.
Discussion
Our findings are consistent with the effect of many candidate molecules on IHs [Citation25], and provide new insights into the open region of chromatin. The protocell hypothesis, is a generally accepted explanation for the origin of IHs, suggests that IHs are clonal tumors [Citation1–3]. ATAC-seq in this study showed that chromatin of IH tissue to be more open than that of adjacent normal tissue, indicating that the genetic information of hemangiomas is actively expressed, or that a high proportion of the cells in IHs are transcriptionally active. Only few studies have focused on the TFs of IHs. TFs, including STAT1, STAT3, STAT5, FOXO1, HOXD3, HOXD10, TBX2, have been reported sporadically and not quite systematically in IHs [Citation26–30].
Notably, in our study, only a small number of peaks are mapped to differentially expressed genes. This is consistent with other studies and supports the view that gene activation depends on multiple regulatory regions, many of which are located far from the gene locus itself [Citation14]. According to RNA-seq, both SPDEF and SOX4 were expressed in IHs, but did not show a statistical difference with the control group. TFs do not need to be in a state of differential expression to function. To investigate the role of SPDEF and SOX4, and their downstream genes, we performed experiments in HUVECs. HUVECS have been commonly used in vitro in experiments to investigate IHs and other vascular tumors or angiogenesis in tumors [Citation31,Citation32]. The current studies report that the androgen-responsive gene SPDEF is mainly related to tumors–SPDEF was reported as a suppressor in tumor metastasis and progression, while some studies report otherwise [Citation33]. Reports strongly support that SOX4 acts as an oncogene that promotes stemness, cancer cell survival, angiogenesis, migration, mesenchymal transition and metastasis. Under normal condition, SOX4 regulates stemness, differentiation, progenitor development, working as an essential developmental TF [Citation34]. Furthermore, SOX4 becomes restricted as cells reach their final differentiation state, which is very alike with the life span of IHs –protocell origin, angiogenesis and tumor properties, and self-restricted growth.
According to the performance of HUVECs overexpressing the above two candidate TFs and change in the mRNA levels of candidate genes, we assumed that SPDEF could act through EPHA5, ZBTB46, or SASH1 to act as a suppressor in HUVECs, while SOX4 has a promoting effect through regulating MMP12 and HIVEP3. Decreased EPHA5 level is associated with poorer tumor prognosis [Citation35,Citation36], and SASH1 acts as a tumor suppressor [Citation37]. ZBTB46 likely has an inhibitory role in angiogenesis [Citation38]. MMPs are involved in angiogenesis during tumor metastasis and invasion [Citation39]. HIVEP3 plays a critical role in female-biased autoimmune disorders and may make the tumor more progressive by changing the immune environment [Citation40,Citation41].
Chen and colleagues proved that SPDEF is physically associated with the promoter of ZBTB46; however, SPDEF transcriptionally represses ZBTB46 in prostate cancer cells [Citation42]. Further, ZBTB46 acts as a tumor promoter in prostate cancer [Citation43]. However, ZBTB4 increases the number of cells in G0/G1 phase of the cell cycle in human aortic endothelial cells [Citation38]. Therefore, the effect of SPDEF on ZBTB46 in endothelial cells needs further investigation.
In most cases of IHs, by 4 months of age, approximately 80% of the tumor growth is complete, and thereafter the slope of the growth curve becomes smaller. When the child reaches 9 months of age, the tumor reaches its maximum volume, at which point apoptosis begins to prevail. Till the end of involution, protocells of IHs reach their final differentiation state. Even in one tumor, the phases of growth and regression can overlap [Citation1]. According to our research, in IHs under middle and late proliferating phases, EPHA5, ZBTB46 and SASH1 were upregulated, while MMP12 and HIVEP3 were downregulated. The expression pattern of these genes is consistent with the fact that the IH specimens included had begun transitioning into regression.
Conclusion
There are some limitations of our study. The protocells of IHs are clonal cells. Although ATAC-seq uses fewer starting cells, it still cannot solve this problem. Therefore, considering individual differences, a one-to-one specimen Motif analysis without bam file merging is provided in Supplementary File 9 for you reference. Second, early stage (within 3 months) tumor specimens could complement our hypothesis.
In summary, we showed that nuclear chromatin of IHs was more open than that of normal tissues, which confirmed the neovascularized and neoplastic characteristics of IHs and that epigenetics does play a role in IHs. A total of 252 genes were identified along with SPDEF, REVERB, TBX20, EBF1, SOX4, GATA:SCL and SOX6. We suggest that the TFs SPDEF and SOX4 may be involved in the pathogenesis of IHs. Instead of causing differential expression, SPDEF may act through EPHA5, ZBTB46and SASH1; SOX4 may act through MMP12 and HIVEP3. During the middle and late proliferating phases, unregulated EPHA5, ZBTB46or SASH1 exerts an inhibitory effect, and the promoting effect of MMP12 or HIVEP3 is downregulated. Our results improve our understanding of IHs, a vascular lesion that remains a significant cause of morbidity in newborn children.
Future perspective
Study of the pathophysiology of IHs still has a long way to go, and epigenomic research seems to contribute to some extent. The method used in this study has enriched the database, proposed possible molecules and provided bam files for analysis. We speculate that both the genes and motifs identified in the integration analysis of this study can be further analyzed. Furthermore, the data presented herein can be correlated with those on histone modifications, methylation, etc. by other researchers in order to detect key molecules and their role in IHs.
Detecting changes in open chromatin can reveal the role of epigenetic regulation in infantile hemangioma (IHs).
Assay for Transposase Accessible Chromatin using sequencingcombined with RNA-seq, which are mutually authenticating, can reveal the regulation of the transcription process from DNA to RNA.
Nuclear chromatin of IHs was more open than that of normal tissues, which confirmed the neovascularized and neoplastic characteristics of IHs and that epigenetics plays a role in IHs.
A total of 252 genes were identified.
Homer known motifs of transcription factors were SPDEF, REVERB, TBX20, EBF1, SOX4, GATA:SCL and SOX6.
We hypothesize that SPDEF and SOX4 could be the transcription factors acting in IHs.
SPDEF acts as a suppressor, while SOX4 has a promoting effect in human umbilical vein endothelial cells.
The downstream genes of SPDEF may include EPHA5, ZBTB46and SASH1; possible target genes of SOX4 were MMP12 and HIVEP3.
Ethical conduct of research
This study was approved by the Institutional Ethics Review Board of Shandong Provincial Hospital Affiliated to Shandong University (No. 2017-051). Written informed consents were signed by the guardians of the children.
Supplemental Information 1
Download Zip (7.1 MB)Acknowledgments
The authors would like to thank S Liu, X_biol (Jinan, China), for his technical assistance and contribution to the data processing.
Supplementary data
To view the supplementary data that accompany this paper please visit the journal website at: www.tandfonline.com/doi/suppl/10.2217/epi-2020-0060
Financial & competing interest disclosure
This work was supported by the National Natural Science Foundation of China (grant number 81671927). The authors have no other relevant affiliations or financial involvement with any organization or entity with a financial interest in or financial conflict with the subject matter or materials discussed in the manuscript apart from those disclosed.
No writing assistance was utilized in the production of this manuscript.
Additional information
Funding
References
- Léauté-Labrèze C , HarperJI , HoegerPH. Infantile haemangioma. Lancet390(10089), 85–94 (2017).
- Wong A , HardyKL , KitajewskiAM , ShawberCJ , KitajewskiJK , WuJK. Propranolol accelerates adipogenesis in hemangioma stem cells and causes apoptosis of hemangioma endothelial cells. Plast. Reconstr. Surg.130(5), 1012–1021 (2012).
- Munabi NC , EnglandRW , EdwardsAKet al. Propranolol targets hemangioma stem cells via cAMP and mitogen-activated protein kinase regulation. Stem Cells Transl. Med.5(1), 45–55 (2016).
- Castren E , SalminenP , VikkulaM , PitkarantaA , KlockarsT. Inheritance patterns of infantile hemangioma. Pediatrics138(5), pii: e20161623 (2016).
- Jinnin M , MediciD , ParkLet al. Suppressed NFAT-dependent VEGFR1 expression and constitutive VEGFR2 signaling in infantile hemangioma. Nat. Med.14(11), 1236–1246 (2008).
- Zhang L , ZhangJ , LvRet al. Role of N6-methyladenine DNA modification in the pathogenesis of infantile hemangioma. Chin. J. Plast. Surg.34(11), 959–964 (2018).
- Biswas A , PanX , MeyerMet al. Urinary excretion of MicroRNA-126 Is a biomarker for hemangioma proliferation. Plas. Reconstr. Surg.139(6), 1277e–1284e (2017).
- Liu X , LvR , ZhangLet al. Long noncoding RNA expression profile of infantile hemangioma identified by microarray analysis. Tumour Biol. doi:10.1007/s13277-016-5434-y (2016) ( Epub ahead of print).
- Fu C , LvR , XuGet al. Circular RNA profile of infantile hemangioma by microarray analysis. PLoS ONE12(11), e0187581 (2017).
- Thurman RE , RynesE , HumbertRet al. The accessible chromatin landscape of the human genome. Nature489(7414), 75–82 (2012).
- Adey A , MorrisonHG , Asanet al. Rapid, low-input, low-bias construction of shotgun fragment libraries by high-density in vitro transposition. Genome Biol.11(12), R119 (2010).
- Buenrostro JD , GiresiPG , ZabaLC , ChangHY , GreenleafWJ. Transposition of native chromatin for fast and sensitive epigenomic profiling of open chromatin, DNA-binding proteins and nucleosome position. Nat. Methods10(12), 1213–1218 (2013).
- Buenrostro JD , WuB , ChangHY , GreenleafWJ. ATAC-seq: a method for assaying chromatin accessibility genome-wide. Curr. Protoc. Mol. Biol.109, 21.29.1-21.29.9 (2015).
- Ackermann AM , WangZ , SchugJ , NajiA , KaestnerKH. Integration of ATAC-seq and RNA-seq identifies human alpha cell and beta cell signature genes. Mol. Metab.5(3), 233–244 (2016).
- Lake BB , ChenS , SosBCet al. Integrative single-cell analysis of transcriptional and epigenetic states in the human adult brain. Nat. Biotechnol.36(1), 70–80 (2018).
- Van Vugt LJ , VanDer Vleuten CJM , FluckeU , BlokxWAM. The utility of GLUT1 as a diagnostic marker in cutaneous vascular anomalies: a review of literature and recommendations for daily practice. Pathol. Res. Pract.213(6), 591–597 (2017).
- Corces MR , TrevinoAE , HamiltonEGet al. An improved ATAC-seq protocol reduces background and enables interrogation of frozen tissues. Nat. Methods14(10), 959–962 (2017).
- Langmead B , SalzbergSL. Fast gapped-read alignment with Bowtie 2. Nat. Methods9(4), 357–359 (2012).
- Heinz S , BennerC , SpannNet al. Simple combinations of lineage-determining transcription factors prime cis-regulatory elements required for macrophage and B cell identities. Mol. Cell38(4), 576–589 (2010).
- Scharer CD , BlalockEL , BarwickBGet al. ATAC-seq on biobanked specimens defines a unique chromatin accessibility structure in naive SLE B cells. Sci. Rep.6, 27030 (2016).
- Nagalakshmi U , WaernK , SnyderM. RNA-Seq: a method for comprehensive transcriptome analysis. Curr. Protoc. Mol. Biol.89, 4.11.1–4.11.13 (2010).
- Siren J , ValimakiN , MakinenV. Indexing graphs for path queries with applications in genome research. IEEE/ACM Trans. Comput. Biol. Bioinform.11(2), 375–388 (2014).
- Trapnell C , WilliamsBA , PerteaGet al. Transcript assembly and quantification by RNA-Seq reveals unannotated transcripts and isoform switching during cell differentiation. Nat. Biotechnol.28(5), 511–515 (2010).
- Wang L , FengZ , WangX , WangX , ZhangX. DEGseq: an R package for identifying differentially expressed genes from RNA-seq data. Bioinformatics26(1), 136–138 (2010).
- Gomez-Acevedo H , DaiY , StrubG , ShawberC , WuJK , RichterGT. Identification of putative biomarkers for Infantile Hemangiomas and Propranolol treatment via data integration. Sci. Rep.10(1), 3261 (2020).
- Sulzberger L , TanEMS , DavisPF , BraschHD , TanST , ItinteangT. Phosphorylated forms of STAT1, STAT3 and STAT5 are Expressed in Proliferating but Not Involuted Infantile Hemangioma. Front. Surg.5, 31 (2018).
- Byun JW , AnHY , YeomSD , LeeSJ , ChungHY. NDRG1 and FOXO1 regulate endothelial cell proliferation in infantile haemangioma. Exp. Dermatol.27(6), 690–693 (2018).
- Zeng Z , LiuS , CaiJet al. miR-501 promotes hemangioma progression by targeting HOXD10. Am. J. Transl. Res.11(4), 2439–2446 (2019).
- Todorovich SM , KhanZA. Elevated T-box 2 in infantile hemangioma stem cells maintains an adipogenic differentiation-competent state. Dermatoendocrinol.5(3), 352–357 (2013).
- Hansen SL , DosanjhA , YoungDM , BoudreauN , HoffmanWY. Hemangiomas and homeobox gene expression. J. Craniofacial Surg.17(4), 767–771 (2006).
- Bota M , Fischer-FodorE , BochisOVet al. Combined effect of propranolol, vincristine and bevacizumab on HUVECs and BJ cells. Exp. Ther. Med.17(1), 307–315 (2019).
- Arnold A , YuanM , PriceA , HarrisL , EberhartCG , RaabeEH. Synergistic activity of mTORC1/2 kinase and MEK inhibitors suppresses pediatric low-grade glioma tumorigenicity and vascularity. Neuro-oncology doi:10.1093/neuonc/noz230 (2019) ( Epub ahead of print).
- Mahajan N . Signatures of prostate-derived Ets factor (PDEF) in cancer. Tumour Biol.37(11), 14335–14340 (2016).
- Moreno CS . SOX4: the unappreciated oncogene. Semin. Cancer Biol. doi:10.1016/j.semcancer.2019.08.027 (2019) ( Epub ahead of print).
- Li Y , ChuJ , FengWet al. EPHA5 mediates trastuzumab resistance in HER2-positive breast cancers through regulating cancer stem cell-like properties. FASEB J.33(4), 4851–4865 (2019).
- Chen X , WangX , WeiX , WangJ. EphA5 protein, a potential marker for distinguishing histological grade and prognosis in ovarian serous carcinoma. J. Ovarian Res.9(1), 83 (2016).
- Wang Q , DaiH. SASH1, a potential therapeutic target for cancer. Hum. Pathol.80, 246 (2018).
- Wang Y , SunHY , KumarS , PuertaMDM , JoH , RezvanA. ZBTB46 is a shear-sensitive transcription factor inhibiting endothelial cell proliferation via gene expression regulation of cell cycle proteins. Lab. Invest.99(3), 305–318 (2019).
- Butler GS , OverallCM. Updated biological roles for matrix metalloproteinases and new “intracellular” substrates revealed by degradomics. Biochemistry48(46), 10830–10845 (2009).
- Robbins CJ , Bou-DarghamMJ , SanchezK , RosenMC , SangQA. Decoding somatic driver gene mutations and affected signaling pathways in human medulloblastoma subgroups. J. Cancer9(24), 4596–4610 (2018).
- Young NA , FriedmanAK , KaffenbergerBet al. Novel estrogen target gene ZAS3 is overexpressed in systemic lupus erythematosus. Mol. Immunol.54(1), 23–31 (2013).
- Chen WY , ZengT , WenYCet al. Androgen deprivation-induced ZBTB46-PTGS1 signaling promotes neuroendocrine differentiation of prostate cancer. Cancer Lett.440–441, 35–46 (2019).
- Fararjeh AS , LiuYN. ZBTB46, SPDEF, and ETV6: novel potential biomarkers and therapeutic targets in castration-resistant prostate cancer. Int. J. Mol. Sci.20(11), 2802 (2019).