
Abstract
Aims: Excessive inflammatory signaling and pathological remodeling of the extracellular matrix drive cardiac fibrosis and require changes in gene expression. Materials and methods: Using bioinformatics, both tissue-specific expression profiles and epigenomic profiles of some genes critical for cardiac fibrosis were examined, namely, NLRP3, MMP2, MMP9, CCN2/CTGF, AGT (encodes angiotensin II precursors) and hsa-mir-223 (post-transcriptionally regulates NLRP3). Results: In monocytes, neutrophils, fibroblasts, venous cells, liver and brain, enhancers or super-enhancers were found that correlate with high expression of these genes. One enhancer extended into a silent gene neighbor. These enhancers harbored tissue-specific foci of DNA hypomethylation, open chromatin and transcription factor binding. Conclusions: This study identified previously undescribed enhancers containing hypomethylated transcription factor binding subregions that are predicted to regulate expression of these cardiac fibrosis-inducing genes.
Fibrotic disease is estimated to be responsible for almost half of all deaths in the USA [Citation1], and its far-reaching consequences extend to the effects of coronavirus disease 2019 (COVID-19) on disparate tissues and organs [Citation2]. Cardiac fibrosis involves the remodeling of the heart accompanied by the excessive accumulation of extracellular matrix (ECM) proteins due to chronic stress, injury, systemic disease or drugs [Citation3,Citation4]. Because the scar tissue impedes the ability of the heart to pump properly, cardiac fibrosis plays a causative role in many types of heart disease, including atrial fibrillation, heart failure and impaired systolic and diastolic function. The main cell types that contribute to cardiac fibrosis are cardiac fibroblasts, which constitute approximately 70% of the nuclei in the heart; myofibroblasts, which very highly express ECM proteins and are derived from cardiac fibroblasts or infiltrating fibrocytes; cardiomyocytes; cardiac endothelial cells; monocytes; neutrophils; and T cells [Citation4,Citation5].
Epigenetics refers to the inherited changes from cell to cell that involve DNA and chromatin but do not alter the sequence of bases in DNA. Changes in epigenetics, usually histone or DNA modifications, and alterations in the composition and conformation of chromatin provide a kind of cellular memory. This memory is needed for differentiation and, to a lesser extent, for sustained responses to some types of physiological changes [Citation6], including those seen in the heart [Citation7]. Epigenetics is involved in turning genes on or off, up- or down-modulating their levels of expression and maintaining levels of transcription or repression of transcription in normal and diseased tissues [Citation6,Citation8]. The importance of understanding the normal epigenetic modifications of cardiac fibrosis-associated genes is underscored by the involvement of differentiation in fibrosis; namely, transdifferentiation of fibroblasts and fibrocytes to myofibroblasts and inflammation-associated differentiation of monocytes to macrophages [Citation9].
The critical role of epigenetic changes in cardiac fibrosis is beginning to be elucidated [Citation7,Citation9–12]. For example, Williams et al. examined the involvement of histone acetylation/deacetylation, the most extensively studied type of histone modification involved in transcription control, in a mouse model of cardiac fibrosis [Citation3]. They found that the inhibition of histone deacetylase (HDAC) activity targeted to one subclass of HDACs (class I) suppressed cardiac fibrosis. However, effects of HDACs and histone acetylases on cardiac fibrosis can be indirect. Changes in histone acetylation can affect genes specifying cell-signaling proteins or transcription factors (TFs) rather than directly targeting the gene of interest, and non-histone proteins as well as histones can be acetylated or deacetylated by histone acetylases and HDACs [Citation4,Citation13]. In addition to changes in chromatin, disease- and transcription-associated changes in DNA methylation have been found in the promoter regions of fibrosis- and inflammation-related genes and have been proposed to affect levels of gene expression [Citation4,Citation14,Citation15].
Among the major contributors to cardiac fibrosis and related heart disease are the deleterious activation of the autocrine/paracrine renin–angiotensin system, excessive inflammatory signaling from infiltrating monocytes/macrophages and pathological ECM remodeling upon upregulation and transdifferentiation of cardiac fibroblasts or infiltrating fibrocytes [Citation16–18]. In the present study, genes from each of these pathways were chosen to study relationships between tissue-specific epigenetics and transcription and to identify regions in the vicinity of these genes that are candidates for cis-acting elements contributing to gene dysregulation in cardiac fibrosis. These genes are AGT, NLRP3, CCN2/CTGF, MMP2 and MMP9. AGT encodes the precursors of angiotensin II, a fibrosis-inducing growth factor and signaling molecule as well as an endocrine vasoconstrictor [Citation19], which can be expressed by myofibroblasts as well as by the liver and other organs [Citation17]. Angiotensin II participates in one of the pathways for priming and activating NLRP3 inflammasome formation [Citation18] and is a key stimulus for cardiac fibrosis [Citation19]. Activation of NLRP3 inflammasomes, which involves upregulation of NLRP3 gene expression, results in the production of IL-1β and IL-18, and this in turn promotes myofibroblast formation and can also initiate pyroptosis to induce cardiac inflammation. NLRP3 is critical for inflammation associated with many other diseases, including cancer, colitis, gout, type 2 diabetes and neonatal-onset multisystem inflammatory disease, and plays a normal protective role in responding to a wide range of damage signals [Citation20]. NLRP3 protein can also contribute to fibrosis by favoring the epithelial-to-mesenchymal transition in both inflammasome-dependent and -independent pathways [Citation21]. In addition, abnormal NLRP3 inflammasome signaling can lead to arrhythmic sarcoplasmic reticulum Ca2+ release in the heart, which promotes atrial fibrillation [Citation18]. CTGF, the product of the CCN2/CTGF gene, is an autocrine regulator of fibrosis [Citation16] with many disparate cell type-specific effects, including the induction of angiogenesis [Citation22,Citation23]. It upregulates cardiac fibrosis through its stimulation of cardiac fibroblasts, although it is also upregulated in injured cardiomyocytes [Citation16]. MMP2 and MMP9 are closely related type IV collagenases that help shape the ECM and may provoke or ameliorate cardiac fibrosis depending on the context [Citation5].
Despite the importance of these genes to cardiac fibrosis and the major role of enhancers (elements that upregulate promoters in cis) in tissue-specific gene expression [Citation6], analysis of the epigenetics of these genes has been limited mostly to promoter regions [Citation14,Citation23–27]. However, there have been notable exceptions [Citation14,Citation25,Citation28,Citation29]. The current study examined the hypothesis that previously unexamined enhancers and lncRNA genes help drive the tissue-specific and fibrosis-related expression of many genes critical for cardiac fibrosis. This report describes important, and sometimes surprising, epigenetic features within gene bodies and in the gene neighborhoods of five of these protein-coding genes – NLRP3, MMP2, MMP9, CCN2/CTGF and AGT – as well as hsa-mir-223, the gene encoding the precursors of miR-223, an miRNA that post-transcriptionally regulates NLRP3 and controls innate immunity through additional pathways [Citation30,Citation31]. This in-depth comparison of the epigenomics and transcriptomics of genes playing key roles in cardiac fibrosis not only elucidates tissue-specific regulation of their transcription but also identifies enhancer subregions for future studies of their pathogenic dysregulation in cardiac fibrosis and numerous noncardiac diseases.
Methods
Transcriptomics
RNA sequencing (RNA-seq) data for median levels of gene expression (transcripts per million, TPM) in tissues and skin fibroblast cell lines were obtained from the Genotype-Tissue Expression database (GTEx) using median gene expression levels derived from hundreds of samples for each tissue type [Citation32]. For cell cultures, RNA-seq data were obtained from poly(A)+ RNA in color-coded overlays in the figures (ENCODE, Wold laboratory at Caltech; vertical viewing range: 0–8, except for AGT, for which it was 0–12; University of California Santa Cruz [UCSC] Genome Browser, [Citation33]). Quantification of RNA-seq data was as previously described [Citation34]. Strand-specific RNA-seq profiles (ENCODE, Cold Spring Harbor Laboratory [Citation33]) were used to confirm which strand was transcribed and to examine additional cell types (UCSC Genome Browser [Citation33]). Cap analysis of gene expression profiles was obtained from the UCSC Genome Browser [Citation33,Citation35].
Epigenetics
Epigenetic data were obtained from the Roadmap Epigenomics Project [Citation6] downloaded from UCSC Genome Browser hubs (http://genome.ucsc.edu/) [Citation33]. The 25-state chromatin segmentation tracks were used, except for CCN2, for which the 18-state tracks were used because they gave fewer uninformative ‘low-signal’ segments. The original color coding of the Roadmap data for chromatin states was slightly modified, as indicated, to increase the clarity of the figures. The displayed histone acetylation profiles (vertical viewing range: 0 to 10) were the same ones that had been used in determination of chromatin state segmentation [Citation6]. The tissues for chromatin states were from males, except for lung, monocytes, B cells [Citation6,Citation33] and prefrontal cortex (a mixture of 81-year-old male and 75-year-old female samples), and cell cultures were as previously described [Citation34]. DNase I hypersensitivity profiling (vertical viewing range: 0 to 40) and DNA methylation profiling by bisulfite sequencing (bisulfite-seq) usually came from the same samples as those used for the chromatin state [Citation6]. Additional bisulfite-seq profiles for a control and an atherosclerotic aorta sample came from an 88-year-old female [Citation36] and are available at the UCSC Genome Browser (93N and 93A, Zaina-2014, at the DNA methylation hub). Atherosclerosis- and aorta-specific DNA hyper- or hypo-methylation was determined from bisulfite-seq data as previously described [Citation37]. At the UCSC Genome Browser, the monocytes for the bisulfite-seq track are incorrectly labeled as macrophages. Super-enhancer designations were obtained from the dbSUPER website [Citation38] and were checked by visual inspection of histone acetylation tracks at the UCSC Genome Browser.
TF binding profiles
A limited number of whole-genome TF binding profiles obtained by chromatin immunoprecipitation/next-generation sequencing (ChIP-seq) on cell types expressing the genes highlighted in this study are publicly available. The ENCODE 3 [Citation39] TF ChIP-seq peaks provided TF binding data (UCSC Genome Browser [Citation33]).
Results
The inflammasome-associated NLRP3 gene has a super-enhancer mirroring its high & specific expression in monocytes & neutrophils
NLRP3 () encodes a protein that is a limiting factor for activation of NLRP3 inflammasome formation [Citation40], which is important in inflammation-related cardiovascular disease [Citation41]. NLRP3 is expressed at a much higher level in leukocytes (median TPM of 755 samples: 23, GTEx RNA-seq database [Citation32]) than in any of the 52 other examined normal tissues (Supplementary Figure 1). NLRP3 displayed enhancer chromatin () within the gene body and surrounding the gene, specifically in monocytes, neutrophils and lymphocytes; macrophage epigenetic data are not available. Enhancer chromatin had been determined from enrichment in histone H3 lysine 27 acetylation (H3K27ac) plus H3 lysine 4 monomethylation (H3K4me1) [Citation6]. Promoter chromatin () at the main transcription start site (TSS) ( & Supplementary Figure 2A–D) was seen in these leukocytes but also in liver, which had very little NLRP3 RNA (Supplementary Figure 1) and lacked appreciable amounts of enhancer chromatin (). Promoter chromatin had been determined from enrichment in H3K27ac and H3 lysine 4 trimethylation (H3K4me3), instead of the H3K3me1/H3K27ac enrichment that defines enhancer chromatin [Citation6,Citation42]. Importantly, NLRP3 did not display traditional enhancer chromatin in monocytes and neutrophils. Instead, it had a super-enhancer, which is an unusually large, cell type-specific cluster (>3 kb) of enhancer chromatin regions () that is coupled with analogous cell type-specific expression at a high level [Citation38,Citation43]. Super-enhancers can include some promoter chromatin regions.
(A) The main isoform of NLRP3 (chr1: 247, 566, 540–247, 622, 212; Supplementary Figure 2A–D) and the adjacent olfactory gene OR2B11, which is silent in all studied tissues, are shown. Broken arrow indicates the TSS and direction of transcription. (B) Chromatin state segmentation denotes predicted promoter (red), strong enhancer (orange), weak enhancer (yellow), low signal or repressed chromatin or H3K36me3-enriched transcribed chromatin (green). Two monocyte samples are shown for the chromatin state analysis. Blue dashed line indicates super-enhancer in monocytes and neutrophils. (C) DNA methylation profiles (bisulfite-seq). Blue bars denote regions that were significantly hypomethylated relative to the same genome (LMRs); blue highlighting indicates monocyte/macrophage-specific LMRs. (D) Local binding of TFs in the LCL or K562 cells. Blue-green highlighting denotes TF binding at monocyte/macrophage-specific DHS. (E) Open chromatin peaks determined as DHS. Blue highlighting indicates monocyte/macrophage-specific DHS. (F) H3K27ac signal intensity, which is indicative of the strength of the promoter or enhancer chromatin. Blue highlighting denotes monocyte/macrophage-specific enrichment in H3K27ac. There is no CpG island at or near the 5′ end of this gene according to the UCSC Genome Browser. All tracks are from hg19 in the UCSC Genome Browser and are aligned in this and subsequent figures.
Bisulfite-seq: Bisulfite sequencing; DHS: DNase I hypersensitive sites; H3K27ac: H3 lysine 27 acetylation; LCL: Lymphoblastoid cell line; LMRs: Low methylated regions; Rep: Repressed; TF: Transcription factor; TSS: Transcription start site; UCSC: University of California Santa Cruz.
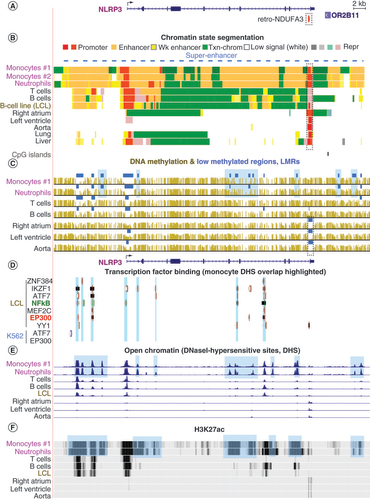
Within the NLRP3 super-enhancer, there were regions of especially low DNA methylation relative to the rest of the same genome (low methylated regions [LMRs]) (, blue horizontal bars) that were specific to monocytes and/or neutrophils. The monocyte/neutrophil-associated LMRs often overlapped myeloid-specific regions of TF binding, open chromatin (DNase I hypersensitive sites [DHS]) and high enrichment in H3K27ac (–F). A promoter subregion containing three CpGs located 0.6 kb upstream of the TSS that was previously shown to be hypomethylated in a monocytic leukemia cell line upon infection with a mycobacterium [Citation14] was less methylated in monocytes than in other samples (Supplementary Figure 2E–I).
B and T cells, like monocytes and neutrophils, were enriched in promoter chromatin at the NLRP3 TSS but had much less enhancer chromatin in and around NLRP3 (). Lymphocytes, liver and lung also displayed poised enhancer/promoter chromatin segments (pink segments) immediately downstream of active promoter chromatin (); these were mixtures of a repressive chromatin mark (H3K27me3) and enhancer- or promoter-associated H3K4me1/me3. B and T cells were reported to have negligible NLRP3 expression unless expression was induced (e.g., by lipopolysaccharide) [Citation44,Citation45]. RNA-seq profiles indicated a low level of expression of NLRP3 in resting B cells and in a B-cell lymphoblastoid cell line (LCL) (GM12878) (Supplementary Figure 2B). Genome-wide profiles of binding by many TFs were available for this LCL and for K562 cells (a myelogenous leukemia cell line) [Citation33,Citation46]. TFs bound in or near open chromatin regions (DHS) in NLRP3 in the LCL but not in the analogous regions in NLRP3-nonexpressing K562 cells (). These TFs include IKZF1, a regulator of hematopoietic cell differentiation; transcriptional activators ATF7 and MEF2C (which is of special importance in myeloid cells [Citation47]); EP300, a histone transacetylase, chromatin remodeling protein and enhancer/super-enhancer binding protein; and the RELB subunit of NFκB. NFκB is a signaling TF that is necessary, but not sufficient, for transcriptional activation of NLRP3 [Citation40]. Many more DHS probably bind EP300 in monocytes and neutrophils than in the weakly NLRP3-expressing lymphoblastoid cells; these TF binding profiles were not available for monocytes or neutrophils.
Surprisingly, the distal (3′) end of NLRP3 displayed promoter chromatin with the histone marks of active (red segments) or poised/repressed (pink segments) promoters in most tissues (). This 3′ promoter chromatin (dotted rectangle) overlapped a retrotransposon-derived gene, retro-NDUFA3, near the end of the last intron ( & B). Only leukocytes had high levels of DNA methylation in this region ( as well as ten additional tissue types that are not shown). These findings suggest that leukocyte-specific DNA methylation repressed most, but not all (Supplementary Figure 2D), of the 3′ promoter activity that would interfere with NLRP3 mRNA formation in monocytes and neutrophils. Given the enhancer chromatin adjacent to the 3′ promoter chromatin in monocytes and neutrophils (), it may be especially important to have local DNA methylation in these cell types. Similarly, the authors had previously demonstrated for CDH15 and PITX3 that DNA hypermethylation specific to tissues expressing these two genes repressed an intragenic 3′ promoter [Citation48]. Downstream of NLRP3 is a gene encoding an OR2B11 () that contains regions of enhancer chromatin in monocytes and neutrophils () despite the negligible expression of OR2B11 in all 53 tissues in the GTEx database. Therefore, the enhancer chromatin in the vicinity of OR2B11 probably upregulates expression of NLRP3.
Genes encoding the other three components of NLRP3 inflammasomes. CASP1 and PYCARD (ASC) were also examined. They displayed DNA hypomethylation and large amounts of enhancer chromatin specifically in monocytes and neutrophils (CASP1) or in leukocytes in general (PYCARD) (Supplementary Figure 3A & B). By contrast, NEK7 showed less tissue specificity in its expression and epigenetics and had a lower level of RNA in leukocytes than in most other tissues (Supplementary Figure 3C). In the methylated subregions that were immediately upstream of the PYCARD and CASP1 promoters, there was enhancer chromatin in monocytes (Supplementary Figure 3A & B). Vento-Tormo et al. found that the differentiation of monocytes was accompanied by DNA hypomethylation in these regions and was associated with gene upregulation [Citation15].
A monocyte- & neutrophil-specific super-enhancer also extends over hsa-miR-223, which downregulates NLRP3 protein production
The miRNA miR-223 is a critical regulator of NLRP3 protein levels that functions by decreasing NLRP3 mRNA stability and translation [Citation30]. It also plays a major role in the differentiation of myeloid cells and is implicated in cancer formation and metastasis [Citation31,Citation49] as well as asthma and chronic obstructive lung disease [Citation50]. The host gene for miR-223 (hsa-mir-223, LINC-223, RP6-159A1.4, MIR223) () [Citation49,Citation51] is transcribed preferentially in leukocytes (TPM: 185) () and at a much higher level than for NLRP3 (TPM: 23) (Supplementary Figure 1A). In addition, hsa-mir-223 displays specificity for an LCL relative to other cell cultures not derived from blood (). This gene is embedded in a 38-kb super-enhancer seen specifically in monocytes and neutrophils (), with less extensive enhancer chromatin in lymphocytes and an LCL. The hsa-mir-223 super-enhancer overlapped pockets of DNA hypomethylation that were most prominent in monocytes and neutrophils () and stopped at the end of the neighboring VSIG4 gene, which has a different tissue specificity.
(A) The hsa-miR-223 gene with two isoforms and its gene neighborhood (chrX: 65, 203, 177-65, 260, 919); its gene structures are from the UCSC gene tracks of the UCSC Genome Browser, rather than the RefSeq tracks, as for all the other genes. CAGE [Citation33,Citation35] and DHS mapping for monocytes indicated that the TSS shown in this figure is the major one for these cells. (B) Tissue expression (bar graph) for hsa-miR-223 from GTEx with selected mean TPM indicated. The colors of the bars and the TPM for all 53 different tissues are given at the GTEx portal (www.gtexportal.org). The thick horizontal line shows the region used for TPM determination. (C) In the first RNA-seq track for cell cultures, the overlaid color-coded signals (log scale) from myoblasts and lung fibroblasts are shown; for the second track, the data are just for K562 cells; the orange line denotes a novel lincRNA gene in K562 cells, and the yellow or green highlighting indicates the hsa-miR-223 region. (D) Chromatin segmentation states are shown with the blue dashed line denoting the super-enhancer in monocytes and neutrophils. A second sample of monocytes from males (not shown) gave a chromatin state segmentation profile similar to that seen for the exhibited female sample. The strong expression of this gene in spleen was not seen for NLRP3, and this gene lacked a super-enhancer in spleen (data not shown). (E) Bisulfite-seq profiles for DNA methylation have blue highlighting over the LMRs seen specifically in monocytes and neutrophils. (F) TF binding to the indicated cells types with blue-green highlighting at TFs that overlap monocyte/neutrophil-specific DHS. (G) Open chromatin peaks determined as DHS. Blue highlighting indicates monocyte/macrophage-specific DHS.
CAGE: Cap analysis of gene expression; DHS: DNase I hypersensitive site; GTEx: Genotype-Tissue Expression; LCL: Lymphoblastoid cell line; lincRNA: Long intergenic non-coding RNA; LMRs: Low methylated regions; PFC: Prefrontal cortex; RNA-seq: RNA sequencing; TF: Transcription factor; TPM: Transcripts per kilobase million; TSS: Transcription start site; UCSC: University of California Santa Cruz.
![Figure 2. The host gene encoding the miRNA miR-223 has a super-enhancer over it that extends far upstream in monocytes and neutrophils. (A) The hsa-miR-223 gene with two isoforms and its gene neighborhood (chrX: 65, 203, 177-65, 260, 919); its gene structures are from the UCSC gene tracks of the UCSC Genome Browser, rather than the RefSeq tracks, as for all the other genes. CAGE [Citation33,Citation35] and DHS mapping for monocytes indicated that the TSS shown in this figure is the major one for these cells. (B) Tissue expression (bar graph) for hsa-miR-223 from GTEx with selected mean TPM indicated. The colors of the bars and the TPM for all 53 different tissues are given at the GTEx portal (www.gtexportal.org). The thick horizontal line shows the region used for TPM determination. (C) In the first RNA-seq track for cell cultures, the overlaid color-coded signals (log scale) from myoblasts and lung fibroblasts are shown; for the second track, the data are just for K562 cells; the orange line denotes a novel lincRNA gene in K562 cells, and the yellow or green highlighting indicates the hsa-miR-223 region. (D) Chromatin segmentation states are shown with the blue dashed line denoting the super-enhancer in monocytes and neutrophils. A second sample of monocytes from males (not shown) gave a chromatin state segmentation profile similar to that seen for the exhibited female sample. The strong expression of this gene in spleen was not seen for NLRP3, and this gene lacked a super-enhancer in spleen (data not shown). (E) Bisulfite-seq profiles for DNA methylation have blue highlighting over the LMRs seen specifically in monocytes and neutrophils. (F) TF binding to the indicated cells types with blue-green highlighting at TFs that overlap monocyte/neutrophil-specific DHS. (G) Open chromatin peaks determined as DHS. Blue highlighting indicates monocyte/macrophage-specific DHS.CAGE: Cap analysis of gene expression; DHS: DNase I hypersensitive site; GTEx: Genotype-Tissue Expression; LCL: Lymphoblastoid cell line; lincRNA: Long intergenic non-coding RNA; LMRs: Low methylated regions; PFC: Prefrontal cortex; RNA-seq: RNA sequencing; TF: Transcription factor; TPM: Transcripts per kilobase million; TSS: Transcription start site; UCSC: University of California Santa Cruz.](/cms/asset/59b3a4fa-421f-4d30-bd6b-34a96fb75646/iepi_a_12324281_f0002.jpg)
The hematopoietic cancer-derived K562 cell line strongly expresses the miR-223 miRNA precursor () and displays a super-enhancer spanning the gene like that of monocytes and neutrophils ). In this super-enhancer is a novel long intergenic non-coding RNA (lincRNA) (, orange line). This lincRNA is likely to be associated with the K562 enhancer activity but is stable, unidirectional (plus-strand RNA-seq; data not shown) and produced in considerable amounts, unlike typical eRNAs, which are short, bidirectional and difficult to detect because of instability [Citation52]. The LCL displayed none of this lincRNA and had less hsa-mir-223-upstream TF binding and open chromatin (, F & G). Among the TFs that bound to multiple sites in the K562 super-enhancer were CEBPB and GATA1, which were previously found to bind to hsa-mir-223 promoter region sequences in K562 cells [Citation51].
Fibrosis-associated MMP9 & MMP2 genes display very different tissue-specific expression & epigenetic profiles
MMP2 and MMP9 () are paralogous genes that encode related matrix metalloproteinases. They are critically involved in cardiac fibrosis and cardiovascular disease, and the levels of their processed protein products must be carefully balanced with those of tissue inhibitors of metalloproteinases [Citation5]. MMP2 and MMP9 have very different tissue specificities. MMP9 is expressed preferentially in leukocytes (TPM: 550) (Supplementary Figure 1B), whereas MMP2 is highly expressed in a broad spectrum of tissues (e.g., skin, aorta, lung and adipose) and in various progenitor cell types, including skin and lung fibroblasts (TPM: 909) (Supplementary Figure 1C & Supplementary Table 1). Curiously, MMP2 as well as CCN2/CTGF and AGT displayed much higher expression in the right atrial appendage than in the left ventricle (Supplementary Figure 1C–E), the only two regions of the heart with expression data in the GTEx database.
(A) MMP9 (chr20: 44, 615, 045-44, 646, 541) and (B)MMP2 (chr16: 55, 503, 063-55, 541, 196). In (A), SLC12A5-AS1 is an ncRNA gene that displays low expression with a tissue profile that is a mixture of that of MMP9 and SLC12A5 (brain-specific) but more like that of MMP9 [Citation32]. In (B), the broken arrow is the TSS that CAGE profiles [Citation33,Citation35] indicate is predominantly used in the examined cell cultures. (A) and (B) show RNA-seq profiles with color-coded expression levels (log scale; two overlaid profiles for MMP9) followed by chromatin state tracks with a blue-dashed line over the neutrophil or the skin/lung fib super-enhancers. In (B), red dotted boxes indicate a subregion (referenced in the Discussion) that displays enhancer chromatin in skin fib and adipose tissue. Both panels show DNA methylation profiles with blue bars denoting regions that are significantly hypomethylated relative to the same genome (LMRs) and blue highlighting for regions that are hypomethylated specifically in monocytes, neutrophils, or epidermis. The purple arrow in (B) indicates a subregion (referenced in Discussion) that is highly methylated in heart and most tissues. (A) and (B) also display TF binding in the indicated cell cultures with the blue-green highlighting denoting overlap with DHS specific for leukocytes or fib/keratinocytes. Lastly, DHS are shown with blue highlighting for leukocyte- or fib/keratinocyte-specific peaks.
Bival pr (purple segments): Bivalent (repressed or weak) promoter chromatin containing H3K4me3 and much H3K27me3; CAGE: Cap analysis of gene expression; DHS: DNase I hypersensitive sites; fib: Fibroblasts; LCL: Lymphoblastoid cell line; LMR: Low methylated region; TSS: Transcription start site; TF: Transcription factor.
![Figure 3. MMP9 has a super-enhancer in neutrophils, whereas MMP2 has one in skin and lung fibroblasts. (A) MMP9 (chr20: 44, 615, 045-44, 646, 541) and (B)MMP2 (chr16: 55, 503, 063-55, 541, 196). In (A), SLC12A5-AS1 is an ncRNA gene that displays low expression with a tissue profile that is a mixture of that of MMP9 and SLC12A5 (brain-specific) but more like that of MMP9 [Citation32]. In (B), the broken arrow is the TSS that CAGE profiles [Citation33,Citation35] indicate is predominantly used in the examined cell cultures. (A) and (B) show RNA-seq profiles with color-coded expression levels (log scale; two overlaid profiles for MMP9) followed by chromatin state tracks with a blue-dashed line over the neutrophil or the skin/lung fib super-enhancers. In (B), red dotted boxes indicate a subregion (referenced in the Discussion) that displays enhancer chromatin in skin fib and adipose tissue. Both panels show DNA methylation profiles with blue bars denoting regions that are significantly hypomethylated relative to the same genome (LMRs) and blue highlighting for regions that are hypomethylated specifically in monocytes, neutrophils, or epidermis. The purple arrow in (B) indicates a subregion (referenced in Discussion) that is highly methylated in heart and most tissues. (A) and (B) also display TF binding in the indicated cell cultures with the blue-green highlighting denoting overlap with DHS specific for leukocytes or fib/keratinocytes. Lastly, DHS are shown with blue highlighting for leukocyte- or fib/keratinocyte-specific peaks.Bival pr (purple segments): Bivalent (repressed or weak) promoter chromatin containing H3K4me3 and much H3K27me3; CAGE: Cap analysis of gene expression; DHS: DNase I hypersensitive sites; fib: Fibroblasts; LCL: Lymphoblastoid cell line; LMR: Low methylated region; TSS: Transcription start site; TF: Transcription factor.](/cms/asset/c3717488-455b-4dc7-8e7d-7d0858b8bceb/iepi_a_12324281_f0003.jpg)
Super-enhancers were found in neutrophils and skin fibroblasts/lung fibroblasts for MMP9 and MMP2, respectively ( & B), consistent with their high expression in these cell types. MMP9 displayed more DNA hypomethylation and stronger DHS in monocytes and neutrophils than in B cells or the B cell LCL (), consistent with cell type-specific differences in the extent of enhancer chromatin. Available TF binding profiles for MMP9 in the LCL and MMP2 in a lung fibroblast cell strain showed that most of the TF binding was again in expression-associated DHS ( & B). In the case of MMP2, tissue-specific DNA hypomethylation was most prominent in skin epidermis, for which no chromatin state profile is available. This could be related to the high level of MMP2 expression in skin tissue (epidermal plus dermal layers) (Supplementary Figure 1). Although both skin and aorta exhibited very high levels of MMP2 expression, skin displayed much more DNA hypomethylation than the aorta (), suggesting that different epigenetic strategies are sometimes used for maintaining similarly high levels of tissue-specific expression of a given gene. Heart failure-linked DNA hypomethylation was previously found [Citation25] near MMP2 () and CCN2, as discussed later.
The liver-specific expression of AGT matches its tissue-specific epigenetic profiles
AGT (), a gene with critical functions in regulating blood pressure and vascular remodeling, is expressed highest in liver (Supplementary Figure 1E). Accordingly, liver and HepG2 cells displayed the most intra- and intergenic promoter and enhancer chromatin and DNA hypomethylation (, dotted boxes). The frontal cortex of the brain and left ventricle of the heart, which had high levels of AGT RNA (TPM: 156 and 76, respectively), although not as high as the liver (TPM: 1006), exhibited considerable intra- and intergenic AGT enhancer chromatin but less than that seen for liver (). Similarly, many TF binding sites were observed throughout the gene and far upstream in liver and HepG2 cells that overlapped open chromatin sites (). In brain, liver and HepG2, there was additional enhancer and promoter chromatin overlapping the gene body of AGT‘s nearest upstream neighbor, CAPN9, which encodes a cysteine protease. The enhancer profile at CAPN9 paralleled the strong expression of AGT in these tissues but was at odds with the negligible expression of CAPN9 [Citation32] in these samples and did not correlate with expression of any other nearby gene. These findings suggest that the enhancer chromatin at the 5′ end of CAPN9 in the liver and brain is upregulating its neighbor, AGT, rather than itself.
(A) AGT (chr1: 230, 835, 715-230, 892, 908) and (B)CCN2/CTGF (chr6: 132228520-132613558). (A) and (B) display RNA-seq profiles with overlaid color-coded expression levels for the two indicated cell cultures; the overlay of blue signal from HUVEC and pink signal from lung fib shows up as dark purple at CCN2. (A) and (B) show chromatin state tracks with black dotted boxes in (A) denoting enhancer/promoter chromatin regions that are specific for liver and HepG2, a liver cancer cell line and the dashed blue line in (B) indicating the super-enhancers in HUVEC. The DNA methylation profiles in (A) and (B) have blue bars denoting regions that are significantly hypomethylated relative to the same genome (LMRs); red dotted boxes in (A) indicate liver-specific DNA hypomethylation. (B) Statistically significant regions of DNA hypermethylation or hypomethylation are shown as red lollipops for hypermethylated DMRs and blue lollipops for hypomethylated DMRs; DMRs were determined by comparison of bisulfite-seq data from an atherosclerotic aorta sample versus three control aorta samples or control aorta versus five other control tissues (heart, skeletal muscle, lung, adipose and monocytes). In (A) and (B), bisulfite-seq tracks are illustrated; light blue highlighting in (B) indicates profiles from control and atherosclerotic aorta samples; purple arrow in (B), a small region that is mostly unmethylated in aorta but highly methylated in heart (referenced in Discussion). (A) Displays TF binding to the indicated samples and (B) shows a chromatin looping profile (Hi-C method) for HUVEC. Lastly, DHS are shown for both panels.
Atheroscl: Atherosclerosis; bisulfite-seq: Bisulfite sequencing; ctl: Control; DMRs: Differentially methylated regions; DHS: DNase I hypersensitive sites; fib: Fibroblasts; HUVEC: Human umbilical vein endothelial cells; RNA-seq; RNA sequencing.
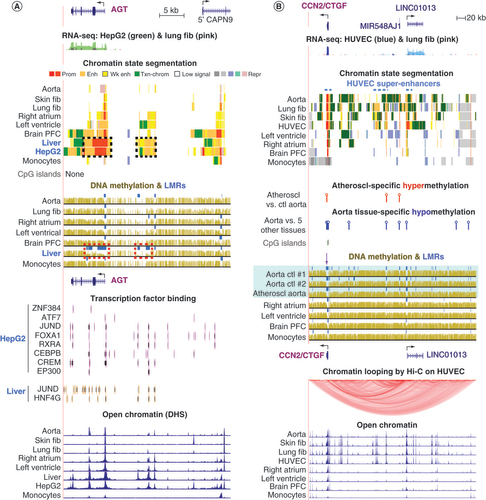
Preferential expression of CCN2/CTGF in aorta is accompanied by enhancer chromatin & DNA hypomethylation at far upstream LINC01013
CCN2/CTGF () is involved in many aspects of development, including angiogenesis, and homeostasis as well as disease (e.g., myocardial infarction, atherosclerosis, hypertension and cancer [Citation22,Citation23]). Among tissues, it is most highly expressed in the aorta (TPM: 2043) as well as in many types of cell cultures, including skin fibroblasts (TPM: 909), lung fibroblasts, chondrocytes and human umbilical vein endothelial cells (HUVEC) (, Supplementary Figures 1D & 4, & Supplementary Table 1). This high expression was accompanied by multiple regions of enhancer chromatin, open chromatin and TF binding within a 350-kb region upstream of CCN2 that includes several ncRNA genes (, Supplementary Figures 4 & 5). The especially high expression of CCN2 in HUVECs (Supplementary Table 1) was associated with high expression of LINC01013, a little-studied lincRNA gene far upstream of CCN2 ( & Supplementary Figure 4). Coordinate expression of LINC01013 and CCN2 was previously observed in HUVEC after stimulation of the angiogenesis program genes in vitro with VEGFA [Citation53]. The only other cell types expressing this ncRNA were chondrocytes (Supplementary Figure 4). Little else is known about LINC01013 except that it can repress chondrogenesis [Citation54] and that it is associated with cancer progression [Citation55]. Profiles of higher-order looping domains (topologically associating domains) in this neighborhood gave evidence for a loop between CCN2 and the immediate upstream region of LINC01013 in HUVEC (; [Citation33,Citation56]) but not in an LCL (data not shown), which has negligible expression of LINC01013 (Supplementary Table 1). Therefore, the evidence supports the hypothesis that transcription of LINC01013 upregulates CCN2 in HUVEC. However, coordinate expression between CCN2 and LINC01013 was seen only in HUVEC and chondrocytes and not in any examined tissue, including the aorta [Citation32]. Therefore, any linkage of expression of these two genes is restricted to only some CCN2-expressing cell types.
The very high expression of CCN2 in aorta was accompanied by less enhancer chromatin and weaker DHS in this region than that seen in HUVEC or lung fibroblasts. HUVEC displayed three super-enhancers in this gene neighborhood, namely, over CCN2, at LINC01013 and in an intergenic region () . However, no super-enhancer was found in aorta. In interpreting the relationship between the GTEx-based expression of this gene and the Roadmap-based enhancer chromatin, the authors considered the possibility that CCN2/CTGF expression in GTEx samples was biased upward because approximately 38% of the hundreds of GTEx aorta samples were from individuals aged >60 years. By contrast, the donor for the aorta chromatin state and DNA methylation analysis and for many other Roadmap samples [Citation6] was a 34-year-old male. However, this was not a problematic comparison because when GTEx data was stratified by age for expression of CCN2/CTGF in aorta, the median values for expression of CCN2/CTGF for 59 donors between 20 and 49 years old were not significantly different from those for 42 donors between 50 and 79 years old.
One of the biggest differences between the epigenetics of the CCN2 gene neighborhood in the aorta and in other less highly expressing tissues was the presence of aorta-associated DNA hypomethylation. There were many aorta-specific LMRs near CCN2 or far upstream of the gene that showed statistically significant DNA hypomethylation in aorta versus the set of heart, lung, skeletal muscle and monocyte samples (, blue lollipops). Several of these LMRs overlapped aorta/HUVEC/fibroblast-associated DHS. Bisulfite-seq DNA methylation profiles were available for one sample from the 34-year-old Roadmap control aorta and for control and atherosclerotic samples from an 88-year-old female (). The control sample from the 88-year-old female was a normal-appearing thoracic aorta, and the other sample from the same donor was a section of atherosclerotic aortic arch. Similar distinctive patterns of DNA hypomethylation were seen in all examined aorta samples. There was a small but significant amount of DNA hypermethylation in the atherosclerotic aorta versus the control aorta samples in the vicinity of CCN2 or LINC01013 (, red lollipops). Similarly, it has been previously shown [Citation36,Citation37] that throughout the genome there are many more hypermethylated than hypomethylated DNA regions in atherosclerotic versus control aortas. It remains to be determined whether there are decreases in enhancer or promoter chromatin in some atherosclerosis-associated hypermethylated DNA regions.
Discussion
The fibrosis-related protein-coding genes, NLRP3, MMP2, MMP9, CCN2/CTGF and AGT, are upregulated in the following diverse pathologies: cardiac fibrosis and atherosclerosis [Citation18,Citation19,Citation23], liver and lung fibrosis [Citation23,Citation26,Citation57], sarcoidosis [Citation58], rheumatoid arthritis and osteoarthritis [Citation26], many types of cancer [Citation23,Citation24,Citation59], age-related increased susceptibility to vascular disease [Citation60] or lethality from COVID-19 [Citation2] and SARS-CoV-2 infection-induced cytokine ‘storms’ [Citation61]. The precise control of transcription of these genes is important because they can participate in restorative as well as pathological repair [Citation62] or inflammation [Citation18]. Age-related susceptibility to fibrosis and fibrosis-associated cardiovascular disease can be driven, in part, by age-related build-up of epigenetic mistakes in key genes [Citation8]. Some of these mistakes might help abnormally upregulate expression of the studied genes, which are usually overexpressed rather than downregulated in disease. Despite the central role of epigenetics and, especially, enhancers in gene regulation [Citation43,Citation52], prior to this study, examination of the epigenetics of these genes have been limited.
By using diverse whole-genome epigenetic profiles rather than just data from locus-specific studies [Citation6], the present study extended previous descriptions [Citation25,Citation28,Citation29,Citation63] of transcription-regulatory chromatin at AGT, CCN2/CTGF and MMP2 and described enhancer chromatin for NLRP3 for the first time. This analysis revealed that the examined cardiac fibrosis-associated genes, NLRP3, MMP2, MMP9, CCN2/CTGF and the NLRP3 mRNA-regulatory hsa-miR-223, have previously undescribed super-enhancers (clusters of traditional enhancers) containing foci of DNA hypomethylation, open chromatin and TF binding that probably help drive the high tissue-specific expression of these genes. Super-enhancers at other genes have been implicated in cardiovascular disease [Citation11,Citation64]. AGT, the other examined fibrosis-related gene, has traditional enhancer chromatin as well as elongated promoter chromatin that can account for its very high expression in the liver. Although enhancers are often thought of as upstream or downstream of genes, all six genes contained some of their enhancer chromatin in the gene body. Such intragenic enhancer regions might facilitate rapid transcription elongation as well as potentiate promoters, their better known role [Citation65].
A limitation of this study is that it relied on just bioinformatics and therefore requires experimental follow-up. However, most of the new findings involved identification of super-enhancers and their epigenetic and transcription correlates. Because of their large sizes (11–55 kb for the super-enhancers identified in this study), super-enhancers are usually identified only by bioinformatics [Citation38]. Moreover, previous assignments of tissue-specific enhancer chromatin using these same histone modification-based algorithms have shown excellent concordance between tissue-specific enhancer chromatin assignments and demonstrated tissue-specific enhancer activity [Citation42]. Another caveat to the present study is that the comparison of epigenetic and transcription profiles relies on steady-state mRNA levels, which depend, in part, upon factors affecting the stability of the RNA (especially miRNAs recognizing the 3′ ends of specific mRNAs) and, thereby, the measured mRNA levels. However, miRNA-targeted degradation of mRNAs usually only fine-tunes levels of target mRNAs, typically about twofold [Citation66]. Nonetheless, such fine-tuning can have important biological consequences, and more than one miRNA can target an mRNA. For example, miR-223, which is encoded by the hsa-miR-223 gene (), targets NLRP3 mRNA as well as mRNAs encoding inflammation-related signaling proteins and TFs; downregulates healing of slow-healing wounds; upregulates granulopoiesis; downmodulates monocytic/macrophage differentiation; regulates the innate immune response in chronic obstructive pulmonary disease and asthma; and can affect cell viability, proliferation and invasion in carcinogenesis [Citation50,Citation51,Citation67].
Both miR-223 and TTP, an RNA-binding protein that reduces levels of NLRP3 mRNA, specifically target a long-form polyadenylation variant and not the variant with a shorter 3′ untranslated region [Citation68]. Importantly, there are similar amounts of both NLRP3 RNA isoforms in macrophages, which were not analyzed in this study because of a lack of available epigenome profiles. The short-form variant is the predominant one in monocytes [Citation68]. The distribution of isoforms is not available for neutrophils, but the impact of miR-223 on the amount and functionality of NLRP3 is well established [Citation30,Citation31,Citation58,Citation69,Citation70]. Both NLRP3 and the host gene for miR-223, which are most highly expressed in leukocytes, had super-enhancers specifically in monocytes and neutrophils ( & ). The upregulation of NLRP3 transcription as well as the downregulation of the activity of many NLRP3-targeting miRNAs, including miR-223, drives inflammasome activation in neutrophils and monocytes/macrophages in response to a priming trigger [Citation27,Citation30,Citation40,Citation50]. The major transcript from the miR-223 host gene, hsa-mir-223/LINC-223, is much more highly expressed in leukocytes than is NLRP3 and functions as a sponge or ceRNA [Citation71], in addition to being a precursor for miR-223. Sponge RNAs have critical roles in downregulating miRNA activity [Citation72]. NLRP3 is also regulated by alternative splicing of its mRNA [Citation73], and its protein is subject to ubiquitylation, sumoylation and phosphorylation [Citation74]. The multiplicity of controls on this key inflammasome-forming protein indicates how important its precise levels are for its roles in innate immunity, inflammation and disease [Citation18,Citation74].
The findings in the present study further elucidate previously reported disease-related epigenetic changes in several of the studied genes. A subregion 1.4 kb upstream of the distal TSS of MMP2 was shown by Glezeva et al. to be hypomethylated in left ventricle samples from heart failure patients relative to analogous control samples [Citation25]. A disease-linked increase (almost threefold) in expression of MMP2 accompanied this hypomethylation. Glezeva et al. had notated this 0.5-kb region as one without regulatory function. As reported here, this region was highly methylated in heart and most other tissues but overlapped strong enhancer chromatin in skin fibroblasts and adipose tissue (, purple arrow and dotted boxes), both of which highly express this gene. Therefore, the present analysis of tissue-specific epigenetics in this region supports the importance of the MMP2 findings. Glezeva et al. also found that heart failure was associated with significant DNA hypomethylation in a 1 kb subregion 0.3 kb downstream of the 3′ end of CCN2/CTGF and approximately threefold upregulation of this gene’s expression. This DNA region is highly methylated and does not overlap enhancer or promoter chromatin in heart samples (, purple arrow). By contrast, it is mostly unmethylated and overlaps promoter or enhancer chromatin and expression-linked peaks of open chromatin in aorta and lung fibroblasts ( & Supplementary Figure 5). Therefore, the disease-associated hypomethylation at CCN2 in heart failure described by Glezeva et al. might signify disease-related enhancer formation downstream of CCN2.
CCN2/CTGF and its cancer-related neighbor, the ncRNA gene LINC01013 [Citation55], which is 182 kb upstream, provide a likely example of long-distance transcription-regulatory interactions spanning genes specifically in HUVEC and chondrocytes. It was previously shown that this gene/lincRNA-gene pair exhibits parallel changes in expression after exposure of HUVEC to VEGFA [Citation53]. Although such associations need not imply causality [Citation75], enhancer chromatin, open chromatin and chromatin looping profiles in HUVEC suggest such causality (). Evidence for a cis gene–gene interaction for AGT came from the finding of extensive enhancer chromatin overlapping its upstream neighbor CAPN9, specifically in the liver and brain (). In these tissues, CAPN9 is repressed, whereas AGT is very highly expressed. These findings can be most easily explained by AGT, in effect, usurping enhancer elements at the 5′ end of CAPN9 for its own purposes.
Despite only limited amounts of genome-wide data being available for TF binding, the authors found that some important TFs or cofactors bound to transcription regulatory elements in cells expressing these genes. For example, CCN2/CTGF, whose promoter binds the histone acetyltransferase coactivator EP300 in response to TGFβ signaling in mouse fibroblasts [Citation76], also binds this protein at far upstream and downstream enhancer chromatin within open chromatin in HepG2 cells (Supplementary Figure 5). Therefore, future experiments should test the likely hypothesis that the effects of TGFβ signaling on CCN2 expression involve enhancer as well as promoter upregulation mediated by EP300. Similarly, many studies show that NFκB is important for the induction of transcription of NLRP3 in response to pathogen-associated molecular patterns, but reports of NFκB binding to the NLRP3 gene region have described only the NLRP3 promoter and immediate upstream region [Citation40,Citation57]. In a B-cell LCL, multiple NFκB binding sites were found in subregions of open chromatin in the body of the NLRP3 gene, in its promoter region and far upstream ( & E). The LCL expresses this gene only weakly. Importantly, these sites displayed much stronger peaks of open chromatin in NLRP3-highly expressing monocytes and neutrophils. These findings indicate the likelihood that there are yet more and stronger TF binding sites in these myeloid cells, which should be experimentally verified. The examined liver samples in this study had barely detectable expression of NLRP3 RNA, no NLRP3-associated enhancer chromatin and only some promoter chromatin at the TSS. However, NLRP3 expression can be induced in the liver upon inflammatory stimulation [Citation57]. A comparison of NLRP3 enhancer/promoter chromatin versus expression levels in various tissues ( and ) showed that amounts of enhancer chromatin were a better predictor of NLRP3 expression than were the amounts of promoter chromatin. Therefore, induction of NLRP3 expression in liver probably involves the acquisition of monocyte/macrophage-like intra- and inter-genic enhancer chromatin.
Conclusion
Our study shows the importance of extending epigenetic studies of pathogenic samples to include intragenic and far distal enhancers as well as super-enhancers. By examining the epigenetics of whole gene neighborhoods, we obtained novel insights into regulation of these genes during normal development. This study’s evidence for super-enhancers at most of the examined genes, dense clusters of TF binding sites at these super-enhancers and long-distance gene–gene interactions provides new insights that might empower the development of drugs aimed at modulating abnormal expression of these critical fibrosis-related genes.
Future perspective
Our bioinformatics-based findings of transcription regulatory elements for six genes intimately involved in cardiac fibrosis and fibrosis in general could lead to development of new diagnostic tools and potentially therapies upon experimental confirmation. Subregions of super-enhancers and the smaller traditional enhancer chromatin segments we identified should be tested in cell culture not only for their strongly predicted tissue-specific enhancer activity but also for the role of binding of our identified TFs in this activity. The examined lincRNA genes far upstream of CCN2 and hsa-miR-223 should also be tested in cell culture experiments for their ability to regulate these gene neighbors. Subsequently, a search for possible pathogenesis-associated epigenetic changes in the previously overlooked enhancer subregions associated with these genes could be conducted. Three of the genes we studied, NLRP3, hsa-mir-223 and MMP9, have the advantage that they can be examined in blood cells, which are the main normally expressing cell types, and so can be obtained by noninvasive clinical sampling. NLRP3 and miR-223, its post-transcriptional regulator, play central roles in disease, e.g., inflammation, fibrosis, COVID-19-induced cytokine storms, wound healing and cancer. Therefore, the epigenetics and transcription of their encoding genes should be examined in disease versus control cells, not just at promoter regions but also at key enhancer subregions elucidated in the present study. LINC-223/hsa-miR-223 RNA, the precursor of NLRP3 mRNA-targeting miR-223, should be studied for its possible function as a sponge RNA in normal and diseased myeloid cells, a role described for it in myeloid leukemia [Citation71]. Similarly, fibrosis-associated MMP9, MMP2, AGT and CCN2/CTGF should be examined to address the critical question of how much of their pathogenic dysregulation is due to altered function of enhancers versus promoters. The future is bright for developing targeted epigenetic therapies or novel diagnostic or prognostic tools based on the results of such extensions of the present analysis.
Highly cell type- or tissue-specific profiles of enhancer chromatin were found for six genes playing major roles in cardiac fibrosis.
These genes are NLRP3 (inflammation-inducing), hsa-mir-223 (post-transcriptionally regulating NLRP3), MMP2 and MMP9 (extracellular matrix remodeling), CCN2/CTGF (fibrosis-regulating) and AGT (fibrosis-inducing).
These genes’ newly reported enhancer profiles help explain their highly tissue-specific expression profiles.
Within the bodies of all six genes, there was cell type- or tissue-specific enhancer chromatin.
Five of the six genes have overlapping super-enhancers in highly expressing cell types or tissues.
Distant intergenic enhancer chromatin or enhancer chromatin over a repressed gene neighbor correlated with high expression for several of these genes.
Enhancers/super-enhancers contained foci of DNA hypomethylation, open chromatin and transcription factor binding.
These foci are likely drivers of high tissue-specific expression of their associated gene and should be examined for their potential role in promoting fibrosis.
Data sharing statement
Publicly available databases were used for this research.
Supplemental Material
Download MS Word (296.5 KB)Supplementary data
To view the supplementary data that accompany this paper please visit the journal website at: www.tandfonline.com/doi/suppl/10.2217/epi-2020-0446
Financial & competing interests disclosure
This research was supported in part by U54 GM104940 from the National Institute of General Medical Sciences of the NIH, which funds the Louisiana Clinical and Translational Science Center (S Chandra), and the Tulane Cancer Center (M Ehrlich) as well as by high performance computing services provided by Information Technology at Tulane University, New Orleans, LA, USA. Financial support for S Chandra came from the Cardiac Arrhythmia Fund, a gift made possible through the Headington Foundation. The authors have no other relevant affiliations or financial involvement with any organization or entity with a financial interest in or financial conflict with the subject matter or materials discussed in the manuscript apart from those disclosed.
No writing assistance was utilized in the production of this manuscript.
Additional information
Funding
References
- Wynn TA . Fibrotic disease and the T(H)1/T(H)2 paradigm. Nat. Rev. Immunol.4(8), 583–594 (2004).
- Lara PC , Macias-VerdeD , Burgos-BurgosJ. Age-induced NLRP3 inflammasome over-activation increases lethality of SARS-CoV-2 pneumonia in elderly patients. Aging Dis.11(4), 756–762 (2020).
- Williams SM , Golden-MasonL , FergusonBSet al. Class I HDACs regulate angiotensin II-dependent cardiac fibrosis via fibroblasts and circulating fibrocytes. J. Mol. Cell Cardiol.67, 112–125 (2014).
- Grimaldi V , DePascale MR , ZulloAet al. Evidence of epigenetic tags in cardiac fibrosis. J. Cardiol.69(2), 401–408 (2017).
- Fan D , TakawaleA , LeeJ , KassiriZ. Cardiac fibroblasts, fibrosis and extracellular matrix remodeling in heart disease. Fibrogenesis Tissue Repair5(1), 15 (2012).
- Kundaje A , MeulemanW , ErnstJet al. Integrative analysis of 111 reference human epigenomes. Nature518(7539), 317–330 (2015).
- Papait R , SerioS , CondorelliG. Role of the epigenome in heart failure. Physiol. Rev.100(4), 1753–1777 (2020).
- Ehrlich M . DNA hypermethylation in disease: mechanisms and clinical relevance. Epigenetics14(12), 1141–1163 (2019).
- Felisbino MB , MckinseyTA. Epigenetics in cardiac fibrosis: emphasis on inflammation and fibroblast activation. JACC Basic Transl. Sci.3(5), 704–715 (2018).
- Al-Hasani K , MathiyalaganP , El-OstaA. Epigenetics, cardiovascular disease, and cellular reprogramming. J. Mol. Cell. Cardiol.128, 129–133 (2019).
- Alexanian M , PadmanabhanA , MckinseyTA , HaldarSM. Epigenetic therapies in heart failure. J. Mol. Cell. Cardiol.130, 197–204 (2019).
- Tao H , SongZY , DingXS , YangJJ , ShiKH , LiJ. Epigenetic signatures in cardiac fibrosis, special emphasis on DNA methylation and histone modification. Heart Fail. Rev.23(5), 789–799 (2018).
- Lyu X , HuM , PengJ , ZhangX , SandersYY. HDAC inhibitors as antifibrotic drugs in cardiac and pulmonary fibrosis. Ther. Adv. Chronic Dis.10, 10.1177/2040622319862697 (2019).
- Wei M , WangL , WuTet al. NLRP3 activation was regulated by DNA methylation modification during Mycobacterium tuberculosis infection. Biomed. Res. Int.2016, 10.1155/2016/4323281 (2016).
- Vento-Tormo R , Alvarez-ErricoD , Garcia-GomezAet al. DNA demethylation of inflammasome-associated genes is enhanced in patients with cryopyrin-associated periodic syndromes. J. Allergy Clin. Immunol.139(1), 202–211.e6 (2017).
- Dorn LE , PetrosinoJM , WrightP , AccorneroF. CTGF/CCN2 is an autocrine regulator of cardiac fibrosis. J. Mol. Cell. Cardiol.121, 205–211 (2018).
- Travers JG , KamalFA , RobbinsJ , YutzeyKE , BlaxallBC. Cardiac fibrosis: the fibroblast awakens. Circ. Res.118(6), 1021–1040 (2016).
- Pinar AA , ScottTE , HuuskesBM , TapiaCaceres FE , Kemp-HarperBK , SamuelCS. Targeting the NLRP3 inflammasome to treat cardiovascular fibrosis. Pharmacol. Ther.209, 10.1016/j.pharmthera.2020.107511 (2020).
- Vukelic S , GriendlingKK. Angiotensin II, from vasoconstrictor to growth factor: a paradigm shift. Circ. Res.114(5), 754–757 (2014).
- Poudel B , GurungP. An update on cell intrinsic negative regulators of the NLRP3 inflammasome. J. Leukoc. Biol. doi:10.1002/JLB.3MIR0917-350R (2018).
- Alyaseer AaA , DeLima MHS , BragaTT. The role of NLRP3 inflammasome activation in the epithelial to mesenchymal transition process during the fibrosis. Front. Immunol.11, 883 (2020).
- Chaqour B . Caught between a “Rho” and a hard place: are CCN1/CYR61 and CCN2/CTGF the arbiters of microvascular stiffness?J. Cell Commun. Signal.14(1), 21–29 (2020).
- Ramazani Y , KnopsN , ElmonemMAet al. Connective tissue growth factor (CTGF) from basics to clinics. Matrix Biol.68–69, 44–66 (2018).
- Labrie M , St-PierreY. Epigenetic regulation of MMP-9 gene expression. Cell. Mol. Life Sci.70(17), 3109–3124 (2013).
- Glezeva N , MoranB , CollierPet al. Targeted DNA methylation profiling of human cardiac tissue teveals novel epigenetic traits and gene deregulation across different heart failure patient subtypes. Circ. Heart Fail.12(3), e005765 (2019).
- He J , QinM , ChenYet al. Epigenetic regulation of matrix metalloproteinases in inflammatory diseases: a narrative review. Cell Biosci.10, 86 (2020).
- Poli G , FabiC , BelletMMet al. Epigenetic mechanisms of inflammasome regulation. Int. J. Mol. Sci.21(16), 5758 (2020).
- Nibu Y , TakahashiS , TanimotoK , MurakamiK , FukamizuA. Identification of cell type-dependent enhancer core element located in the 3′-downstream region of the human angiotensinogen gene. J. Biol. Chem.269(46), 28598–28605 (1994).
- Fan LQ , HardyDO , CatterallJF , ZhaoJ , LiSX. Identification and characterization of an androgen-responsive Kap promoter enhancer located in the intron II region of human angiotensinogen gene. J. Steroid Biochem. Mol. Biol.119(3–5), 135–140 (2010).
- Haneklaus M , GerlicM , Kurowska-StolarskaMet al. Cutting edge: miR-223 and EBV miR-BART15 regulate the NLRP3 inflammasome and IL-1beta production. J. Immunol.189(8), 3795–3799 (2012).
- Yuan X , BergN , LeeJWet al. MicroRNA miR-223 as regulator of innate immunity. J. Leukoc. Biol.104(3), 515–524 (2018).
- GTEx Consortium . The genotype-tissue expression (GTEx) pilot analysis: multitissue gene regulation in humans. Science348(6235), 648–660 (2015).
- Rosenbloom KR , ArmstrongJ , BarberGPet al. The UCSC Genome Browser database: 2015 update. Nucleic Acids Res.43(Database issue), D670–D681 (2015).
- Tsumagari K , BaribaultC , TerragniJet al. Early de novo DNA methylation and prolonged demethylation in the muscle lineage. Epigenetics8(3), 317–332 (2013).
- Kodzius R , KojimaM , NishiyoriHet al. CAGE: cap analysis of gene expression. Nat. Methods3(3), 211–222 (2006).
- Zaina S , HeynH , CarmonaFJet al. DNA methylation map of human atherosclerosis. Circ. Cardiovasc. Genet.7(5), 692–700 (2014).
- Lacey M , BaribaultC , EhrlichKC , EhrlichM. Atherosclerosis-associated differentially methylated regions can reflect the disease phenotype and are often at enhancers. Atherosclerosis280, 183–191 (2019).
- Khan A , ZhangX. dbSUPER: a database of super-enhancers in mouse and human genome. Nucleic Acids Res.44(D1), D164–D171 (2016).
- Consortium EP , SnyderMP , GingerasTRet al.Perspectives on ENCODE. Nature583(7818), 693–698 (2020).
- Bauernfeind FG , HorvathG , StutzAet al. Cutting edge: NF-kappaB activating pattern recognition and cytokine receptors license NLRP3 inflammasome activation by regulating NLRP3 expression. J. Immunol.183(2), 787–791 (2009).
- Wang Y , LiuX , ShiHet al. NLRP3 inflammasome, an immune-inflammatory target in pathogenesis and treatment of cardiovascular diseases. Clin. Transl. Med.10(1), 91–106 (2020).
- Ernst J , KheradpourP , MikkelsenTSet al. Mapping and analysis of chromatin state dynamics in nine human cell types. Nature473(7345), 43–49 (2011).
- Whyte WA , OrlandoDA , HniszDet al. Master transcription factors and mediator establish super-enhancers at key cell identity genes. Cell153(2), 307–319 (2013).
- Guarda G , ZengerM , YazdiASet al. Differential expression of NLRP3 among hematopoietic cells. J. Immunol.186(4), 2529–2534 (2011).
- Bruchard M , RebeC , DerangereVet al. The receptor NLRP3 is a transcriptional regulator of TH2 differentiation. Nat. Immunol.16(8), 859–870 (2015).
- Wang J , ZhuangJ , IyerSet al. Factorbook.org: a Wiki-based database for transcription factor-binding data generated by the ENCODE Consortium. Nucleic Acids Res.41(Database issue), D171–D176 (2013).
- Agatheeswaran S , ChakrabortyS. MEF2C and CEBPA: possible co-regulators in chronic myeloid leukemia disease progression. Int. J. Biochem. Cell Biol.77(Pt A), 165–170 (2016).
- Ponnaluri VK , EhrlichKC , ZhangGet al. Association of 5-hydroxymethylation and 5-methylation of DNA cytosine with tissue-specific gene expression. Epigenetics12(2), 123–138 (2017).
- Fazi F , RacanicchiS , ZardoGet al. Epigenetic silencing of the myelopoiesis regulator microRNA-223 by the AML1/ETO oncoprotein. Cancer Cell12(5), 457–466 (2007).
- Roffel MP , BrackeKR , HeijinkIH , MaesT. miR-223: a key regulator in the innate immune response in asthma and COPD. Front. Med. (Lausanne)7, 196 (2020).
- Vian L , DiCarlo M , PelosiEet al. Transcriptional fine-tuning of microRNA-223 levels directs lineage choice of human hematopoietic progenitors. Cell Death Differ.21(2), 290–301 (2014).
- Sartorelli V , LauberthSM. Enhancer RNAs are an important regulatory layer of the epigenome. Nat. Struct. Mol. Biol.27(6), 521–528 (2020).
- Wang S , ChenJ , GarciaSPet al. A dynamic and integrated epigenetic program at distal regions orchestrates transcriptional responses to VEGFA. Genome Res.29(2), 193–207 (2019).
- Yang H , CaoY , ZhangJet al. DLX5 and HOXC8 enhance the chondrogenic differentiation potential of stem cells from apical papilla via LINC01013. Stem Cell Res. Ther.11(1), 271 (2020).
- Chung IH , LuPH , LinYHet al. The long non-coding RNA LINC01013 enhances invasion of human anaplastic large-cell lymphoma. Sci. Rep.7(1), 295 (2017).
- Rao SS , HuntleyMH , DurandNCet al. A 3D map of the human genome at kilobase resolution reveals principles of chromatin looping. Cell159(7), 1665–1680 (2014).
- Boaru SG , Borkham-KamphorstE , VanDe Leur E , LehnenE , LiedtkeC , WeiskirchenR. NLRP3 inflammasome expression is driven by NF-kappaB in cultured hepatocytes. Biochem. Biophys. Res. Commun.458(3), 700–706 (2015).
- Huppertz C , JagerB , WieczorekGet al. The NLRP3 inflammasome pathway is activated in sarcoidosis and involved in granuloma formation. Eur. Respir. J.55(3), 1900119 (2020).
- Kumar A , NallabelliN , SharmaUet al. In vitro evidence of NLRP3 inflammasome regulation by histone demethylase LSD2 in renal cancer: a pilot study. Mol. Biol. Rep.47(9), 7273–7276 (2020).
- Ungvari Z , Valcarcel-AresMN , TarantiniSet al. Connective tissue growth factor (CTGF) in age-related vascular pathologies. Geroscience39(5–6), 491–498 (2017).
- Ratajczak MZ , KuciaM. SARS-CoV-2 infection and overactivation of Nlrp3 inflammasome as a trigger of cytokine “storm” and risk factor for damage of hematopoietic stem cells. Leukemia34(7), 1726–1729 (2020).
- Wang WB , LiHP , YanJet al. CTGF regulates cyclic stretch-induced vascular smooth muscle cell proliferation via microRNA-19b-3p. Exp. Cell Res.376(1), 77–85 (2019).
- Brasier AR , TateJE , RonD , HabenerJF. Multiple cis-acting DNA regulatory elements mediate hepatic angiotensinogen gene expression. Mol. Endocrinol.3(6), 1022–1034 (1989).
- Ounzain S , PedrazziniT. Super-enhancer lncs to cardiovascular development and disease. Biochim. Biophys. Acta1863(7 Pt B), 1953–1960 (2016).
- Brasier AR , ZhouJ. Validation of the epigenetic reader bromodomain-containing protein 4 (BRD4) as a therapeutic target for treatment of airway remodeling. Drug Discov. Today25(1), 126–132 (2020).
- O’Neill LA , SheedyFJ , MccoyCE. MicroRNAs: the fine-tuners of Toll-like receptor signalling. Nat. Rev. Immunol.11(3), 163–175 (2011).
- De Kerckhove M , TanakaK , UmeharaTet al. Targeting miR-223 in neutrophils enhances the clearance of Staphylococcus aureus in infected wounds. EMBO Mol. Med.10(10), e9024 (2018).
- Haneklaus M , O’NeilJD , ClarkAR , MastersSL , O’NeillLAJ. The RNA-binding protein tristetraprolin (TTP) is a critical negative regulator of the NLRP3 inflammasome. J. Biol. Chem.292(17), 6869–6881 (2017).
- Bauernfeind F , RiegerA , SchildbergFA , KnollePA , Schmid-BurgkJL , HornungV. NLRP3 inflammasome activity is negatively controlled by miR-223. J. Immunol.189(8), 4175–4181 (2012).
- Ding Q , ShenL , NieXet al. MiR-223-3p overexpression inhibits cell proliferation and migration by regulating inflammation-associated cytokines in glioblastomas. Pathol. Res. Pract.214(9), 1330–1339 (2018).
- Mangiavacchi A , SorciM , MasciarelliSet al. The miR-223 host non-coding transcript linc-223 induces IRF4 expression in acute myeloid leukemia by acting as a competing endogenous RNA. Oncotarget7(37), 60155–60168 (2016).
- Wang K , LongB , LiuFet al. A circular RNA protects the heart from pathological hypertrophy and heart failure by targeting miR-223. Eur. Heart J.37(33), 2602–2611 (2016).
- Hoss F , MuellerJL , RojasRingeling Fet al. Alternative splicing regulates stochastic NLRP3 activity. Nat. Commun.10(1), 3238 (2019).
- Swanson KV , DengM , TingJP. The NLRP3 inflammasome: molecular activation and regulation to therapeutics. Nat. Rev. Immunol.19(8), 477–489 (2019).
- Ulukan B , SilaOzkaya Y , ZeybelM. Advances in the epigenetics of fibroblast biology and fibrotic diseases. Curr. Opin. Pharmacol.49, 102–109 (2019).
- Yu F , ChouCW , ChenCC. TNF-alpha suppressed TGF-beta-induced CTGF expression by switching the binding preference of p300 from Smad4 to p65. Cell. Signal.21(6), 867–872 (2009).