
Abstract
Aims: The aim of this study was to assess regional- and sex-dependent changes in miRNA expression resulting from early-life stress (ELS). Materials and methods: Small RNA sequencing was used to determine sex-dependent changes in miRNAs after maternal separation, a rodent model of ELS, across the prefrontal cortex, amygdala and hippocampus. Results: Maternal separation induced anhedonia and altered miRNA expression in a sex-dependent manner, particularly in the prefrontal cortex and hippocampus. Gene ontology revealed that these miRNAs target genes with brain-specific biological functions. Conclusion: Using a network approach to explore miRNA signaling across the brain after ELS, regional differences were highlighted as key to studying the brain’s stress response, which indicates that sex is critical for understanding miRNA-mediated ELS-induced behavior.
Early-life stress (ELS) is a major risk factor for psychiatric illness, including major depressive disorder (MDD) which affects an estimated 15% of the US population, carries a substantial economic burden, and is a debilitating psychiatric illness associated with loss of function and increased risk of suicide [Citation1-Citation5]. Moreover, ELS may increase the incidence of anhedonia, which is a central feature of MDD [Citation6]. Previous reports suggest that ELS in rodents consistently results in anhedonic behavior (i.e., reduced sucrose preference), whereas other depressive phenotypes (e.g., reduced swimming in the forced swim test) are less consistent [Citation7]. The mechanism by which ELS leads to anhedonia and MDD is not clearly understood. Furthermore, although men and women experience similar rates of ELS (child abuse and neglect) [Citation8], women are twice as likely to develop MDD [Citation9].
miRNAs are small (∼22 nucleotides) noncoding RNAs that are particularly responsive to changes in the environment, including the experience of stress [Citation10–12]. Because each miRNA has many targets, they are considered master regulators of gene expression [Citation13]. Synthesized in the nucleus as hairpin loop-structured primary miRNA, they are cleaved by the DROSHA/DGCR8 complex to form pre-miRNAs. Exportin-5 helps to transport pre-miRNA into the cytoplasm, where it is further cleaved by DICER/TRBP into a double-stranded miRNA–miRNA duplex. Finally, one of these strands is degraded and the other is bound to the RNA-induced silencing complex, which binds to the 3′UTR of mRNAs, thus blocking their subsequent production of proteins. These miRNAs can be localized throughout cells as well as extracellularly in synapses [Citation14] and in extracellular vesicles such as exosomes [Citation15]. MDD and stress affect many molecular pathways (e.g., dopamine, serotonin, glucocorticoids) throughout the brain; therefore widespread gene regulation by miRNAs is a promising area of study for prospective treatments.
Significant differences in miRNA expression across the genome have been reported between MDD patients and healthy individuals [Citation16]. They have also been significantly correlated with MDD symptomology, response to treatment, and stress-related gene expression changes [Citation17–19]. Previous work has elucidated miRNA expression changes in rodents showing depression-like behavior using behavioral and pharmacological manipulations [Citation20,Citation21]. As an extension of this work, we aimed to test how ELS can affect depression-related behaviors through miRNAs. Studies have begun to show differences in miRNA expression as a result of ELS [Citation22], but there are almost no studies that include both male and female subjects. Thus our understanding of how miRNAs contribute to sex-dependent changes in MDD symptomology, particularly after ELS, is limited.
Maternal separation (MS) has been widely used as a rodent model of ELS, specifically neglect. A few studies using the MS model of ELS have revealed miRNA changes across the brain during adulthood. It has been found that 180 min of MS per day significantly altered miR-132 and miR-124 [Citation23]. Likewise, 90 min of daily MS altered miR-124 in the dentate gyrus [Citation24]. On the other hand, miR-598-5p and miR-451 responded to antidepressant treatment in the hippocampus of MS rats [Citation25]. It is thought that these region-specific miRNA changes may contribute to depression susceptibility after ELS.
It is generally well agreed that brain regions function within interconnected networks. The prefrontal cortex (PFC), amygdala and hippocampus have been identified as key brain regions for the maintenance of depression. A study in mice who received postnatal unpredictable stress found increased resting state connectivity from the amygdala out to both the PFC and hippocampus [Citation26]. In MDD patients, psychotherapy reduces medial PFC, hippocampus and amygdala activation [Citation27]. Functional connectivity has even been used to differentiate symptomology of patients with MDD and generalized anxiety disorder [Citation28]. In females with MDD, ELS severity has been negatively correlated with resting state connectivity between the amygdala and PFC [Citation29]. One research group reported that miR-124a and miR-18a were affected by adolescent chronic variable stress in the amygdala, PFC and hippocampus; however, the relationship between these miRNA changes across different brain areas was not evaluated [Citation30,Citation31]. Although brain regions cannot function in isolation, so far no study has explored regional differences in miRNA expression after MS concurrently, let alone their covariation.
In this study we applied the MS model of ELS in rats and used miRNA sequencing to assess sex differences in miRNA changes as well as the main effect of MS across the PFC, amygdala and hippocampus. Using correlation hierarchical clustering, we revealed differences in miRNA expression across three brain regions in order to better understand how brain regions coordinate miRNA responses to stress. Subsequent gene ontology (GO) and gene path analysis were based on miRNAs that were significantly altered by MS and also correlated across brain regions, creating a significantly correlated miRNA network. Our results, to our knowledge, provide insight for the first time into how ELS can coordinate miRNA responses in different brain regions, leading to depression-related behavioral susceptibility in a sex-dependent manner.
Materials & methods
Animals
The experiments were approved by the Institutional Animal Care and Use Committee at the University of Alabama at Birmingham (AL, USA). The study was also designed to reduce the number of animals used as best possible. Pregnant Sprague Dawley rats (Envigo Inc., IN, USA) were housed in animal facilities under standard housing conditions (temperature 21 ± 1°C, humidity 55 ± 5%, 12-h light/dark cycle). Water and food were available ad libitum. Dams were monitored twice per day from gestational day 20 until pups were born (postnatal day [PND] 0). Litters were randomly assigned to MS or control cohorts; MS experiments were adapted from the methods of Plotsky and Meaney [Citation32]. From PND 2–16, MS pups were separated from the dam for 180 min each morning and kept on a 30°C heating pad. Control pups were handled for 5 min daily from PND 2–16 and then returned to the dam. After PND 16, pups were housed with the dam until weaning at PND 21 and then separated into groups of two or three until testing. Behavioral testing was conducted beginning on PND 60, and the animals were sacrificed at PND 80. In order to study changes relevant to anhedonia, control and MS animals were selected such that MS animals exhibited reduced sucrose preference (n = 5 males and 5 females in both control and MS groups). 24 h after the last behavioral test, the animals were sacrificed and their brain tissues flash-frozen for storage at -80°C; during testing, experimenters were blinded to the group assignment.
Behavior testing
Sucrose preference test
These procedures were adapted from our previous publication [Citation33] and are detailed in Supplementary File 1. At PND 60, animals were given access to 1% sucrose solution for a 24-h acclimation. Half of the sucrose was then replaced with water for another 24-h acclimation. On day 3, the animals fasted for 24 h. Finally, the animals were housed individually and were given 500 ml of both sucrose solution and water, as well as food ad libitum. After 24 h the remaining volume of water and sucrose solution was recorded.
Elevated plus maze
Animals were placed individually in the center of a raised plus-shaped platform (50 × 50 cm) with two open arms and two walled arms (15 cm tall, open roof). The animals were video-recorded for 5 min and Noldus Ethovision XT 11.5 (Noldus IT, Wageningen, The Netherlands) was used to extract the time spent and number of entries in the open and closed arms. The elevated plus maze (EPM) was scored using the anxiety index equation: 1−([(time in open arms/total maze time) + (open arm entries/total maze exploration)]/2) [Citation34].
Forced swim test
Prior to the test, the animals were acclimated to the swimming procedure for 15 min in a 30.5 × 45.7 cm Plexiglas cylinder filled three-quarters full of room temperature water. 24 h later, the animals were tested in the same tank. The animals were each video-recorded swimming for 6 min and were then dried and returned to their home cage. The video was scored by a blind rater who recorded the time (s) spent actively swimming (i.e., escape behavior).
RNA isolation
Trizol™ was used to isolate total RNA from 10 mg of brain tissue from PFC, amygdala and hippocampus brain regions of each animal. RNA was precipitated overnight with glycogen at -30°C and spun at 20,000 × g for 25 min to collect the RNA pellet. After washing in 70% ethanol, the pellet was dehydrated and resuspended in RNAse-free water. RNA absorbance ratio >1.75 was considered pure (NanoDrop™ spectrophotometer; Thermo Scientific, MA, USA). Samples were tested on agarose gel for RNA integrity prior to sequencing.
miRNA sequencing & analysis
Full sequencing and analysis methods are detailed in Supplementary File 1. The datasets generated and/or analyzed during the current study are available from the corresponding author on reasonable request. Total RNA was used to prepare miRNA sequencing and the libraries were quality tested prior to sequencing. The samples were captured on Illumina flow cells and sequenced for 51 cycles on the NextSeq 500 (Illumina, CA, USA). The raw sequencing data were quality checked and aligned to the reference genome. In edgeR, the trimmed mean of M-values method was implemented to normalize raw reads as counts per million (CPM) with a false discovery rate (FDR) <0.05 [Citation35].
Using R software (v 3.6.0), we applied a 2 × 2 analysis of variance to test for the effect of MS and sex on miRNA expression (i.e., CPM) in each brain region (p << 0.05, fold change cutoff >1.3). Normalized CPM values were correlated with behavior measures using Pearson correlation (FDR <0.05). miRNA–miRNA correlation analyses were conducted between the significantly altered miRNAs across all brain regions, then the miRNA–miRNA correlations were hierarchically clustered using cluster (https://CRAN.R-project.org/package=cluster) in R using the DIANA algorithm [Citation36]. The optimal cluster number was determined for each analysis using the silhouette method (factoextra R package; https://CRAN.R-project.org/package=factoextra). miRNA–miRNA networks were created based on significant (FDR <0.05) correlations between brain regions. Dendextend in R (https://cran.r-project.org/package=dendextend) was used to calculate entanglement (a direct comparison of hierarchical clustering between groups). Scores vary from 0 to 1, with lower scores representing better overall alignment.
In silico chromosomal localization
Using miRDeep2 [Citation37], we identified the chromosomal localization of each significantly altered miRNA and determined the proximity of miRNAs that were colocalized. Phenogram (http://visualization.ritchielab.org/phenograms/) was used for visualization.
In silico gene target prediction & gene ontology
The detailed method is described in Supplementary File 1. MiRWalk 2.0 (http://zmf.umm.uni-heidelberg.de/apps/zmf/mirwalk2/) software was used to assess the validated and predicted gene targets of significantly altered and strongly correlated miRNAs across brain regions. We based gene target prediction analysis on miRNAs that were correlated with at least four other miRNAs in different brain regions or were correlated with miRNAs with downstream miRNA correlations. Genes that were predicted by six or more prediction software in miRWalk were included in the Ingenuity Path Analysis (IPA; Qiagen, MD, USA) path analysis. Predicted gene targets were used for subsequent analysis due to the limited number of validated targets. In IPA, we filtered to include genes associated with psychological disorders and created miRNA–gene target interaction maps.
Predicted gene targets were used for GO analysis. We determined highly represented ontology terms and their network clustering using Metascape [Citation38]. We assessed cellular component ontologies using ShinyGO (v.0.61) [Citation39].
Results
Animal behavior
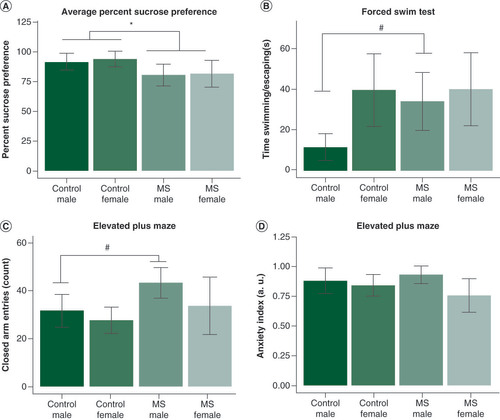
MS animals exhibited decreased preference for sucrose in the sucrose preference test (SPT) compared with control animals (F1,16 = 9.16, p < 0.01) (A) and sex had no effect on sucrose preference. There was a trending sex difference in forced swim test (FST) swim time, but it was not significant (F1,8 = 3.94, p = 0.08). A follow-up pairwise t-test revealed a trending difference between male controls and MS animals in swim time (t4 = −2.51, p = 0.07) (B). There was a trending increase in EPM closed arm entries in MS animals (F1,8 = 3.57, p = 0.09), but it did not reach significance; this effect was driven by a trending difference between male control and MS animals (t4 = −2.16, p = 0.09) (C). The Anxiety Index score was not significantly different based on MS (p = 0.12) or the interaction (p = 0.79) (D).
(A) MS animals exhibited significantly decreased sucrose preference (F1,16 = 9.16, p < 0.01). There were no sex differences in sucrose preference. (B) We found a trending increase in forced swim test escape time only in male animals (t4 = -2.51, p = 0.066). (C) In the elevated plus maze, male MS animals exhibited a trending increase in closed arm entries (t4 = -2.16, p = 0.097). (D) However, there were no group differences in the anxiety index; data are shown in mean ± standard error of the mean; *p < 0.05;#0.1 > p > 0.05. The relationship between miRNA expression and depressive behavior was shown using Pearson correlations (false discovery rate <0.05). (E) In all animals, percentage sucrose preference inversely correlated with expression of four miRNAs in the amygdala. (F) In males, sucrose preferences correlated positively with prefrontal cortex miR-411-5p and inversely with miR-133b-3p in the amygdala. (G) In females, six miRNAs were correlated with sucrose preference. (H & I) In all animals, four miRNAs were positively correlated (H) and eight were negatively correlated (I) with forced swim escape time. (J) In male animals, 88 miRNAs were significantly (false discovery rate <0.05) correlated with escape time; the top ten miRNAs are shown. Amygdala miRNAs are shown in red hues with square markers, prefrontal cortex in blue hues with circular markers, and hippocampal miRNAs in yellow hues with triangular markers. To aid in visualization, normalized counts per million values were scaled to fit within the same y-axis; therefore relative expression is an arbitrary unit of measure which maintains the slope of each significant correlation.
MS: Maternal separation.
miRNA sequencing
After sequencing and normalization, 538 miRNAs were detected with a mean CPM ≥1 and were used for group comparison analysis. Significant group differences in miRNA expression are listed by region in .
Table 1. miRNAs significantly altered by maternal separation and the interaction between maternal separation and sex across prefrontal cortex, amygdala and hippocampus.Table Footnote†
miRNA expression correlates with depression-like behavior
To determine the contribution of miRNA expression to behavior, we conducted Pearson correlations (FDR <0.05) in all animals and separately in male and female animals. In all animals, SPT sucrose preference was significantly inversely correlated with the expression of four miRNAs (miR-126a-3p, miR-466b-3p, miR-483-5p and miR-486) in the amygdala (n = 20; FDR <0.05; E). In male animals, sucrose preference was positively correlated with PFC miR-411-5p and inversely with amygdala miR-133b-3p (n = 10; FDR <0.05; F). In female animals, sucrose preference was inversely correlated with PFC miR-142-5p and amygdala miR-483-3p, miR-31a-3p, miR-466b-3p and miR-483-5p; miR-879-5p was positively correlated with the sucrose preference test (n = 10; FDR <0.05; G).
In all animals, several miRNAs were positively correlated with FST escape time (amygdala miR-219a-1-3p and PFC miR-1306-5p, miR-3102, miR-449a-5p and miR-193a-5p; n = 12; H). In all animals, escape time was significantly negatively correlated with eight miRNAs (hippocampus miR-138-5p and amygdala miR-28-5p, miR-103-3p, miR-191a-5p, miR-24-3p, miR-339-5p, miR-497-5p and let-7e-3p; I). A total of 88 miRNAs were significantly correlated with escape time in male animals, most of which were in the PFC (FDR <0.05; listed in Supplementary Table 1); the ten most significant miRNA correlations are shown in J. By comparison, no miRNA expression significantly correlated (FDR <0.05) with FST escape time in female animals.
Only two miRNAs showed a significant correlation with EPM measures. In male rats, miR-412-3p in the hippocampus was inversely correlated with the EPM anxiety index (r6 = -0.986, FDR <0.05). In female animals, EPM closed arm entries correlated positively with miR-3068-5p in the PFC (r6 = 0.996, FDR <0.05).
Main effect of maternal separation on miRNA expression
Twenty-three miRNAs – seven in the PFC, nine in the amygdala and seven in the hippocampus () – were significantly altered by MS. Fold change is presented as a ratio of miRNA expression between the comparison groups. Values <1 were converted to negative fold change values by dividing -1 by the ratio of miRNA expression values. miRNAs exhibiting ≥1.3 fold change were used for subsequent analyses. In PFC, all the significantly altered miRNAs were upregulated in MS compared with controls. In the amygdala, all but two miRNAs (miR-130b-5p and miR-1306-3p) were upregulated in MS animals compared with controls. In the hippocampus, miR-196b-5p, miR-200b-3p, miR-200b-5p and miR-3473 showed increased expression, while miRs-335, miR-487b-5p and miR-540-5p were decreased. miR-196b-5p and miR-200b-5p in the hippocampus exhibited the greatest fold changes at 2.59 and 2.66, respectively.
The interaction of sex & maternal separation on miRNA expression
A significant interaction effect (p < 0.05) was detected for 44 miRNAs across the three brain areas, but only 39 miRNAs showed fold changes >1.3 (): 18 in the PFC, 4 in the amygdala and 17 in the hippocampus. In males, four miRNAs in PFC, two in amygdala and six in hippocampus showed significantly increased expression in MS animals. Conversely, in females, 14 miRNAs in PFC, one in amygdala and four in hippocampus were significantly increased in MS animals. In male MS animals, there was decreased expression for 14 miRNAs in PFC and two in hippocampus. In female MS animals, one PFC, two amygdala and 11 hippocampal miRNAs showed decreased expression compared with controls. In males, 11 miRNAs were unaffected (i.e. magnitude fold change <1.2) by MS: two in amygdala and nine in hippocampus. Six miRNAs were unaffected by MS in the females: three in PFC, two in amygdala and two in hippocampus. In males, miR-193a-5p exhibited the highest fold change at 1.91-times expression in MS compared with controls, followed by PFC miR-410-5p with a fold change of -1.72. In females, hippocampal miR-425-3p and miR-451-5p exhibited the highest-magnitude fold changes in MS compared with controls at -1.53 and 2.04, respectively ().
Correlation & hierarchical clustering of miRNA expression across PFC, amygdala & hippocampus
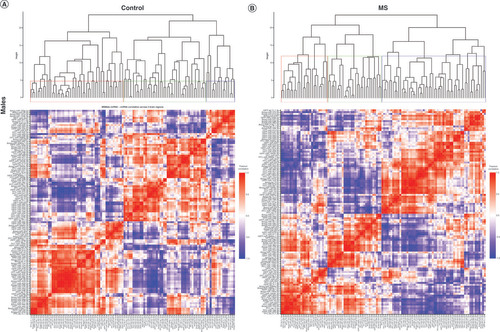
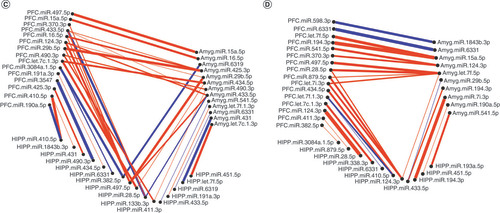
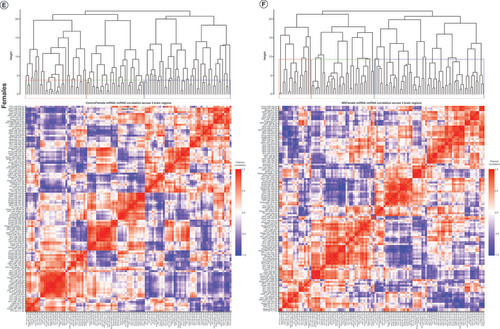
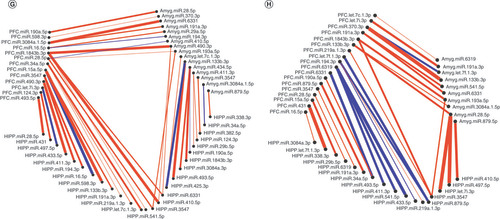
Hierarchical clustering of miRNA–miRNA correlations was used to assess patterns of similar or dissimilar miRNA expression change across the three brain regions. Correlation heat maps and hierarchical clustering dendrograms for miRNAs with a significant main effect of MS are presented in . The same results for the interaction of MS and sex are presented in A–D for males and E–H for females.
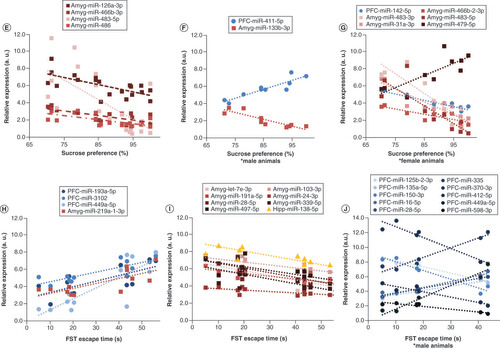
Significantly altered MS main effect miRNAs across the prefrontal cortex, amygdala and hippocampus were included in correlation and hierarchical clustering analysis. R was used to cluster using the DIANA algorithm. Clustering was limited to k = 3 clusters. (A & B) Correlation heat maps for (A) controls and (B) maternal separation animals show disparate patterns of miRNA–miRNA correlation across the brain; each of the three clusters is marked by a colored square on the dendrogram and height is an arbitrary unit estimating the distance between different clusters. Significantly correlated miRNAs (false discovery rate <0.05) were narrowed to only include miRNA correlations between brain regions rather than within a single brain region. (C & D) miRNA–miRNA correlation network figures were created for (C) controls and (D) MS animals. Positive correlations are shown in red and negative correlations in blue; thicker lines indicate a more significant correlation.
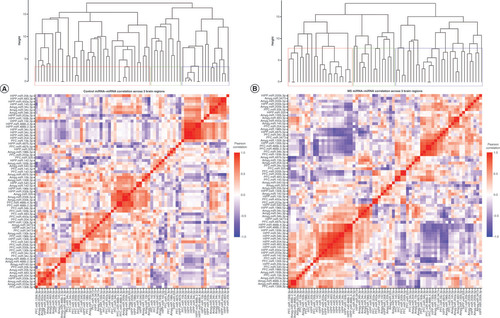
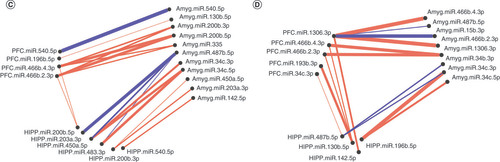
Significantly altered interaction effect miRNAs across the prefrontal cortex, amygdala and hippocampus were included in this correlation and hierarchical clustering analysis in R. Correlation heat maps for (A) male controls, (B) male MS, (E) female controls and (F) female MS animals show patterns of miRNA–miRNA correlation across the brain; each of the k = 3 clusters is marked by a colored outline in the dendrogram and height is an arbitrary unit estimating the distance between different clusters. For each group – (C) male controls, (D) male MS, (G) female controls and (H) female MS – significantly correlated miRNAs (false discovery rate <0.05) were narrowed to look across regions. Positive correlations are shown in red and negative correlations in blue; thicker lines indicate a more significant correlation.
MS: Maternal separation.
miRNA correlation between PFC, amygdala & hippocampus: effect of MS
We used the silhouette method to determine the number of clusters necessary to adequately describe the data. miRNA–miRNA correlations in both control and MS animals optimally cluster into ten groups, and in both groups the clusters largely comprise miRNAs from all three brain regions rather than from a single brain region.
In order to test whether miRNAs would cluster closely by brain region and to compare clustering across groups, we also created dendrograms based on only three clusters (). In controls, the clusters comprised 59%, 16% and 25%, respectively, of the significant main effect miRNAs. Cluster 1 contained 17 PFC, 17 amygdala and seven hippocampal miRNAs; cluster 2 contained five PFC, three amygdala and three hippocampal miRNAs; and cluster 3 contained one PFC, three amygdala and 13 hippocampal miRNAs (A). Generally, amygdala and PFC miRNA coexpression grouped together in cluster 1, while hippocampal miRNAs’ coexpression clustered with other hippocampal miRNAs in cluster 3. In MS animals, the three clusters comprised 33%, 45% and 22% of the miRNAs, respectively. Cluster 1 contained six PFC, four amygdala and 13 hippocampal miRNAs; cluster 2 contained 14 PFC, 12 amygdala and five hippocampal miRNAs; and cluster 3 contained three PFC, seven amygdala and five hippocampal miRNAs (B). Cluster 2 did contain a majority of PFC and amygdala miRNAs, while cluster 1 contained mostly hippocampal miRNAs. However, compared with controls, miRNA coexpression in MS animals did not cluster as closely by brain region; rather, each cluster was comprised more evenly of miRNAs from all three brain regions. Comparing the control and MS dendrograms revealed an entanglement score of 0.71 (Supplementary Figure 1), indicating a strong disparity between the hierarchical clustering. PFC miR-200b-3p, miR-200b-5p, miR-466b-2-3p and miR-466b-4-3p; hippocampal miR-466b-2-3p, miR-466b-4-3p, miR-34c-3p and miR-34c-5p; and amygdala miR-466b-2-3p and miR-466b-4-3p clustered identically in both control and MS animals (colored connecting lines in Supplementary Figure 1).
Within each group, highly intercorrelated miRNAs are visualized in the networks shown in C & D. In controls, there were only two correlations between hippocampus and PFC miRNAs: hippocampus miR-200b-5p positively correlated with PFC miR-466b-2-3p and miR-466b-4-3p. In MS animals, there were more correlations between the hippocampus and PFC. The majority of correlations were positive in both controls and MS groups.
miRNA correlation between PFC, amygdala & hippocampus: interaction of MS & sex
We also clustered miRNA–miRNA correlations within each MS × sex group (i.e., male control, male MS, female control, female MS; ). In males, control and MS animals optimally grouped into two clusters. For controls, cluster 1 comprised 18 PFC, 20 amygdala and 14 hippocampal miRNAs. Cluster 2 was composed of 20 PFC, 18 amygdala and 24 hippocampal miRNAs. For MS males, cluster 1 included 16 PFC, 21 amygdala and 19 hippocampal miRNAs. Cluster 2 comprised 22 PFC, 17 amygdala and 19 hippocampal miRNAs. In females, control animals clustered optimally into ten groups, while MS animals clustered into nine. Each of these clusters was comprised of miRNAs across at least two brain regions.
When considering only three clusters in control males, the clusters contained 46%, 40% and 14% of the miRNAs and an almost equal number of miRNAs from each brain region (A). In MS males, the clusters comprised 23%, 51% and 26% of the miRNAs. Cluster 3 contained a majority of amygdala miRNAs (B). In control females, the three clusters contained 30%, 42% and 28% of the miRNAs and represented all three brain regions (E). Cluster 1 mainly comprised PFC and hippocampal miRNAs; cluster 2, PFC and amygdala; and cluster 3, amygdala and hippocampal. In MS females, the clusters comprised 16%, 53% and 31% of the miRNAs; over half of the miRNAs were sorted into cluster 2, which comprised 16 PFC, 20 amygdala and 25 hippocampal miRNAs (F). Cluster 1 evenly represented each region, while cluster 3 contained twice as many PFC and amygdala miRNAs as hippocampal miRNAs. Comparison of male controls and MS clustering dendrograms yielded an entanglement value of 0.55 (Supplementary Figure 2A); female entanglement was 0.56 (Supplementary Figure 2B). There were no identically clustered miRNAs in either male or female hierarchical clustering.
miRNA–miRNA network maps revealed intercorrelated miRNAs across regions. In control males, miRNA–miRNA correlations between the PFC and amygdala were always positive (C); there were several negative correlations involving the hippocampus. In MS males, the majority of correlations were positive (D). Similarly, control females exhibited mostly positive miRNA–miRNA correlations across brain regions, with few negative correlations between each pair of regions (G). In MS females, there were equal numbers of negative and positive correlations between the hippocampus and PFC. Correlations involving the amygdala were almost entirely positive (H).
miRNA gene targets, gene ontology & chromosome localization
miRNA gene targets & chromosome localization based on MS
Of the 23 miRNAs significantly altered by MS (), only seven had validated targets in the miRWalk 2.0 database: miR-145-5p, miR-200b-3p, miR-203a-3p, miR-204-5p, miR-335, miR-34c-5p and miR-450a-5p. They targeted 13 validated genes (Supplementary Table 2) including BNIP3, CAMK2G and VEGFA. Based on the significantly altered and intercorrelated miRNAs shown in C & D, miRWalk predicted 7659 unique targets through all of the available databases (Supplementary File 2 contains the full miRWalk output). Only 1848 were predicted by at least six different databases. The 20 most significantly predicted targets with the highest number of targeting miRNAs are shown in Supplementary Table 3. The top predicted gene was NEUROD4 targeted by miR-142-5p, miR-34b-3p, miR-34c-3p and miR-487b-5p. miR-34c-3p targeted 16 of the top 20 targets.
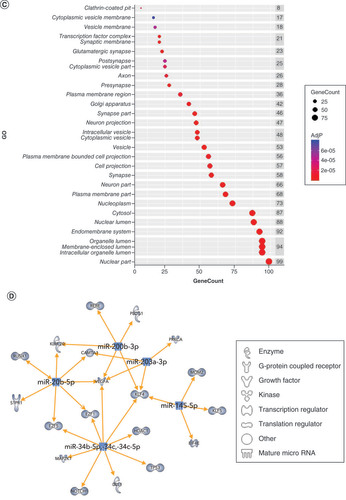
Using IPA, we filtered the miRWalk list to 363 genes relevant to psychological disorders. GO analysis (A) showed that these genes are highly involved in negative regulation of cell development (GO:0010721), behavior (GO:0007610), response to peptide (GO:1901652), response to oxidative stress (GO:0006979) and positive regulation of transcription from RNA pol II promoter in response to hypoxia (GO:0061419). B shows the clustering of similar ontologies and the parent GO term with which they cluster most closely. GO terms related to response to oxidative stress, HIF1 signaling and negative regulation of apoptotic signaling pathway clustered densely with other top GO clusters, while behavior was not tightly connected to other ontologies. Synaptic vesicle cycle and synaptic vesicle recycling ontologies only clustered with each other. We then assessed which cellular components were most impacted by these target genes using ShinyGO cellular component analysis, and visualized the results in R. The top cellular components are shown in C. Using IPA, we found that miRNA-200b-3p, miRNA-145-5p, miRNA-20b-5p, miRNA-34c-5p and miRNA-203a-3p formed a cohesive miRNA target gene network based on interacting miRNAs and their predicted gene targets (D).
(A) We tested biological function GO based on predicted gene targets which have been reported in psychiatric disorders in ingenuity path analysis software. The top 20 ontologies are shown as a bar plot; those particularly relevant to stress and depression have been highlighted in blue. (B) The same ontologies plotted as a network, with each node color-coded based on its membership in one of the top 20 ontologies; the size of each node corresponds to its significance, with larger nodes being more significant. (C) Bubble plot of the top 30 most significant cellular compartment GO terms (false discovery rate <0.05; shown by bubble color). Bubble size corresponds to the number of gene targets within each ontology. (D) Using ingenuity path analysis, we created miRNA–gene target networks based on miRNAs significantly affected by maternal separation and their predicted targets. (E) miRNAs were mapped to the rat genome using a phenogram. Counts per million fold change direction is noted by color based on the figure legend. Line color indicates the brain regions where significant group differences were detected.
GO: Gene ontology; PFC: Prefrontal cortex.
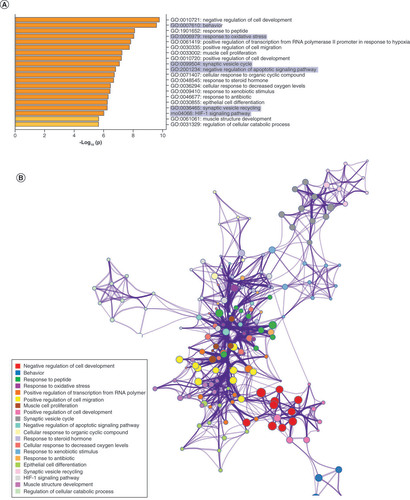
Finally, in order to elucidate the potential for common miRNA regulatory mechanisms based on chromosomal location, we visualized all significantly altered miRNAs on the rat genome using miRDeep2 and Phenogram. We found two clusters of three miRNAs that mapped onto chromosomes 6 and 8 (E). miR-540-5p, miR-487b-5p and miR-203a-3p all mapped tightly onto chromosome 6, with miR-540-5p and miR-487b-5p downregulated in MS compared with the control group. All of the miRNAs on chromosome 8 (miR-34b-3p, miR-34c-3p and miR-34c-5p) were upregulated in MS.
miRNA gene targets & chromosome localization based on interaction of MS & sex
miRWalk identified 31 validated gene targets of ten of the significantly altered miRNAs in the interaction between MS and sex (Supplementary Table 4). miR-34a-5p had the most validated targets, followed by miR-124-3p. Validated targets included the apoptosis regulator BCL2, BDNF, MMP9 and SLC2A4. miRNAs with high interregional correlation in either the male or female animals (C–D & G–H) were predicted by miRWalk databases to target 7488 unique genes (see Supplementary File 3 for full miRWalk output). Of these targets, 1988 were predicted by at least six of the databases. The 20 most significantly predicted targets with the most targeting miRNAs are shown in Supplementary Table 5. The top predicted gene was ATP2A2, targeted by let-7-c-1-3p, let-7f-5p, miR-16-5p, miR-410-5p, miR-493-5p, miR-6319 and miR-879-5p.
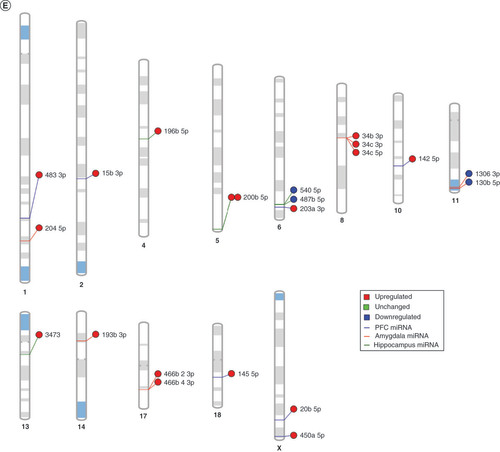
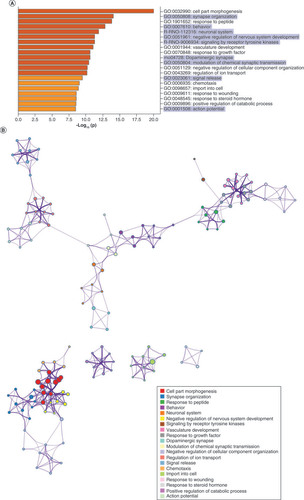
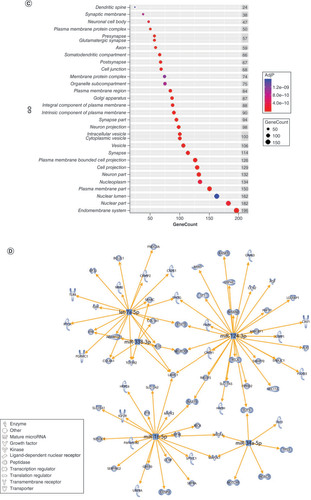
After filtering in IPA, 724 predicted genes were associated with psychological disorders. These genes are highly involved in cell part morphogenesis (GO:0032990), synapse organization (GO:0050808), response to peptide (GO:1901652), behavior (GO:0007610) and the neuronal system (R-RNO-112316) (A). GO terms related to cell part morphogenesis, synapse organization, negative regulation of nervous system development and negative regulation of cellular component organization clustered densely but separately from other ontology clusters (B). Behavior clustered most closely with modulation of chemical synaptic transmission, neuronal system and dopaminergic synapses. The top cellular GO components are shown in C. miRNA–gene target maps show sex-mediated MS miRNA hubs at let-7a-5p, miR-124-3p, miR-338-3p, miR-16-5p and miR-34a-5p (D).
(A) GO biological functions associated with sex differences in miRNA response to early-life stress were predicted based on targets from significantly altered miRNAs in both males and females. The top 20 ontologies are shown as a bar plot, and stress- and depression-related ontologies are highlighted in blue. (B) These ontologies were then plotted as a network. Node color is based on membership in one of the top 20 ontologies and node size corresponds to significance of the node, with larger nodes being more significant. (C) Bubble plot showing the top 30 most significant cellular compartment ontologies (false discovery rate <0.05; shown by bubble color); bubble size represents the number of gene targets within each ontology. (D) Using ingenuity path analysis, we created miRNA–gene target networks based on miRNAs that were significantly affected by sex and MS and their predicted targets. (E) Significantly altered miRNAs were mapped to the rat genome using a phenogram. Counts per million fold change direction is noted by color based on the figure legend for both male (diamond) and female (circle) maternal separation comparisons. Line color indicates the brain regions where significant group differences were detected.
GO: Gene ontology.
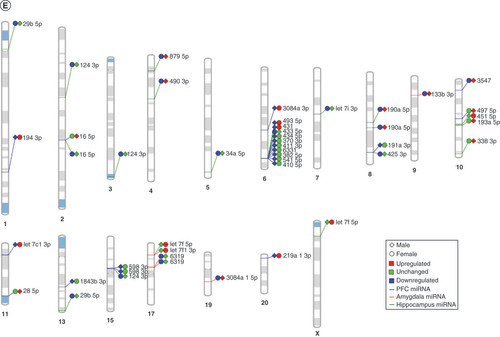
Chromosomal mapping showed a cluster of ten miRNAs on chromosome 6: miR-493-5p, miR-431, miR-433-5p, miR-434-5p, miR-370-3p, miR-411-3p, miR-6331, miR-382-5p, miR-541-5p and miR-410-5p (E). Almost all these miRNAs were downregulated in male MS animals, with the exception of miR-433-5p. In female MS animals, miR-493-5p and miR-431 were increased and miR-433-5p was decreased. Several smaller hubs of three or four miRNAs were identified on chromosomes 10, 15 and 17.
Discussion
We have presented the first study, to our knowledge, of genome-wide MS and sex effects on miRNAs in three brain regions concurrently. miRNA sequencing revealed that MS alone altered seven PFC, nine amygdala and seven hippocampal miRNAs. Sex moderated the effect of MS on miRNA expression for 18 PFC, four amygdala and 17 hippocampal miRNAs. Ten of these miRNAs colocalized on chromosome 6. Several of these miRNAs correlated with sucrose preference; interestingly, in male animals only, many miRNAs in the PFC correlated with FST escape time. We also investigated the correlation of significantly altered miRNAs across brain regions. Compared with controls, MS animals exhibited more significant correlations between miRNAs in the PFC and hippocampus. In males, control animals exhibited similar numbers of negative (37%) and positive (63%) correlations between miRNAs in the hippocampus and other regions. In contrast, MS males exhibited a network of mostly positive (82%) correlations between miRNAs across brain regions. In females, MS decreased the total number of correlations between the hippocampus and amygdala and increased the number of negative correlations between the PFC and hippocampus (41%). Subsequent in silico analysis revealed that MS may alter pathways involved in behavior, oxidative stress and synaptic vesicle cycle, among others, through these significantly altered and correlated miRNAs. Sex altered the effect of MS on miRNAs involved in synapse organization, behavior and negative regulation of nervous system development. Based on the predicted gene targets, we found that MS induced changes in an miRNA–gene network with hubs at miR-200b-3p, miR-20b-5p, miR-34b-5p, miR-34c-3p, miR-34c-5p, miR-145-5p and miR-203a-3p, and common gene targets VEGFA and KLF4. The interaction been sex and MS revealed a network with hubs at let-7a-5p, miR-338-3p, miR-124-3p, miR-16-5p and miR-34a-5p, commonly targeting LAMC1, NEUROD1 and VEGFA, among others.
miRNAs impacted by ELS
Some of the miRNAs found to be dysregulated by MS have previously been reported in animal models of depression and in MDD patients. Using the subchronic variable stress model, Pfau et al. found decreased expression of miR-20b-5p in the nucleus accumbens of male animals [Citation40]. Regardless of sex, our data show a significant increase in PFC miR-20b-5p. A previous study showed that blood levels of miR-34c-5p decreased with improved cognitive and memory performance in depressed individuals [Citation41]. Similarly, we found increased miR-34c-5p expression in MS animals. Recently, our group reported decreased expression of miR-20b-3p and miR-335-5p in the anterior cingulate cortex of MDD patients, the latter of which we also found in the hippocampus [Citation42]. Van de Auwera et al. found 22 miRNAs in plasma associated with childhood trauma, including a significant decrease in miR-142-5p [Citation43]; contrarily, our results show an increase in PFC levels of miR-142-5p. Although the relationship between central and peripheral miRNA expression has not been thoroughly established, one study found little overlap between brain and blood miRNAs after induced cerebral ischemia [Citation44]. In a different study of ischemic stroke, there were relatively few miRNAs found with overlapping expression in both brain and blood [Citation45]. Conversely, the study of Sorensen et al. study found a strong overlap between blood and CSF [Citation46]. While there is likely some overlap between central and peripheral miRNA profiles, these miRNA disparities partially explain the differences between our results and those previously reported.
Another study in ELS used an adolescent chronic variable stress model in mice and found decreased expression of PFC miR-466 [Citation47], whereas we found increased expression of two miRNAs belonging to the miR-466 family. Using MS, O’Connor et al. identified hippocampal miRNAs responsive to treatment such as fluoxetine, ketamine and electroconvulsive shock therapy [Citation25]. miR-200b-3p, miR-540, miR-203 and miR-34c were decreased by ketamine treatment and miR-487 was increased. Besides miR-540, we found the opposite effect in untreated MS animals, although we only found significant changes in PFC miR-203 and amygdala miR-34c, rather than in the hippocampus. Interestingly, in MS animals, amygdala miRs-34b and miR-34c formed a correlation network with hippocampal miR-487b and miR-196b. It seems promising that these miRNAs not only play a role in susceptibility to depressive behavior after MS but also show response to antidepressant treatment. Other reports of these miRNAs in stress and antidepressant treatment further corroborate our findings. Fang et al. found decreased miR-200b-5p and miR-34c-3p expression in stressed animals treated with fluoxetine, and Song et al. found increased nucleus accumbens miR-34c-5p in stressed rats compared with controls [Citation48,Citation49]. Additionally, we found that miR-20b-5p, miR-34, miR-200b-3p and miR-203a-3p acted as hub miRNAs and shared the gene target, VEGFA.
Cumulatively, there is overwhelming evidence supporting the role of miR-34c in susceptibility to stress and antidepressant treatment response, particularly in animals exposed to ELS. In fact, amygdala miR-34c overexpression reduced anxiety-related behaviors in rodents following chronic social defeat stress; it was proposed that miR-34c accomplishes this by targeting CRFR1 [Citation50]. In humans, a study of heritability of ELS-induced miRNA changes found decreases in sperm miR-34c-5p and miR-34b-3p expression [Citation51]. Linnstaedt et al. used Monte Carlo simulation to identify 17 miRNAs, including miR-15 and miR-34, with 604 predicted gene targets related to pain and posttraumatic stress [Citation52]. More studies, especially in patients with ELS history, are needed to determine whether these miRNAs could be viable targets for ELS-specific depression interventions.
Sex-dependent miRNA expression changes following ELS
Most animal studies have focused exclusively on males including studies of ELS; thus there is a noted lack of reported sex differences in the miRNA and ELS literature. For instance, Bai et al. and Liu et al. found increased hippocampal miR-16 in different rodent ELS models, but only utilized males [Citation53,Citation54]. Our results support these findings; however, we also found that miR-16 was significantly decreased by MS in female animals. Additionally, we found that PFC miR-16 was increased in male animals, showing that miRNAs may be commonly altered across brain regions.
One study tested an early adolescent chronic variable stress model only in female mice in the context of cognitive effects of aging [Citation47]. Following stress, the mice were housed either in isolation or as a social group. The findings indicated that early stress promotes later cognitive flexibility when development occurs in a social environment. Furthermore, behavior changes in the socially reared, stressed animals were accompanied by significant expression reduction in 23 PFC miRNAs, including miR-598, miR-493 and miR-466. Early chronic variable stress on its own did not affect this flexibility (as measured with the Barnes Maze), other behaviors such as spatial learning, or even corticosterone response to stress. Consistent with their results, we found that many PFC miRNAs that were significantly altered in male animals were unchanged by MS in females, such as miR-598. We similarly found fewer behavioral consequences of early stress in female animals, though they did show signs of anhedonia (via SPT). Interestingly, in our female animals MS increased miR-493; however, in the socially reared, stressed animals miR-493 was decreased [Citation47]. This discrepancy may be explained by the resilient/cognitively flexible phenotype produced by the social chronic variable stress model as compared with the anhedonic profile of our MS animals. Not only do these findings exhibit novel sex-based disparities in the miRNA response to ELS, they also help to bridge studies that rely exclusively on either male or female animals.
miRNA expression correlation across PFC, hippocampus & amygdala
We used miRNA–miRNA correlations to compare changes in miRNA expression across the brain. When considering only MS-induced miRNA changes, hierarchical clustering of these correlations revealed groupings of miRNA expression that were regionally heterogeneous (i.e., correlated miRNA expression did not group together by brain region, as might be expected). Regardless of MS, male animals optimally clustered into two groups based on miRNA–miRNA correlations; however, in females, miRNA correlation clustered into nine or ten groups, indicating that sex is a strong factor influencing the way in which miRNAs are synchronously expressed across different brain regions.
Because we examined three brain regions, we also conducted clustering with three clusters in each group to test whether miRNA–miRNA correlations would be more synchronous within a single brain region. Whereas in male control animals the clusters contained correlations between all the brain regions, in MS males one of the clusters was almost entirely composed of miRNAs in the amygdala, indicating that some miRNAs in the amygdala are not particularly synchronous with miRNAs in the other two regions. In female controls, miRNA–miRNA clustering was similarly heterogeneous with male controls. In comparison, in MS females, one cluster comprised more than 50% of all of the miRNAs, indicating that the majority of these miRNAs correlate synchronously with one another across the three brain regions.
To further explore these relationships, we visualized the most significant miRNA–miRNA correlations as a connectivity diagram (C & D, C & D and G & H). MS increased correlations between hippocampal and PFC miRNAs. In MS males, there were fewer negative miRNA correlations between the hippocampus and PFC or amygdala as compared with control males, as well as an overall decrease in the number of these correlations. MS also reduced the complexity of these miRNA correlations (e.g., number of correlations involving the same miRNA, overlapping correlation lines, total number of correlations) in males. In contrast, MS in females increased the number of negative miRNA correlations between the hippocampus and PFC, and reduced the total number of correlations between hippocampus and amygdala. Because few studies have explored miRNA changes across brain regions, it is not clear how miRNA profiles in one region affect miRNAs in others. miRNAs are found at and near synapses [Citation14]; in dendrites, they affect neural plasticity by repressing mRNAs within processing bodies until altered by neuronal activity. Moreover, neuronal activity is mostly inversely correlated with miRNA expression [Citation55]. Thus positive regional miRNA correlation may imply more synchronous activation. However, extracellular miRNAs may not reflect any changes in neuronal activity [Citation15]. Future studies need to systematically compare brain activity and miRNA expression at a regional level. Single-cell sequencing and electrophysiology will be key to developing a better understanding of this relationship in neurons, while functional MRI could be used to establish activity with regional resolution.
Potential effects of miRNA expression changes on neuronal structure & function
Pfau et al. found that female mice exhibit unique nucleus accumbens miRNA changes in response to subchronic variable stress which may only elicit depressive phenotype in females [Citation40]. Similar to our results, let-7f-1-3p, let-7c-1-3p and miR-193a-5p were increased in stressed females. However, we also showed that let-7f and let-7c were decreased in male MS animals exhibiting anhedonia. Using chronic unpredictable mild stress in male animals, Fang et al. found small increases in miR-451-5p expression in rat serum exosomes [Citation48]; we also found a small increase in miR-451-5p in the hippocampus in males, yet we found further increase in female MS animals. Another study using the mouse chronic unpredictable mild stress model found that increased miR-15b-5p induced depression-like behavior and reduced the numbers of neuron boutons from medial PFC [Citation56]. In MS animals, we found increases in miR-15b-3p in the PFC, which could suggest neuronal morphology changes. Our ontology analyses support that these miRNAs impact genes that are localized in and alter the structure of synapses. Finally, hippocampal miR-219-1-3p, miR-370 and miR-451 were reported by O’Connor et al. as increased by ketamine after MS [Citation25]. In our female rats, miR-451 showed the greatest increase in expression at twofold upregulation in MS. O’Connor et al. also showed that fluoxetine can reverse deficits in miR-451 in MS males, yet females were not considered [Citation25].
Significantly altered miRNAs grouped on chromosome 6
Linkage studies indicate that specific chromosomal loci contribute to susceptibility to MDD [Citation57,Citation58]. We identified ten miRNAs associated with the interaction of sex and MS, which grouped together on chromosome 6. Another study reported 12 hippocampal miRNAs altered by 7 days’ restraint stress which localized to chromosome 6, including miR-433-5p, and nine miRNAs altered after 14 days’ restraint, including miR-410-5p [Citation59]. Previous cancer studies give valuable insight into how these miRNAs may affect the central nervous system and lead to depression susceptibility. In malignant melanoma, Yang et al. found that upregulation of miR-410 increased cell proliferation and decreased apoptosis [Citation60]. The apoptosis regulator BCL2 was increased, while PTEN was decreased. In contrast, Zhao et al. found that miR-410 produced the opposite effect via reduced expression of VEGF [Citation61]. miR-382, also on chromosome 6, regulates PTEN in human gastric cancer cells [Citation62]. Treatment with miR-382 in vitro induced VEGF, and PTEN subsequently inhibited VEGF. miR-410 also targets SLC34A2; in a lung cancer cell line, increased miR-410 induced cell growth by reducing the rate of apoptosis [Citation63]. Levels of miR-410 and SLC34A2 were significantly correlated with Wnt/β-catenin pathway proteins (e.g., DVL2, β-catenin and GSK3β). Our group has recently reported miRNA-induced Wnt signaling gene changes in learned helpless animals [Citation64]. Wnt has been associated with cognitive disruptions in MS rats [Citation65]. In a study of osteoblast circadian rhythm, increased miR-433 (located on chromosome 6) led to a threefold increase in NR3C1 mRNA expression [Citation66]. Based on experiments comparing cytosolic to nuclear glucocorticoid receptors, it was proposed that miR-433 translocates and maintains glucocorticoid receptors in the nucleus once bound. A few of these chromosome 6 miRNAs have been associated with neuronal development. One study found that increased mir-541 reduced the growth of neuronal processes in vitro [Citation67]. We found decreased expression of miR-541 in MS males. Likewise, in cultured dorsal root ganglia cells, miR-431 was associated with increased neurite outgrowth and targeted Wnt signaling antagonist KREMEN1 [Citation68]. Incidentally, the top ontologies associated with sex-dependent MS miRNAs were cell part morphogenesis and synapse organization. Although sex-dependent changes in development after ELS have been established [Citation69], no studies have directly shown the involvement of miRNAs following ELS.
There are a few limitations to consider. Depression is a heterogeneous disorder, and small differences in type, duration and amount of stress may elicit different responses. Recently, it has been systematically shown that different ELS paradigms in animals have varying effects on behaviors associated with depression and anxiety [Citation70]. Surprisingly, MS from PND 10–17 induced the most depressive behaviors, while MS from PND 2–12 caused the most resilient behavior profile. Our results do not corroborate previous reports of increased miR-124-3p after ELS in male animals [Citation23,Citation30,Citation31], yet we found decreased hippocampal miR-124 expression in MS females. Not only does this reflect differential expression of miRNA based on sex and even brain regional differences, but it may also represent a unique miRNA response to specific stress paradigms and resulting pathophysiology. The timing of miRNA testing may also be important. For example, Uchida et al. tested for miR-124 expression in the medial PFC around PND 63, as compared with PND 90 in our study [Citation23]; Morrison et al. waited until 1 year to test for miRNA expression in the PFC [Citation47]. Not only do differences in stress paradigms, sex and behavioral outcomes contribute to miRNA expression across the brain, but it may also be important to consider the developmental time point at which miRNAs are assessed. Nonetheless, MS has been a widely used animal model of ELS, especially for neglect, which has been estimated to affect 17% of children [Citation71].
Conclusion
Altogether, this study explores correlated miRNA expression across the brain in a network framework resulting from ELS. Our study shows that miRNAs respond differently to MS across brain regions, which is key to studying the brain’s response to ELS. We also identified significant sex differences in miRNA expression, suggesting that miRNAs play a distinct role in ELS-induced susceptibility to depression in males and females. Moreover, we found that sex-dependent miRNAs targeted genes involved specifically in brain-based cellular and molecular functions, whereas without considering sex, significantly altered miRNAs target genes involved in more general cellular functions. Thus sex is a critical factor for understanding both miRNA and gene expression changes in the brain resulting from ELS. Further studies will be needed to examine the specificity of our findings, such as whether these differences are unique to neglect (MS) or are also present in other types of ELS, such as sexual or physical abuse. Additionally, it will be important to consider these finding in the context of other disorders associated with ELS, such as posttraumatic stress disorder, anxiety and schizophrenia.
Future perspective
As indicated earlier, ELS is a critical vulnerability factor in various psychiatric illnesses, including MDD. In addition, although men and women experience similar rates of ELS, women are twice as likely to develop MDD. In future, examining sex-dependent molecular mechanisms associated with ELS-induced MDD will help with designing better treatment protocols. As personalized medicine becomes more common practice, molecular studies, including those focused on miRNAs, will need to consider more variables in order to accurately predict stress susceptibility and treatment outcomes. Regional miRNA profiles and their correlation may prove to be important in the future for both treatment development and prediction of treatment efficacy. Similarly, specific types of stressful experiences like ELS may predict symptoms rather than a disease state and will be an equally important consideration for future stress-disease models.
Maternal separation had the most robust effect on miRNAs miR-200b-5p, miR-196b-5p and miR-34c-3p, and affected each of the three tested brain regions (prefrontal cortex, amygdala and hippocampus) almost equally.
Sex had the greatest effect on maternal separation-induced miRNAs in the prefrontal cortex and hippocampus.
In males, miR-193a-5p, miR-410-5p and miR-497-5p showed the most robust expression changes, while in females miR-451-5p, miR-3547 and miR-425-3p were most affected.
miRNA–miRNA correlations between the amygdala and hippocampus were reduced by maternal separation.
Sex determined the direction of miRNA–miRNA correlations between regions, with more positive correlations in males following maternal separation and females showing increased negative correlations.
Maternal separation alone resulted in miRNA gene-targeting hubs miR-200b-3p, miR-20b-5p, miR-203a-3p, miR-145-5p, miR-34b-5p, miR-34c, miR-34c-5p; sex-dependent miRNA hubs included miR-124-3p, miR-338-3p, miR-34a-5p, miR-16-5p and let-7a-5p.
Gene ontology analysis revealed that sex-dependent miRNA gene targets are involved in brain-specific functions like synapse organization, negative regulation of nervous system development and dopaminergic synapses, among others.
Ethical conduct of research
The authors state that they have obtained appropriate institutional review board approval or have followed the principles outlined in the Declaration of Helsinki for all human or animal experimental investigations.
Supplemental Material
Download Zip (30.7 MB)Acknowledgments
The authors acknowledge the contributions of M Timberlake, C Crawford and K Prall for their contributions in animal behavior and B Roy for their contributions to bioinformatic analysis.
Supplementary data
To view the supplementary data that accompany this paper please visit the journal website at: www.tandfonline.com/doi/suppl/10.2217/epi-2021-0037
Financial & competing interests disclosure
This study was supported by US Department of Health and Human Services, National Institutes of Health, National Institute of Mental Health (MH082802; MH101890; MH100616; MH107183; MH112014, MH118884). The authors have no other relevant affiliations or financial involvement with any organization or entity with a financial interest in or financial conflict with the subject matter or materials discussed in the manuscript apart from those disclosed.
No writing assistance was utilized in the production of this manuscript.
References
- Kessler RC , BerglundP , DemlerOet al. The epidemiology of major depressive disorder: results from the National Comorbidity Survey Replication (NCS-R). JAMA289(23), 3095–3105 (2003).
- Greenberg PE , FournierAA , SisitskyT , PikeCT , KesslerRC. The economic burden of adults with major depressive disorder in the United States (2005 and 2010). J. Clin. Psychiatry76(2), 155–162 (2015).
- Belmaker RH , AgamG. Major depressive disorder. New Engl. J. Med.358(1), 55–68 (2008).
- Bromet E , AndradeLH , HwangIet al. Cross-national epidemiology of DSM-IV major depressive episode. BMC Med.9(1), 90 (2011).
- Bertolote JM , FleischmannA. Suicide and psychiatric diagnosis: a worldwide perspective. World Psychiatry1(3), 181–185 (2002).
- Novick AM , LevandowskiML , LaumannLE , PhilipNS , PriceLH , TyrkaAR. The effects of early life stress on reward processing. J. Psychiatr. Res.101, 80–103 (2018).
- Bolton JL , MoletJ , IvyA , BaramTZ. New insights into early-life stress and behavioral outcomes. Curr. Opin. Behav. Sci.14, 133–139 (2017).
- US Department of Health & Human Services AFCaF, Administration on Children, Youth and Families, Children’s Bureau . Child maltreatment 2016. (2018).
- Center for Behavioral Health Statistics and Quality . 2016 National Survey on Drug Use and Health: Methodological summary and definitions.Substance Abuse and Mental Health Services Administration, Rockville, MD (2017).
- Vrijens K , BollatiV , NawrotTS. MicroRNAs as potential signatures of environmental exposure or effect: a systematic review. Environ. Health Perspect.123(5), 399–411 (2015).
- Yang Q , QiuC , YangJ , WuQ , CuiQ. miREnvironment database: providing a bridge for microRNAs, environmental factors and phenotypes. Bioinformatics27(23), 3329–3330 (2011).
- Qiu C , ChenG , CuiQ. Towards the understanding of microRNA and environmental factor interactions and their relationships to human diseases. Sci. Rep.2, 318 (2012).
- Bartel DP . Metazoan microRNAs. Cell173(1), 20–51 (2018).
- Hu Z , LiZ. miRNAs in synapse development and synaptic plasticity. Curr. Opin. Neurobiol.45, 24–31 (2017).
- Makarova JA , ShkurnikovMU , WickleinDet al. Intracellular and extracellular microRNA: an update on localization and biological role. Prog. Histochem. Cytochem.51(3–4), 33–49 (2016).
- Maffioletti E , CattaneoA , RossoGet al. Peripheral whole blood microRNA alterations in major depression and bipolar disorder. J. Affect. Disord.200, 250–258 (2016).
- Hung YY , WuMK , TsaiMC , HuangYL , KangHY. Aberrant expression of intracellular let-7e, miR-146a, and miR-155 correlates with severity of depression in patients with major depressive disorder and is ameliorated after antidepressant treatment. Cells8(7), 647 (2019).
- Kim HK , TyryshkinK , ElmiNet al. Plasma microRNA expression levels and their targeted pathways in patients with major depressive disorder who are responsive to duloxetine treatment. J. Psychiatr. Res.110, 38–44 (2019).
- Lopez JP , FioriLM , CruceanuCet al. MicroRNAs 146a/b-5 and 425-3p and 24-3p are markers of antidepressant response and regulate MAPK/Wnt-system genes. Nat. Commun.8, 15497 (2017).
- Smalheiser NR , ZhangH , DwivediY. Enoxacin elevates microRNA levels in rat frontal cortex and prevents learned helplessness. Front. Psychiatry5, 6 (2014).
- Roy B , DunbarM , SheltonRC , DwivediY. Identification of microRNA-124-3p as a putative epigenetic signature of major depressive disorder. Neuropsychopharmacology42(4), 864–875 (2017).
- Allen L , DwivediY. MicroRNA mediators of early life stress vulnerability to depression and suicidal behavior. Mol. Psychiatry25(2), 308–320 (2020).
- Uchida S , HaraK , KobayashiAet al. Early life stress enhances behavioral vulnerability to stress through the activation of REST4-mediated gene transcription in the medial prefrontal cortex of rodents. J. Neurosci.30(45), 15007–15018 (2010).
- Bahi A . Sustained lentiviral-mediated overexpression of microRNA124a in the dentate gyrus exacerbates anxiety- and autism-like behaviors associated with neonatal isolation in rats. Behav. Brain Res.311, 298–308 (2016).
- O’Connor RM , GrenhamS , DinanTG , CryanJF. microRNAs as novel antidepressant targets: converging effects of ketamine and electroconvulsive shock therapy in the rat hippocampus. Int. J. Neuropsychopharmacol.16(8), 1885–1892 (2013).
- Johnson FK , DelpechJC , ThompsonGJet al. Amygdala hyper-connectivity in a mouse model of unpredictable early life stress. Transl. Psychiatry8(1), 49 (2018).
- Buchheim A , VivianiR , KesslerHet al. Changes in prefrontal–limbic function in major depression after 15 months of long-term psychotherapy. PLoS ONE7(3), e33745 (2012).
- Xu X , DaiJ , ChenYet al. Intrinsic connectivity of the prefrontal cortex and striato-limbic system respectively differentiate major depressive from generalized anxiety disorder. Neuropsychopharmacology46(4), 791–798 (2021).
- Kaiser RH , CleggR , GoerFet al. Childhood stress, grown-up brain networks: corticolimbic correlates of threat-related early life stress and adult stress response. Psychol. Med.48(7), 1157–1166 (2018).
- Xu J , WangR , LiuY , LiuD , JiangH , PanF. FKBP5 and specific microRNAs via glucocorticoid receptor in the basolateral amygdala involved in the susceptibility to depressive disorder in early adolescent stressed rats. J. Psychiatr. Res.95, 102–113 (2017).
- Xu J , WangR , LiuYet al. Short- and long-term alterations of FKBP5-GR and specific microRNAs in the prefrontal cortex and hippocampus of male rats induced by adolescent stress contribute to depression susceptibility. Psychoneuroendocrinology101, 204–215 (2019).
- Plotsky PM , MeaneyMJ. Early, postnatal experience alters hypothalamic corticotropin-releasing factor (CRF) mRNA, median eminence CRF content and stress-induced release in adult rats. Mol. Brain Res.18(3), 195–200 (1993).
- Timberlake M II , RoyB , DwivediY. A novel animal model for studying depression featuring the induction of the unfolded protein response in hippocampus. Mol. Neurobiol.56(12), 8524–8536 (2019).
- Cohen H , MatarMA , JosephZ. Animal models of post-traumatic stress disorder. Curr. Protoc. Neurosci.Chapter 9, Unit 9.45 (2013).
- Robinson MD , OshlackA. A scaling normalization method for differential expression analysis of RNA-seq data. Genome Biol.11(3), R25 (2010).
- Rousseeuw PJ , KaufmanL. Divisive Analysis (Program DIANA). Finding groups in data.John Wiley & Sons, Inc., Hoboken, NJ, USA, 253–279 (1990).
- Friedlander MR , ChenW , AdamidiCet al. Discovering microRNAs from deep sequencing data using miRDeep. Nat. Biotechnol.26(4), 407–415 (2008).
- Zhou Y , ZhouB , PacheLet al. Metascape provides a biologist-oriented resource for the analysis of systems-level datasets. Nat. Commun.10(1), 1523 (2019).
- Ge SX , JungD , YaoR. ShinyGO: a graphical gene-set enrichment tool for animals and plants. Bioinformatics36(8), 2628–2629 (2020).
- Pfau ML , PurushothamanI , FengJet al. Integrative analysis of sex-specific microRNA networks following stress in mouse nucleus accumbens. Front. Mol. Neurosci.9, 144 (2016).
- Sun N , YangC , HeXet al. Impact of expression and genetic variation of microRNA-34b/c on cognitive dysfunction in patients with major depressive disorder. Neuropsychiatr. Dis. Treat.16, 1543–1554 (2020).
- Yoshino Y , RoyB , DwivediY. Altered miRNA landscape of the anterior cingulate cortex is associated with potential loss of key neuronal functions in depressed brain. Eur. Neuropsychopharmacol.40, 70–84 (2020).
- Van Der Auwera S , AmelingS , WittfeldKet al. Association of childhood traumatization and neuropsychiatric outcomes with altered plasma micro RNA-levels. Neuropsychopharmacology44(12), 2030–2037 (2019).
- Jeyaseelan K , LimKY , ArmugamA. MicroRNA expression in the blood and brain of rats subjected to transient focal ischemia by middle cerebral artery occlusion. Stroke39(3), 959–966 (2008).
- Liu DZ , TianY , AnderBPet al. Brain and blood microRNA expression profiling of ischemic stroke, intracerebral hemorrhage, and kainate seizures. J. Cereb. Blood Flow Metab.30(1), 92–101 (2010).
- Sorensen SS , NygaardAB , NielsenMY , JensenK , ChristensenT. miRNA expression profiles in cerebrospinal fluid and blood of patients with acute ischemic stroke. Transl. Stroke Res.5(6), 711–718 (2014).
- Morrison KE , NarasimhanS , FeinE , BaleTL. Peripubertal stress with social support promotes resilience in the face of aging. Endocrinology157(5), 2002–2014 (2016).
- Fang K , XuJX , ChenXXet al. Differential serum exosome microRNA profile in a stress-induced depression rat model. J. Affect. Disord.274, 144–158 (2020).
- Song W , ShenY , ZhangYet al. Expression alteration of microRNAs in nucleus accumbens is associated with chronic stress and antidepressant treatment in rats. BMC Med. Inform. Decis. Mak.19(Suppl. 6), 271 (2019).
- Haramati S , NavonI , IsslerOet al. MicroRNA as repressors of stress-induced anxiety: the case of amygdalar miR-34. J. Neurosci.31(40), 14191–14203 (2011).
- Dickson DA , PaulusJK , MensahVet al. Reduced levels of miRNAs 449 and 34 in sperm of mice and men exposed to early life stress. Transl. Psychiatry8(1), 101 (2018).
- Linnstaedt SD , RueckeisCA , RikerKDet al. MicroRNA-19b predicts widespread pain and posttraumatic stress symptom risk in a sex-dependent manner following trauma exposure. Pain161(1), 47–60 (2020).
- Bai M , ZhuX , ZhangYet al. Abnormal hippocampal BDNF and miR-16 expression is associated with depression-like behaviors induced by stress during early life. PLoS ONE7(10), e46921 (2012).
- Liu Y , LiuD , XuJ , JiangH , PanF. Early adolescent stress-induced changes in prefrontal cortex miRNA-135a and hippocampal miRNA-16 in male rats. Dev. Psychobiol.59(8), 958–969 (2017).
- Im HI , KennyPJ. MicroRNAs in neuronal function and dysfunction. Trends Neurosci.35(5), 325–334 (2012).
- Guo L , ZhuZ , WangGet al. microRNA-15b contributes to depression-like behavior in mice by affecting synaptic protein levels and function in the nucleus accumbens. J. Biol. Chem.295(20), 6831–6848 (2020).
- Middeldorp CM , SullivanPF , WrayNRet al. Suggestive linkage on chromosome 2, 8, and 17 for lifetime major depression. Am. J. Med. Genet. B150B(3), 352–358 (2009).
- Abkevich V , CampNJ , HenselCHet al. Predisposition locus for major depression at chromosome 12q22–12q23.2. Am. J. Hum. Genet.73(6), 1271–1281 (2003).
- Munoz-Llanos M , Garcia-PerezMA , XuXet al. MicroRNA profiling and bioinformatics target analysis in dorsal hippocampus of chronically stressed rats: relevance to depression pathophysiology. Front. Mol. Neurosci.11, 251 (2018).
- Yang N , ChenJ , ZhangHet al. LncRNA OIP5-AS1 loss-induced microRNA-410 accumulation regulates cell proliferation and apoptosis by targeting KLF10 via activating PTEN/PI3K/AKT pathway in multiple myeloma. Cell Death Dis.8(8), e2975 (2017).
- Zhao D , JiaP , WangW , ZhangG. VEGF-mediated suppression of cell proliferation and invasion by miR-410 in osteosarcoma. Mol. Cell. Biochem.400(1–2), 87–95 (2015).
- Seok JK , LeeSH , KimMJ , LeeYM. MicroRNA-382 induced by HIF-1alpha is an angiogenic miR targeting the tumor suppressor phosphatase and tensin homolog. Nucleic Acids Res.42(12), 8062–8072 (2014).
- Zhang X , KeX , PuQet al. MicroRNA-410 acts as oncogene in NSCLC through downregulating SLC34A2 via activating Wnt/beta-catenin pathway. Oncotarget7(12), 14569–14585 (2016).
- Roy B , DunbarM , AgrawalJ , AllenL , DwivediY. Amygdala-based altered miRNome and epigenetic contribution of miR-128-3p in conferring susceptibility to depression-like behavior via Wnt signaling. Int. J. Neuropsychopharmacol.23(3), 165–177 (2020).
- Yang Y , ChengZ , TangHet al. Neonatal maternal separation impairs prefrontal cortical myelination and cognitive functions in rats through activation of Wnt signaling. Cereb. Cortex27(5), 2871–2884 (2017).
- Smith SS , DoleNS , FranceschettiT , HrdlickaHC , DelanyAM. MicroRNA-433 dampens glucocorticoid receptor signaling, impacting circadian rhythm and osteoblastic gene expression. J. Biol. Chem.291(41), 21717–21728 (2016).
- Zhang J , ZhangJ , LiuLHet al. Effects of miR-541 on neurite outgrowth during neuronal differentiation. Cell Biochem. Funct.29(4), 279–286 (2011).
- Wu D , MurashovAK. MicroRNA-431 regulates axon regeneration in mature sensory neurons by targeting the Wnt antagonist Kremen1. Front. Mol. Neurosci.6, 35 (2013).
- Bale TL , EppersonCN. Sex differences and stress across the lifespan. Nat. Neurosci.18(10), 1413–1420 (2015).
- Pena CJ , NestlerEJ , BagotRC. Environmental programming of susceptibility and resilience to stress in adulthood in male mice. Front. Behav. Neurosci.13, 40 (2019).
- Stoltenborgh M , Bakermans-KranenburgMJ , Van IjzendoornMH. The neglect of child neglect: a meta-analytic review of the prevalence of neglect. Soc. Psychiatry Psychiatr. Epidemiol.48(3), 345–355 (2013).