
Abstract
Background: Binge-level prenatal alcohol exposure (PAE) causes developmental abnormalities, which may be mediated in part by epigenetic mechanisms. Despite this, few studies have characterised the association of binge PAE with DNA methylation in offspring. Methods: We investigated the association between binge PAE and genome-wide DNA methylation profiles in a sex-specific manner in neonatal buccal and placental samples. Results: We identified no differentially methylated CpGs or differentially methylated regions (DMRs) at false discovery rate <0.05. However, using a sum-of-ranks approach, we identified a DMR in each tissue of female offspring. The DMR identified in buccal samples is located near regions with previously-reported associations to fetal alcohol spectrum disorder (FASD) and binge PAE. Conclusion: Our findings warrant further replication and highlight a potential epigenetic link between binge PAE and FASD.
Lay abstract
Women who binge-drink alcohol in pregnancy are more likely to have children with health and behavioural problems. It is possible that this happens through changes to the ‘epigenetic’ switches that control our genes. Yet few have tried to prove this. To test this idea, we designed a study called ‘Asking QUestions about Alcohol in pregnancy’. We carefully measured levels of drinking across all trimesters in volunteers who were pregnant. Then we measured one type of ‘gene switch’ in cells from the placenta and from the cheeks of their babies. We did not find strong evidence that maternal binge drinking changed ‘epigenetic’ gene switches in babies. However, when we looked at female offspring only, we did find some evidence. The genes that we found had been seen by others in similar studies. Our findings have no immediate medical application but provide evidence for conducting larger studies.
Introduction
Maternal consumption of alcohol during pregnancy is a major public health issue due to its teratogenic and neurotoxic potential. Prenatal alcohol exposure (PAE) can disrupt fetal neurodevelopment and result in fetal alcohol spectrum disorder (FASD) [Citation1]. Australia has documented some of the highest rates of FASD internationally in specific subpopulations, including 19% in high-risk Aboriginal communities [Citation2] and 36% in juvenile justice [Citation3]. Previous studies also show associations between high levels of PAE and outcomes including reduced birth weight and length [Citation4], stillbirth [Citation5], brain white matter deficits [Citation6] and cerebral palsy [Citation7]. Definitions of high PAE in these studies vary and include: one or two drinks per day plus binge; three drinks per day with or without binge; or presence of an alcohol-related diagnosis.
In our well-characterized cohort, Asking QUestions about Alcohol in pregnancy (AQUA) [Citation8], one in five women binge drank (defined as ≥5 standard drinks per occasion) before pregnancy recognition in trimester 1 [Citation9], a period that is crucial for development of the nervous system [Citation10]. In their children at age 12 months, all levels of PAE, including early-pregnancy binge episodes, were associated with altered craniofacial [Citation11] and an increase in sensation-avoiding behavior at 2 years [Citation12]. Other studies have shown an association between binge-level PAE and slower choice reaction time in 5-year-old children [Citation13] and behavioral difficulties at a similar age [Citation14].
DNA methylation of cytosine at the CpG dinucleotide, the most studied epigenetic mark, has been implicated as a mediator between early life environment and risk of chronic disorders [Citation15–17], including FASD [Citation18–22]. High levels of PAE induce epigenetic changes in genes involved in cell adhesion, neurodevelopment and transcriptional regulation in rodent models [Citation20,Citation23]. FASD has also been associated with accelerated epigenetic age, a marker of accelerated aging [Citation24]. Furthermore, studies of a wider range of PAE found that dose and timing of PAE are the most important factors in predicting phenotypic and epigenetic state [Citation25–28]. In animal models of PAE, offspring sex appears to be an important mediator of alcohol-induced epigenetic modifications and long-term health outcomes [Citation29,Citation30]. In our previous study on the effect of PAE in the AQUA cohort, we found sex-specific effects of PAE on global DNA methylation in human placenta [Citation31].
To our knowledge, only two studies have analyzed the effect of PAE on offspring DNA methylation on a genome-wide scale, independent of FASD status [Citation32,Citation33]. Simpkin et al. calculated epigenetic age acceleration using Infinium HM450 arrays on peripheral blood DNA from 1018 mother–child pairs in a longitudinal study. They reported increased growth of 0.19 years of age acceleration per year of life during childhood (age 7 years) and adolescents (aged 15 or 17 years) in the PAE group. However, levels and timing of PAE are unknown [Citation33]. Using the same array platform, Sharp et al. measured DNA methylation in cord blood DNA from 3075 mother–child pairs across six population-based cohorts. Using a false discovery rate (FDR) cutoff of 0.05, they found no evidence for an association between PAE at any level and offspring DNA methylation. However, for binge PAE they found that the methylation level of a single CpG, overlapping the ARSG and SLC16A6 genes, was significantly associated with PAE when adjusting for technical covariates, maternal age, maternal education, maternal smoking and cellular heterogeneity. Although this study had a large sample size, its individual datasets were heterogeneous in the way they defined binge PAE (ranged from four to six or more drinks per occasion compared with drinking in moderation).
Studies are urgently needed to understand the effect of binge PAE on offspring epigenetics in cohorts with well-defined levels of PAE. We aimed to address this using the carefully measured PAE data collected in the AQUA cohort [Citation8] by investigating genome-wide DNA methylation in two tissues collected soon after birth: buccal epithelium and placenta. Buccal epithelium was chosen because it is a promising surrogate marker for DNA methylation in the brain [Citation34,Citation35], and it has previously been used to identify potential DNA methylation biomarkers of FASD [Citation18,Citation22]. The placenta is the key regulator of fetal development and has great utility in measuring impact of prenatal exposures as it directly contacts with maternal blood.
Given the prior reports of sex-specific effects of PAE on placental [Citation31,Citation36,Citation37] and brain development [Citation37–39], we hypothesized a sex-specific association between binge PAE and DNA methylation variation in exposed offspring.
Materials & methods
Study population
The data and biospecimens used for this study came from a subset of 1570 participants in the AQUA cohort study from whom biospecimens were collected [Citation8]. Pregnant women were eligible for inclusion at the time of recruitment if they were 16 years or older, at less than 19 weeks’ gestation, had a singleton pregnancy and were proficient in English. As outlined previously [Citation8], questionnaires were administered within each trimester of pregnancy. These questionnaires collected data on demographics, obstetric history, health, alcohol and other lifestyle factors, family and relationships. Placental biopsies and buccal swabs from newborns were collected as previously described [Citation8]; 154 buccal (79 males, 74 females, 1 missing sex data) and 105 placental (54 males, 51 females) DNA samples were sent separately to Service XS (Leiden, The Netherlands). Of these, we have DNA methylation data from 50 samples from both tissues. These samples were chosen based on availability of high-quality DNA from offspring of all mothers who consumed alcohol at binge levels during trimester (T) 1 and mothers who abstained 3 months before and after pregnancy.
Covariates selected for this study were taken from the maternal self-report questionnaires; pre-pregnancy BMI, maternal age at recruitment, maternal education attainment, household income per year, mode of delivery, smoking while pregnant (yes/no), maternal ethnicity (European origin/non-European origin), dietary patterns in T2 (assessed using Dietary Questionnaire for Epidemiological Studies volume 2 [DQES v2]) [Citation40,Citation41]), periconceptional folic acid supplementation (<400 or ≥400 mcg), partner’s alcohol consumption 3 months before pregnancy (less than moderate, moderate or greater consumption), quality of life (assessed using Assessment of Quality of Life [AQoL-6D] [Citation42]) and weight gain during pregnancy (difference in pre-pregnancy weight and weight reported at 35 weeks’ gestation). Covariates from newborns were sex, gestational age at birth and birthweight.
Assessment of alcohol exposure
Information on frequency of alcohol consumption and alcohol types was collected by questionnaire from mothers during Ts 1–3 and retrospectively for the 3 months before pregnancy. Data from T1 were separated into the periods before and after women were aware they were pregnant. In the AQUA study, binge-level alcohol exposure was defined as ≥50 g absolute alcohol (AA) or five Australian standard drinks per occasion [Citation8]. There was no binge-level exposure post-T1 in any of the samples included in this study, but the group consisted of a mixture of T2/T3 PAE, albeit at lower levels. The ‘control’ group comprised children of women who did not consume alcohol for 3 months before and throughout pregnancy but who were not lifetime abstainers. These two groups will be referred to as ‘binge PAE’ and ‘control’, respectively, in this study.
Placenta & buccal swab sample collection & DNA extraction
Placental tissue samples were processed similarly to our previously published study [Citation31]. Briefly, three full-thickness sections were obtained randomly from the placenta using a 6-mm diameter disposable biopsy punch. Placental biopsies were rinsed with sterile phosphate-buffered saline and stored in RNAlater (Qiagen; Venlo, The Netherlands) for up to 72 h at 4°C, followed by dissection of the central section of each biopsy. Dissected pieces of the same sample were pooled in a single vial and stored at -20°C until DNA extraction. DNA was isolated using phenol:chloroform extraction, according to our previously published study [Citation43].
Infant buccal samples were collected as previously described [Citation8] using FLOQSwabs (COPAN Diagnostics, CA, USA) within 28 d of birth. Mothers were instructed to collect samples before breastfeeding to avoid contamination from maternal cells. These swabs were stored at -80°C until DNA extraction. DNA was extracted using a high salt concentration (5 M NaCl) method, as previously described [Citation43]. DNA yield for both tissues was quantified using NanoDrop (Thermo Fisher Scientific, CA, USA).
DNA methylation profiling
Five hundred nanograms of genomic DNA from each placenta and buccal sample was sent to Service XS for sodium bisulphite treatment and array analysis using Illumina InfiniumMethylation450 (HM450) BeadChips [Citation44,Citation45] that interrogate DNA methylation at over 450,000 CpG sites per sample using array probes. The samples were placed onto the array with a random distribution.
Data processing, normalisation, batch adjustment & cell type proportion estimation
Raw intensity data (IDAT files) were imported into R Studio (version 3.6.1; https://rstudio.com/) and processed using minfi [Citation46], limma [Citation47], missMethyl [Citation48], SVA [Citation49] and EpiDISH [Citation50] packages. Detection p-values were calculated for each probe to indicate whether signal from a probe was significantly different from the background signal, where a high p-value would indicate no significant difference. Samples with mean detection p-values >0.002 were removed, followed by removal of individual probes with detection p-values >0.01 from remaining samples. Data were normalized using subset quantile normalization (SQN) [Citation51]. Probes that contain an SNP at the CpG or at the single base extension site, those known to be cross-reactive, and those from the X and Y chromosomes were also removed. The ComBat algorithm [Citation49,Citation52] was used to adjust for batch effects. Principal component analysis (PCA) was performed to determine sources of variation within the data. The top principal component (PC) contributes to the largest variation in the data. Cell type proportions, which can be strong confounders in studies of DNA methylation [Citation34,Citation35], were estimated using the EpiDISH method [Citation53], which estimates proportions of epithelial, immune and fibroblast cells.
Identification of potential confounders
Multidimensional scaling (MDS) plots were performed to check for any distinct DNA methylation differences between males and females in both datasets. Similar to our previous study [Citation31], potential confounders were identified separately for males and females. Covariates were considered as confounders in this study if there was evidence of association with PAE and they contributed significantly to variation in DNA methylation. Associations between PAE and each covariate were analyzed using Fisher’s exact test for categorical variables and Mann-Whitney U test for continuous variables. Evidence of association was considered as p < 0.05. PCs were calculated and the first ten were graphed as a scree plot. The number of PCs before the scree plot ‘elbow bend’ were considered to capture the largest amount of variation in the data. Subsequently, correlation heatmaps were plotted to investigate evidence of strong correlation between these PCs and covariates. Evidence of strong correlation as considered as correlation coefficient >0.5 with p < 0.05. MDS plots were also used to identify covariates that could contribute to the sources of DNA methylation data variation.
Statistical analyses
Linear regression modeling, using the limma [Citation47] package, was used to identify differentially methylated probes (DMPs) between the control and binge PAE groups. An unadjusted p-value threshold of <2 × 10⁻⁷, recommended by study of permutation methods based on five previous genome-wide methylation datasets [Citation54], was used as a cutoff. To optimize the discovery of biologically relevant DNA methylation differences, we used a ‘sum-of-ranks’ approach used by previous studies of disease-associated epigenetic differences [Citation55–57] on our top 1000 limma-ranked probes. This sum-of-ranks approach combines magnitude (absolute DNA methylation difference between control and binge PAE groups) and strength of evidence (p-value). In the top ten sum-of-rank probes, two or more probes clustering within 1 kb, a size similar to previous studies [Citation32,Citation58,Citation59], were considered as differentially methylated regions (DMRs). For comparison, DMR analysis was also performed on all analyzable probes using DMRcate [Citation60], with lambda = 1000, C = 2 and FDR = 1 as our parameters. p-values in DMRcate were computed at an individual probe level using Satterthwaite method [Citation61] after Gaussian smoothing. These p-values were then adjusted using Benjamini-Hochberg method [Citation62], and the minimum adjusted p-value (minFDR) in a region was taken as a representative of the statistical inference [Citation60,Citation63]. Regions from DMRcate output were ranked by minFDR.
Results
Participant characteristics
compares the characteristics of maternal and infant participants between control and binge PAE groups by tissue type (buccal or placental). The following characteristics differed significantly (p < 0.05) between control and binge PAE groups in both tissue datasets: household income, partner alcohol consumption 3 months before pregnancy and gestational age at birth. Several other significant associations were also observed, but these were not consistent across the two samples. Characteristics such as healthy eating pattern in T2, maternal folic acid supplementation 3 months before pregnancy and ethnicity were significantly different only in the buccal data. There was a moderate difference (p = 0.05, ) in the proportion of mothers who smoked between the control and binge PAE groups for placental data only.
Table 1. Comparison of maternal and infant characteristics between abstinent and binge PAE groups in buccal and placental samples.
Data processing, filtering, batch adjustment & estimation of cellular heterogeneity
Five buccal samples were above mean detection p-value threshold and therefore removed from further analysis. One buccal sample with missing sex data was also excluded from the analysis (total buccal samples for downstream analysis = 77 males, 71 females). All placenta samples were retained (n = 54 males, 51 females). Probes with fluorescence intensity signals not significantly different from background, nonspecific, annotated on an SNP and sex chromosomes, were removed, resulting in 422,306 and 426,389 analyzable probes in buccal and placenta data, respectively (Supplementary Figure 1).
PC plots and univariate analysis between the top three PCs and chip number indicated an influence of batch effect in both tissues and these were adjusted using ComBat (Supplementary Figure 2). Cell type proportion estimates showed that, on average, buccal samples comprised of predominantly epithelial cells (98%) and placenta samples comprised of 57% epithelial cells, 31% fibroblasts and 12% immune cells (Supplementary Figure 3A & B). As the proportions of placental cell types were highly correlated (Supplementary Figure 3C & D), we only considered the epithelial cell proportion as a covariate in analyses.
Determination of confounders
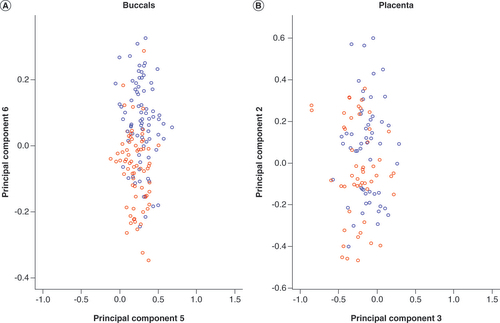
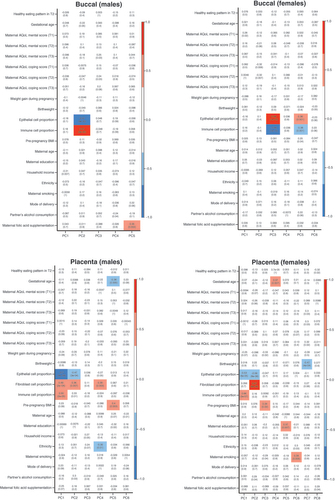
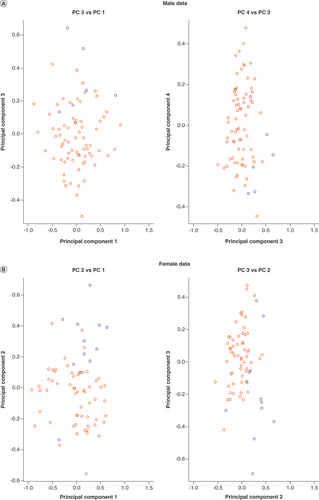
MDS plots showed that infant sex contributed to the degree of separation in both tissues, with PC 6 in buccal and PC 2 in placenta (), strengthening our rationale to analyze males and females separately. Scree plots were graphed in both tissues for males and females (Supplementary Figure 4). For the buccal samples, PCs 1–5 and 1–6 captured the most variation in males and females, respectively. For the placenta, most variation was captured by PCs 1–6 in males and 1–8 in females (Supplementary Figure 4). PCA heatmaps showed evidence for correlation of cell type proportion with top PCs (). However, we found no evidence for an association of epithelial cell proportions with binge PAE in either tissue (p = 0.39 and p = 0.35 in buccal and placental samples, respectively). Therefore, cell type proportions were not considered as confounders in subsequent analyses. Using MDS plots, we observed some separation of groups with European and non-European origin in both female and male buccal data (), but not in the placental data (Supplementary Figure 5). We also found evidence of association between ethnicity and binge PAE in buccal tissue (p = 0.03, ). Therefore, ethnicity was included in our regression model as a confounder for the analysis of buccal methylation data.
Multidimensional scaling plot of (A) buccal and (B) placenta datasets coloured according to sex. These plots illustrate that DNA methylation variation captured by principal component 6 and principal component 2 in buccal and placenta datasets, respectively, is largely attributed to sex (blue circles: male; red circles: female).
Pearson’s correlation coefficients are listed in each box, along with the p-values in brackets. Strength of correlation is annotated by the color legend. Covariates with a correlation coefficient > ±0.5 and p-values <0.05 were considered to be significantly associated with variation in DNA methylation. Cell type was highly correlated with the top principal components of interest in all groups.
AQoL: Assessment of quality of life; T: Trimester.
Multidimensional scaling plots illustrate that dataset of non-European origin samples (blue circles) are distinct from European origin samples (red circles), captured by (A) PC 3 for males and (B) PC 2 for females.
PC: Principal component.
Differential methylation analysis
In our regression analysis, we found no DMPs at a genome-wide levels of significance (unadjusted p < 2 × 10⁻⁷) in males or females in either buccal (Supplementary Table 1A & B) or placental data (Supplementary Table 2A & B). Using the sum-of-ranks approach, we found one DMR in buccal data ( & A) and one in placental data ( & B) from female offspring. Of the top 10 sum-of-ranked probes, four were clustered within 593 bp (chr8: 599963–600555, UCSC Genome Browser version GRCh37/hg19) in buccal data. Average DNA methylation levels of these four probes were between 9 and 16% higher with binge PAE compared with controls (unadjusted p-values 1–5 × 10⁻⁵; A & ), suggesting a DMR in this region. This region lies in an intron of the ERICH1 gene and is 5.6 kb away from the transcriptional start site of the long noncoding RNA AK128400 (GEO Accession GPL16304). This DMR overlaps with two CpG islands and a cluster of DNAse1 hypersensitivity sites (A). It is also part of a larger DMR, consisting of eight CpGs spanning 1,416 bp, identified by DMRcate. This DMR ranked highest in the buccal dataset and had an average of 8% higher DNA methylation with binge PAE compared with controls (A). Two of the other top ten DMPs also mapped to ERICH1, 18.2 kb and 33.6 kb 3′ of this DMR (A, ).
(A) Overlapping line plots that depict a potential DMR. Solid and dotted lines denote average DNA methylation (beta) values of binge PAE and control groups respectively for probes annotated to chromosome 8 found within the 10 sum-of-ranked probes. Probes are ordered according to genomic position on the x-axis. The four probes in black boxes (cg23958373, cg07234876, cg26554054, cg15331088) are in the top 10 sum-of-ranked probes that clustered within 1000 bp. The gray box highlights the potential DMR. The two probes (cg05028639, cg24842815) marked with asterisks are the other top 10 differentially methylated probes mapped to ERICH1, 18.2 kb and 33.6 kb 3′ of the potential DMR. (B) Boxplots illustrating beta value differences between control and binge PAE groups of the four clustered probes in the top 10 sum-of-ranked probes. The thick lines in the boxes represent the median, the boxes represent data within the 25th and 75th percentile range, whiskers represent the 5th–95th percentile range. The circles are the outliers.
DMR: Differentially methylated region; PAE: Prenatal alcohol exposure.
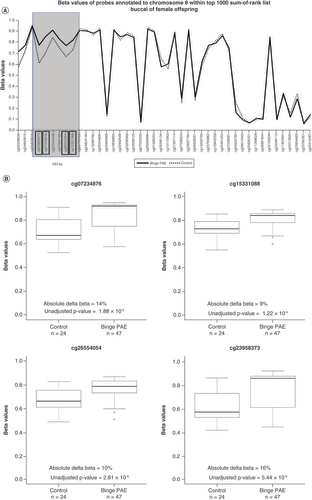
Table 2. Top 10 probes ranked by ‘sum of ranks’ in female buccal (n = 71) and placental (n = 51) datasets.
(A) Overlapping line plots that depict a potential DMR; solid and dotted lines denote average beta values of binge PAE and control groups respectively for probes annotated to chromosome 8 found within the top 10 sum-of-ranked probes. Probes are ordered according to genomic position on the x-axis. The three probes in black boxes (cg14745270, cg2751169, cg01197613) are in the top 10 sum-of-ranked probes that clustered within 1000 bp. The gray box highlights the potential DMR. (B) Boxplots illustrate beta value differences of between control and binge PAE groups of the three clustered probes in the top 10 sum-of-ranked probes. The thick lines in in the boxes represent the median, the boxes represent data within the 25th and 75th percentile range, whiskers represent the 5th–95th percentile range. The circles are the outliers.
DMR: Differentially methylated region; PAE: Prenatal alcohol exposure.
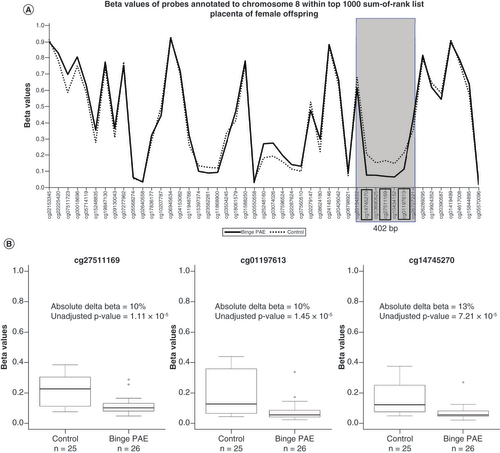
Table 3. Top 10 regions from DMRcate ranked by ‘minfdr’ in female buccal (n = 71) and placenta (n = 51) dataset.
In the placental data, we observed three probes in the top 10 sum-of-ranked probes that were clustered within 402 bp specifically in females (chr 8: 110703888–110704289, UCSC Genome Browser version GRCh37/hg19; , B). These three probes showed higher DNA methylation levels with binge PAE compared with controls. Differences ranged from 10 to 13% (unadjusted p-values 1–7 × 10⁻⁵), suggesting a DMR in this region. This cluster of differentially methylated CpGs overlaps with a CpG island, a CpG island shore, and a cluster of DNAse1 hypersensitivity sites. It also includes the transcriptional start site of the SYBU gene, also known as GOSLYN (B). This region was part of a larger DMR, consisting of 12 CpGs over 2343 bp, identified by DMRcate. It was ranked highest in the dataset with an average of 5% lower DNA methylation in binge PAE compared with controls (B).
No cluster was seen in the top ten sum-of-ranked probes in males, in either the placental or buccal tissue (Supplementary Tables 1A & 2A).
Discussion
In this study, we aimed to determine whether exposure to binge levels of PAE was associated with a detectable difference in offspring DNA methylation on a genome-wide scale. We compared DNA from buccal and placental tissues of newborns exposed to binge PAE to that of newborns without PAE. With extensive information collected on PAE and potential confounders, the AQUA cohort is one of the few studies suitable to address this aim. On the basis of our previous study [Citation31], other recommendations [Citation64,Citation65] and clustering seen in our plots of principal components, analyses were stratified by sex.
We found no evidence that binge-level PAE was associated with DMPs at genome-wide levels of significance in either tissue in males or females. This is concordant with a prior study of the effects of PAE on genome-wide DNA methylation in offspring [Citation32]. However, in our female buccal dataset, four of our top 10 sum-of-ranked probes clustered within a region of 593 bp in chromosome 8 (a), with all four probes showing higher DNA methylation in the binge PAE group compared to the control group. Effect sizes were on average 9% or greater, which is considered moderately large in the context of DNA methylation studies [Citation66]. This region was also part of the highest-ranked DMR found by DMRcate, with an overall average effect size of 8%. The presence of CpG islands and DNAse1 hypersensitivity sites suggest that this DMR plays a role in gene regulation. This DMR is 5.6 kb away from the transcriptional start site of the long noncoding RNA AK128400 and within an intron of a splice variant of ERICH1. Two additional probes from the top ten in female buccal data were located 8.7–24.0 kb downstream within ERICH1 (A) but were not part of our top DMRs. One of these, cg24842815 is located only 98 bp away from a FASD-associated probe validated in two cohorts of children (FDR = 1.41 × 10⁻³, effect size -2.5%) [Citation67]. DNA methylation level in another region of ERICH1, 49.0 kb upstream of our DMR, has also been associated with binge PAE in cord blood DNA (unadjusted p = 8.18 × 10⁻⁴, effect size = -1% [Citation32]). Thus, the association of both AK128400 and ERICH1 in association with binge levels of PAE needs to be investigated further.
There are limited data on the function of AK128400, apart from one study which found downregulated expression in post mortem brains from two patients with autism spectrum disorder compared with two neurotypical controls [Citation68]. Little is known about the function of ERICH1, but a cluster of three HM450 probes 37.4 kb 5′ of our DMR was identified using a similar sum-of-rank method to ours in a comparison of CD4+ T cells from 28 females with multiple sclerosis and 22 age-matched controls [Citation69].
In our female placenta dataset, the 402-bp cluster of three within the top 10 sum-of-ranked probes lies within the SYBU gene promoter, with all three probes showing lower DNA methylation in binge PAE compared with the control group. This region was also part of the highest ranked DMR found by DMRcate, which had an average effect size of 5%, lower in magnitude than the top DMR in the buccal dataset. SYBU is a kinesin motor adapter [Citation70–72] and plays a role in neurodevelopment in mice [Citation73,Citation74]. SYBU-knockout mice exhibit autism-like behaviors, as do humans with a SYBU missense variant [Citation75]. Protein levels of SYBU correlate with cognitive impairment and dementia in humans [Citation76]. However, to our knowledge, no previous study has reported an association of SYBU with PAE.
Our findings in buccal and placental DNA of female offspring provided some insight into the impact of PAE on DNA methylation. However, given that our results did not meet the adjusted threshold of significance and that our sample size is small, the regions reported here require further replication and cannot be applied as biomarkers in a clinical context. Animal and human studies of PAE have yet to replicate any consistent DNA epigenetic biomarker of binge or other PAE. This is in contrast to published associations of maternal smoking and significant differences in DNA methylation of multiple CpGs with the AHRR, CYP1A1 and GFI1 genes which have been replicated in at least three cohorts [Citation77,Citation78]. This contrast could suggest that PAE has little or no impact on DNA methylation, that sufficiently large studies have yet to be performed with this exposure and/or that effects of PAE could be sensitive to dosage and timing, unlike maternal smoking.
The main strength of this study lies in the detailed characterization of PAE by dose and timing [Citation8], which allowed us to investigate the impact of binge-level PAE on DNA methylation profiles of newborns. The AQUA cohort also provided comprehensive information on covariates, which allowed us to adjust for potential confounders. We were also able to study two tissue types in exposed newborns, which allowed us to identify DMRs in a tissue-specific manner. A limitation of this study is that PAE status is dependent on mothers’ reports; however, reporting bias was minimized by prospective data collection during pregnancy and by contextualizing questions based on focus group work in which pregnant women identified specific measures to increase accurate reporting [Citation79]. Our sample size is relatively small compared with the studies included in a previous meta-analysis of the effect of PAE on offspring cord blood DNA [Citation32] but avoids the heterogeneity of that meta-analysis (such as difference in definition of binge PAE) and provides insight into sex-specific effects on the influence of binge PAE on DNA methylation. Also, we were unable to perform technical validation on the two reported regions of interest due to lack of sufficient DNA. However, ours [Citation80–82] and many other studies of HM450 arrays have shown successful technical validation, indicating the reliability of the platform. We also do not have cord blood DNA methylation data to compare with the current EWAS data.
Conclusion
We found no strong evidence of a significant association between binge-level PAE and genome-wide DNA methylation variation in buccal or placental tissues of male or female newborns. However, using two complementary approaches that combined effect sizes and p-values, we observed two genomic regions with associations between binge-level PAE and DNA methylation, specifically in female offspring. DNA methylation in one of the DMR-associated genes, ERICH1, has been shown by two independent studies to be impacted by FASD and binge PAE in humans. The other gene, SYBU, is likely to play a role in neurodevelopment, cognition and behavior. Our findings warrant further replication and highlight a potential epigenetic link between binge PAE and FASD.
Future perspective
In this study, we identified two DMRs associated with binge PAE in female offspring using a relatively small but well-characterized dataset. These regions have been implicated previously in epigenetic studies of FASD, PAE and/or neurodevelopmental disorders. Although our findings add to a large body of work from human and animal studies, a wide gap still remains in understanding the influence of PAE on DNA methylation. There are two primary reasons that could contribute to this: small datasets and inconsistent study designs. Effect sizes reported in DNA methylation studies of environmental exposures have been relatively small, usually less than 5%. Although larger datasets could strengthen the evidence of findings with small effect sizes, the heterogeneity of PAE measurement across studies will be a hurdle. We call for a concerted effort to standardize study and analytical design in research on PAE, ideally via consortia. Future studies will also need to consider comparing PAE-associated findings from diverse population datasets to increase representation. Care should also be taken to consider the effect of potential confounders such as genetics, sex and ethnicity. We also need to work more with major stakeholders – including parents, people with FASD, pediatricians and community leaders – from the stage of research design to dissemination of results so that they can guide us through the sensitive issues involved and make sure our research will benefit those affected by FASD. In concert with this, we must always consider the ethical, legal and social implications of our research.
Few studies have investigated the association of binge-level prenatal alcohol exposure (PAE) and DNA methylation in offspring at birth.
We measured genome-wide DNA methylation in 149 newborn buccal and 105 placental samples from offspring with control and binge PAE data.
After data filtering and batch effect adjustment, 422,306 and 426,389 analyzable probes in buccal and placenta data remained.
Differential methylation analyses were performed in sex-stratified datasets from both tissues, and no differentially methylated probes and differentially methylated regions (DMRs) were identified in either dataset at a genome-wide level of significance.
Using a sum-of-ranks approach, we identified one DMR with regulatory potential in each tissue for female offspring dataset, with effect sizes of at least 9%.
Our findings highlight a potential epigenetic link between binge PAE and fetal alcohol spectrum disorder and warrant replication.
Author contributions
J Halliday, JM Craig and E Muggli conceived and designed the study. E Muggli, J Halliday, S Lewis and EJ Elliott were involved in the design, recruitment, and sample collection of AQUA cohort. S Lewis provided AQUA covariates for analysis. YJ Loke analyzed the data with input from J Ryan, E Muggli, JM Craig and J Halliday. YJ Loke and JM Craig wrote the manuscript with input from J Ryan, E Muggli, J Halliday, R Saffrey, EJ Elliott and S Lewis. All authors read and approved the final manuscript.
Ethical conduct of research
The AQUA project was approved by the Eastern Health Research and Ethics Committee (E54/1011) and the Human Research Ethics Committees of Mercy Health (R11/14), Monash Health (11071B), the Royal Women’s Hospital (11/20) and the Royal Children’s Hospital (31055A). In addition, for investigations involving human subjects, informed consent has been obtained from the participants involved.
Supplemental Document
Download Zip (2.1 MB)Acknowledgments
The authors are extremely grateful to all the women and their children who are taking part in this study and thank the researchers who were involved in sample collection. A special mention to J Maksimovic for her expertise and advice on analyzing genome-wide DNA methylation data.
Supplementary data
To view the supplementary data that accompany this paper please visit the journal website at: www.tandfonline.com/doi/suppl/10.2217/imt-2021-0285
Financial & competing interests disclosure
This work was supported by the Australian National Health and Medical Research Council Grant no. 1011070; Senior Research Fellowship no. 1021252 (J Halliday) and no. 1045161 (R Saffrey), and Practitioner Fellowship no. 1021480 (EJ Elliott); the Medical Research Futures Fund Next Generation Fellowship no. 1135959 (EJ Elliott); and the Victorian State Government’s Operational Infrastructure Support Program. The study has also received funding from the McCusker Charitable Trust to assist with the biospecimen collection at birth, Jack Brockhoff Foundation no. 3525 for genome-wide DNA methylation data generation of placenta samples, and Foundation for Children no. 2015-111 for genome-wide DNA methylation data generation of buccal samples. The authors have no other relevant affiliations or financial involvement with any organization or entity with a financial interest in or financial conflict with the subject matter or materials discussed in the manuscript apart from those disclosed.
No writing assistance was utilized in the production of this manuscript.
Additional information
Funding
References
- May PA , BlankenshipJ , MaraisASet al. Maternal alcohol consumption producing fetal alcohol spectrum disorders (FASD): quantity, frequency, and timing of drinking. Drug. Alcohol Depend.133(2), 502–512 (2013).
- Reid N . Fetal alcohol spectrum disorder in Australia: what is the current state of affairs?Drug. Alcohol Rev.37(7), 827–830 (2018).
- Bower C , WatkinsRE , MutchRCet al. Fetal alcohol spectrum disorder and youth justice: a prevalence study among young people sentenced to detention in Western Australia. BMJ Open8(2), e019605 (2018).
- O’Keeffe LM , KearneyPM , GreeneRAet al. Maternal alcohol use during pregnancy and offspring trajectories of height and weight: a prospective cohort study. Drug Alcohol Depend.153, 323–329 (2015).
- O’Leary C , JacobyP , D’AntoineHet al. Heavy prenatal alcohol exposure and increased risk of stillbirth. BJOG119(8), 945–952 (2012).
- Fan J , JacobsonSW , TaylorPAet al. White matter deficits mediate effects of prenatal alcohol exposure on cognitive development in childhood. Hum. Brain Mapp.37(8), 2943–2958 (2016).
- O’Leary CM , WatsonL , D’AntoineHet al. Heavy maternal alcohol consumption and cerebral palsy in the offspring. Dev. Med. Child Neurol.54(3), 224–230 (2012).
- Muggli E , O’LearyC , ForsterDet al. Study protocol: Asking QUestions about Alcohol in pregnancy (AQUA): a longitudinal cohort study of fetal effects of low to moderate alcohol exposure. BMC Pregnancy Childbirth14, 302 (2014).
- Muggli E , O’LearyC , DonathSet al. ‘Did you ever drink more?’ A detailed description of pregnant women’s drinking patterns. BMC Public Health16, 683 (2016).
- Borsani E , DellaVedova AM , RezzaniRet al. Correlation between human nervous system development and acquisition of fetal skills: an overview. Brain Dev.41(3), 225–233 (2019).
- Muggli E , MatthewsH , PeningtonAet al. Association between prenatal alcohol exposure and craniofacial shape of children at 12 months of age. JAMA Pediatr.171(8), 771–780 (2017).
- Halliday JL , MuggliE , LewisSet al. Alcohol consumption in a general antenatal population and child neurodevelopment at 2 years. J. Epidemiol. Community Health71(10), 990–998 (2017).
- Kilburn TR , EriksenHL , UnderbjergMet al. Low to moderate average alcohol consumption and binge drinking in early pregnancy: effects on choice reaction time and information processing time in five-year-old children. PLoS ONE10(9), e0138611 (2015).
- Nulman I , RovetJ , KennedyDet al. Binge alcohol consumption by non-alcohol-dependent women during pregnancy affects child behaviour, but not general intellectual functioning; a prospective controlled study. Arch. Womens Ment. Health7(3), 173–181 (2004).
- Godfrey KM , CostelloPM , LillycropKA. The developmental environment, epigenetic biomarkers and long-term health. J. Dev. Orig. Health Dis.6(5), 399–406 (2015).
- Waterland RA , MichelsKB. Epigenetic epidemiology of the developmental origins hypothesis. Annu. Rev. Nutr.27, 363–388 (2007).
- Bianco-Miotto T , CraigJM , GasserYPet al. Epigenetics and DOHaD: from basics to birth and beyond. J. Dev. Orig. Health Dis.8(5), 513–519 (2017).
- Portales-Casamar E , LussierAA , JonesMJet al. DNA methylation signature of human fetal alcohol spectrum disorder. Epigenetics Chromatin9, 25 (2016).
- Cobben JM , KrzyzewskaIM , VenemaAet al. DNA methylation abundantly associates with fetal alcohol spectrum disorder and its subphenotypes. Epigenomics11(7), 767–785 (2019).
- Laufer BI , Chater-DiehlEJ , KapalangaJ , SinghSM. Long-term alterations to DNA methylation as a biomarker of prenatal alcohol exposure: from mouse models to human children with fetal alcohol spectrum disorders. Alcohol60, 67–75 (2017).
- Laufer BI , KapalangaJ , CastellaniCA , DiehlEJ , YanL , SinghSM. Associative DNA methylation changes in children with prenatal alcohol exposure. Epigenomics7(8), 1259–1274 (2015).
- Lussier AA , MorinAM , MacisaacJLet al. DNA methylation as a predictor of fetal alcohol spectrum disorder. Clin. Epigenetics10, 5 (2018).
- Rogic S , WongA , PavlidisP. Meta-analysis of gene expression patterns in animal models of prenatal alcohol exposure suggests role for protein synthesis inhibition and chromatin remodeling. Alcohol Clin. Exp. Res.40(4), 717–727 (2016).
- Okazaki S , OtsukaI , ShinkoYet al. Epigenetic clock analysis in children with fetal alcohol spectrum disorder. Alcohol Clin. Exp. Res.45(2), 329–337 (2021).
- Nguyen VB , ProbynME , CampbellFet al. Low-dose maternal alcohol consumption: effects in the hearts of offspring in early life and adulthood. Physiol. Rep.2(7), (2014).
- Kleiber ML , DiehlEJ , LauferBIet al. Long-term genomic and epigenomic dysregulation as a consequence of prenatal alcohol exposure: a model for fetal alcohol spectrum disorders. Front. Genet.5, 161 (2014).
- Gangisetty O , WynneO , JabbarSet al. Fetal alcohol exposure reduces dopamine receptor D2 and Increases pituitary weight and prolactin production via epigenetic mechanisms. PLoS ONE10(10), e0140699 (2015).
- Boschen KE , McKeownSE , RothTL , KlintsovaAY. Impact of exercise and a complex environment on hippocampal dendritic morphology, Bdnf gene expression, and DNA methylation in male rat pups neonatally exposed to alcohol. Dev. Neurobiol.77(6), 708–725 (2017).
- Probyn ME , LockEK , AndersonSTet al. The effect of low-to-moderate-dose ethanol consumption on rat mammary gland structure and function and early postnatal growth of offspring. Am. J. Physiol. Regul. Integr. Comp. Physiol.304(10), R791–798 (2013).
- Gardebjer EM , AndersonST , PantaleonMet al. Maternal alcohol intake around the time of conception causes glucose intolerance and insulin insensitivity in rat offspring, which is exacerbated by a postnatal high-fat diet. FASEB J29(7), 2690–2701 (2015).
- Loke YJ , MuggliE , NguyenLet al. Time- and sex-dependent associations between prenatal alcohol exposure and placental global DNA methylation. Epigenomics10(7), 981–991 (2018).
- Sharp GC , ArathimosR , ReeseSEet al. Maternal alcohol consumption and offspring DNA methylation: findings from six general population-based birth cohorts. Epigenomics10(1), 27–42 (2018).
- Simpkin AJ , HemaniG , SudermanMet al. Prenatal and early life influences on epigenetic age in children: a study of mother-offspring pairs from two cohort studies. Hum. Mol. Genet.25(1), 191–201 (2016).
- Smith AK , KilaruV , KlengelTet al. DNA extracted from saliva for methylation studies of psychiatric traits: evidence tissue specificity and relatedness to brain. Am. J. Med. Genet. B Neuropsychiatr. Genet.168B(1), 36–44 (2015).
- Lowe R , GemmaC , BeyanHet al. Buccals are likely to be a more informative surrogate tissue than blood for epigenome-wide association studies. Epigenetics8(4), 445–454 (2013).
- Kalisch-Smith JI , SteaneSE , SimmonsDGet al. Periconceptional alcohol exposure causes female-specific perturbations to trophoblast differentiation and placental formation in the rat. Development146(11), (2019).
- Terasaki LS , GomezJ , SchwarzJM. An examination of sex differences in the effects of early-life opiate and alcohol exposure. Philos. Trans. R. Soc. Lond. B Biol. Sci.371(1688), 20150123 (2016).
- Treit S , ChenZ , ZhouDet al. Sexual dimorphism of volume reduction but not cognitive deficit in fetal alcohol spectrum disorders: a combined diffusion tensor imaging, cortical thickness and brain volume study. Neuroimage Clin.15, 284–297 (2017).
- Converse AK , MooreCF , HoldenJEet al. Moderate-level prenatal alcohol exposure induces sex differences in dopamine d1 receptor binding in adult rhesus monkeys. Alcohol Clin. Exp. Res.38(12), 2934–2943 (2014).
- Ireland P , JolleyD , GilesGet al. Development of the Melbourne FFQ: a food frequency questionnaire for use in an Australian prospective study involving an ethnically diverse cohort. Asia Pac. J. Clin. Nutr.3(1), 19–31 (1994).
- Hodge A , PattersonAJ , BrownWJet al. The Anti Cancer Council of Victoria FFQ: relative validity of nutrient intakes compared with weighed food records in young to middle-aged women in a study of iron supplementation. Aust. N. Z. J. Public Health24(6), 576–583 (2000).
- Richardson JR , PeacockSJ , HawthorneGet al. Construction of the descriptive system for the Assessment of Quality of Life AQoL-6D utility instrument. Health Qual. Life Outcomes10, 38 (2012).
- Ollikainen M , SmithKR , JooEJet al. DNA methylation analysis of multiple tissues from newborn twins reveals both genetic and intrauterine components to variation in the human neonatal epigenome. Hum Mol Genet19(21), 4176–4188 (2010).
- Bibikova M , BarnesB , TsanCet al. High density DNA methylation array with single CpG site resolution. Genomics98(4), 288–295 (2011).
- Sandoval J , HeynH , MoranSet al. Validation of a DNA methylation microarray for 450,000 CpG sites in the human genome. Epigenetics6(6), 692–702 (2011).
- Aryee MJ , JaffeAE , Corrada-BravoHet al. Minfi: a flexible and comprehensive Bioconductor package for the analysis of Infinium DNA methylation microarrays. Bioinformatics30(10), 1363–1369 (2014).
- Ritchie ME , PhipsonB , WuDet al. limma powers differential expression analyses for RNA-sequencing and microarray studies. Nucleic Acids Res.43(7), e47 (2015).
- Phipson B , MaksimovicJ , OshlackA. missMethyl: an R package for analyzing data from Illumina’s HumanMethylation450 platform. Bioinformatics32(2), 286–288 (2016).
- Leek JT , JohnsonWE , ParkerHSet al. The sva package for removing batch effects and other unwanted variation in high-throughput experiments. Bioinformatics28(6), 882–883 (2012).
- Teschendorff AE , BreezeCE , ZhengSC , BeckS. A comparison of reference-based algorithms for correcting cell-type heterogeneity in Epigenome-Wide Association Studies. BMC Bioinformatics18(1), 105 (2017).
- Wu Z , AryeeMJ. Subset quantile normalization using negative control features. J. Comput. Biol.17(10), 1385–1395 (2010).
- Johnson WE , LiC , RabinovicA. Adjusting batch effects in microarray expression data using empirical Bayes methods. Biostatistics8(1), 118–127 (2007).
- Zheng SC , WebsterAP , DongDet al. A novel cell-type deconvolution algorithm reveals substantial contamination by immune cells in saliva, buccal and cervix. Epigenomics10(7), 925–940 (2018).
- Saffari A , SilverMJ , ZavattariPet al. Estimation of a significance threshold for epigenome-wide association studies. Genet. Epidemiol.42(1), 20–33 (2018).
- Dempster EL , PidsleyR , SchalkwykLCet al. Disease-associated epigenetic changes in monozygotic twins discordant for schizophrenia and bipolar disorder. Hum Mol Genet20(24), 4786–4796 (2011).
- Wong CC , MeaburnEL , RonaldAet al. Methylomic analysis of monozygotic twins discordant for autism spectrum disorder and related behavioural traits. Mol. Psychiatry19(4), 495–503 (2014).
- Wong CC , ParsonsMJ , LesterKJet al. Epigenome-wide DNA methylation analysis of monozygotic twins discordant for diurnal preference. Twin Res. Hum. Genet.18(6), 662–669 (2015).
- Kushwaha G , DozmorovM , WrenJDet al. Hypomethylation coordinates antagonistically with hypermethylation in cancer development: a case of study of leukemia. Human Genomics10 (2016).
- Luján S , CaroppoE , NiederbergerCet al. Sperm DNA methylation epimutation biomarkers for male infertility and FSH therapeutic responsiveness. Sci. Rep.9(1), 16786 (2019).
- Peters TJ , BuckleyMJ , StathamALet al. De novo identification of differentially methylated regions in the human genome. Epigenetics Chromatin8, 6 (2015).
- Satterthwaite FE . An approximate distribution of estimates of variance components. Biometrics2(6), 110–114 (1946).
- Benjamini Y , HochbergY. Controlling the false discovery rate: a practical and powerful approach to multiple testing. J. Royal Stat. Soc. Series B (Methodol.)57(1), 289–300 (1995).
- Yadav DK , ShresthaS , LillycropKAet al. Vitamin B12 supplementation influences methylation of genes associated with Type 2 diabetes and its intermediate traits. Epigenomics10(1), 71–90 (2018).
- Wijchers PJ , FestensteinRJ. Epigenetic regulation of autosomal gene expression by sex chromosomes. Trends Genet.27(4), 132–140 (2011).
- Hartman RJG , HuismanSE , den RuijterHM. Sex differences in cardiovascular epigenetics – a systematic review. Biol. Sex Differ.9(19), (2018).
- Breton CV , MarsitCJ , FaustmanEet al. Small-magnitude effect sizes in epigenetic end points are important in children’s environmental health studies: the Children’s Environmental Health and Disease Prevention Research Center’s Epigenetics Working Group. Environ. Health Perspect.125(4), 511–526 (2017).
- Lussier AA . Epigenetic signatures of prenatal alcohol exposure[PhD thesis]. University British Columbia, BC, Canada. (2017).
- Ziats MN , RennertOM. Aberrant expression of long noncoding RNAs in autistic brain. J. Mol. Neurosci.49(3), 589–593 (2013).
- Maltby VE , LeaRA , SandersKAet al. Differential methylation at MHC in CD4(+) T cells is associated with multiple sclerosis independently of HLA-DRB1. Clin. Epigenetics9, 71 (2017).
- Su Q , CaiQ , GerwinC , SmithCL , ShengZH. Syntabulin is a microtubule-associated protein implicated in syntaxin transport in neurons. Nat. Cell. Biol.6(10), 941–953 (2004).
- Cai Q , GerwinC , ShengZH. Syntabulin-mediated anterograde transport of mitochondria along neuronal processes. J. Cell. Biol.170(6), 959–969 (2005).
- Cai Q , PanPY , ShengZH. Syntabulin-kinesin-1 family member 5B-mediated axonal transport contributes to activity-dependent presynaptic assembly. J. Neurosci.27(27), 7284–7296 (2007).
- Funakoshi E , HamanoA , FukuiMet al. Molecular cloning of the m-Golsyn gene and its expression in the mouse brain. Gene Expr.13(1), 27–40 (2006).
- Yue F , ChengY , BreschiAet al. A comparative encyclopedia of DNA elements in the mouse genome. Nature515(7527), 355–364 (2014).
- Xiong GJ , ChengXT , SunTet al. Defects in syntabulin-mediated synaptic cargo transport associate with autism-like synaptic dysfunction and social behavioral traits. Mol Psychiatry26, 1472–1490 (2020).
- Bereczki E , BrancaRM , FrancisPTet al. Synaptic markers of cognitive decline in neurodegenerative diseases: a proteomic approach. Brain141(2), 582–595 (2018).
- Richmond RC , SimpkinAJ , WoodwardGet al. Prenatal exposure to maternal smoking and offspring DNA methylation across the lifecourse: findings from the Avon Longitudinal Study of Parents and Children (ALSPAC). Hum Mol Genet24(8), 2201–2217 (2015).
- Joubert BR , HabergSE , NilsenRMet al. 450K epigenome-wide scan identifies differential DNA methylation in newborns related to maternal smoking during pregnancy. Environ. Health Perspect.120(10), 1425–1431 (2012).
- Muggli E , CookB , O’LearyCet al. Increasing accurate self-report in surveys of pregnancy alcohol use. Midwifery31(3), e23–28 (2015).
- Mohandas N , Bass-StringerS , MaksimovicJet al. Epigenome-wide analysis in newborn blood spots from monozygotic twins discordant for cerebral palsy reveals consistent regional differences in DNA methylation. Clin. Epigenetics10, 25 (2018).
- Mohandas N , LokeYJ , HopkinsSet al. Evidence for type-specific DNA methylation patterns in epilepsy: a discordant monozygotic twin approach. Epigenomics11(8), 951–968 (2019).
- Martino D , LokeYJ , GordonLet al. Longitudinal, genome-scale analysis of DNA methylation in twins from birth to 18 months of age reveals rapid epigenetic change in early life and pair-specific effects of discordance. Genome Biol.14(5), R42 (2013).