
Abstract
Aims: In this methylome-wide association study of cholestatic liver diseases (primary sclerosing cholangitis and primary biliary cholangitis), the authors aimed to elucidate changes in methylome and pathway enrichment to identify candidate genes. Patients & methods: Reduced representation bisulfite sequencing was performed on liver tissue from 58 patients with primary sclerosing cholangitis (n = 13), primary biliary cholangitis (n = 20), alcoholic liver disease (n = 21) and live liver donors (n = 4). Pathway enrichment and network analysis were used to explore key genes/pathways. Results: Both cholestatic liver diseases were characterized by global hypomethylation, with pathway enrichment demonstrating distinct genes and pathways associated with the methylome. Conclusions: This novel study demonstrated that differential methylation in cholestatic liver disease was associated with unique pathways, suggesting it may drive disease pathogenesis.
Plain language summary
While DNA is the permanent code that defines each living being, the epigenome comprises sequences attached to DNA that can change with the environment. This means that abnormal changes to the epigenome may lead to disease and that finding and treating these abnormalities may in turn help treat disease. In this study of liver tissue from individuals with two rare liver diseases, primary sclerosing cholangitis and primary biliary cholangitis, the authors found that the epigenome of these two conditions is distinct, suggesting that the epigenome is linked to the development of these conditions and may be the key to treating them.
Tweetable abstract
Novel study in rare cholestatic liver diseases (primary sclerosing cholangitis and primary biliary cholangitis) shows unique methylome changes, which may lead to novel treatment opportunities.
There is increasing evidence that alterations in DNA methylation (i.e., the methylome) are associated with human disease, ranging from cancer to autoimmune disease to cardiovascular pathology [Citation1–3]. In the mammalian genome, methylation of cytosines in CpGs plays a critical role in transcriptional regulation, chromatin stability and gene silencing [Citation4]. Of the 28 million CpG dinucleotides in the human genome, 60–80% are methylated, many of which are concentrated in ∼1 kb CpG-rich regions called CpG islands (CGIs) [Citation5]. Notably, approximately 70% of promoters are located in CGIs, reflecting the critical role of CGIs in transcriptional regulation [Citation6]. Another key feature of the methylome is that it is modifiable; thus, it may not only play a role in disease pathogenesis but also provide the means to novel therapies [Citation2].
Primary sclerosing cholangitis (PSC) and primary biliary cholangitis (PBC) are immune-mediated, cholestatic liver diseases of unknown etiology and uncertain pathogenesis. To date, there has been a limited, targeted evaluation of DNA methylation in both PSC and PBC [Citation7]. In PSC, interest in differentially methylated DNA has largely been confined to its use as a biomarker for cholangiocarcinoma (bile duct cancer). This has demonstrated that bile from PSC patients with cholangiocarcinoma features promoter methylation of INK4a/ARF [Citation8], as well as frequent methylation of CDO1, CNRIP1, SEPT9 and VIM [Citation9]. DNA methylation may also help risk stratify patients with PSC, as advanced epigenetic age has been shown to be a predictor of clinical outcomes such as compensated or decompensated cirrhosis, death, transplant and cholangiocarcinoma regardless of chronological age [Citation10]. Studies of DNA methylation in PBC have predominantly focused on peripheral blood mononuclear cells (PBMCs) and/or the X chromosome. These studies have demonstrated relative hypermethylation of CLIC2, PIN4, FUNDC2 and AE2/SLC4A2 and hypomethylation of CXCR3 and CD40L [Citation11–13].
Herein, the authors present a methylome-wide association study (MWAS) of liver tissue for PSC and PBC using reduced representation bisulfite sequencing (RRBS). They demonstrate that PSC and PBC have unique methylome profiles when compared with cirrhotic controls with non-cholestatic liver disease (alcoholic liver disease [ALD]) and healthy controls (HCs). Pathway enrichment of gene promoters and enhancers with methylome changes under each disease condition provides key insights into disease pathogenesis.
Patients & methods
Study population & design
Patients were included from the Mayo Clinic Transplant Registry, a prospective collection of blood and explanted liver tissue from patients with liver disease as well as HCs [Citation14]. Adult patients with PSC and PBC were diagnosed according to internationally accepted criteria [Citation15,Citation16]. Controls included patients with ALD (cirrhotic controls) and unmatched live liver donors (HCs). ALD was defined as the presence of advanced fibrosis and a history of alcohol consumption over 60 g per day for men and over 20 g per day for women for over 10 years [Citation17]. PSC, PBC and ALD patients were excluded if they had evidence of concomitant liver disease (e.g., non-alcoholic fatty liver, autoimmune hepatitis, viral hepatitis) or clinical features known to impact the methylome [Citation1–3]: severe infection (i.e., sepsis, abscess, acute cholangitis), significant comorbid illness (i.e., diabetes mellitus, renal failure, chronic lung disease, chronic cardiac disease) or malignancy as per clinical history and/or liver biopsy. Histologic reasons for exclusion included the presence of severe hemosiderosis, portal vein thrombus, the absence of portal tracts and/or significant steatosis (>15%) [Citation18,Citation19]. Patients were also excluded if they had insufficient liver tissue available for RRBS. Normal controls were patients who were live liver donors for recipients with any liver disease. These individuals were 21–55 years of age, with a BMI <30 kg/m2 and no evidence of liver disease, as required by the Mayo Clinic Live Donor Transplant Program [Citation14].
Clinical and laboratory data, including sex, age at diagnosis and transplant, year of transplant, Model for End-stage Liver Disease (MELD) score at time of transplant, history of inflammatory bowel disease (IBD) or colectomy and biochemistry (alkaline phosphatase [ALP], alanine aminotransferase [ALT], aspartate aminotransferase [AST], bilirubin, albumin, creatinine, platelets and anti-mitochondrial antibody [AMA] status history if relevant), were abstracted from the medical record and reviewed for accuracy by a qualified physician (AC Cheung).
Liver tissue specimens
Liver tissue specimens were obtained at the time of liver explant as per Tissue Registry protocols (patients with liver disease) or segmentectomy according to a prospective research protocol (live donors). Slides from available formalin-fixed paraffin-embedded (FFPE) liver from PSC, PBC, ALD and live donors were re-reviewed by an expert liver pathologist (TT Wu). Samples were evaluated for the proportion of hepatocytes and portal tracts, degree of hepatic steatosis, portal/lobular inflammation, bile ductular proliferation, cholestasis, Mallory bodies and fibrosis stage [Citation20].
RRBS library preparation & sequencing
RRBS libraries were prepared using 500 ng of genomic DNA as previously described [Citation21]. The concentration and size distribution of the completed libraries were evaluated using an Agilent Bioanalyzer DNA 1000 chip (CA, USA) and Qubit fluorometry (Invitrogen, CA, USA). Once the completed libraries were pooled, 10% commercially prepared PhiX library (Illumina, CA, USA) was added to increase base diversity for improved sequencing quality. Samples were then sequenced at six samples per lane to generate 100 million 51 basepair (bp) paired-end reads following Illumina’s standard protocol using the Illumina cBot and HiSeq 3000/4000 Paired-end (PE) Cluster Kit and collection software (HiSeq Control Software v3.3.52). Base-calling was performed using Illumina’s Real-Time Analysis software version 2.7.3.
RRBS data pre-processing & quality assessment
The raw sequence FASTQ data were processed using the authors’ internal bisulfite sequence analytical pipeline, SAAP-RRBS (with alignment to human reference genome version 19, to obtain counts of methylated and unmethylated cytosine and methylation ratios on CpG sites [Citation22]. Briefly, FASTQ files were trimmed to remove adaptor sequences, and any reads with less than 15 bp were discarded. Trimmed FASTQs were then aligned against the reference genome using BSMAP (a whole genome bisulfite sequence mapping program) [Citation23]. CpG methylation and bisulfite conversion ratios were determined using Samtools and custom PERL scripts [Citation24]. A minimum coverage of five reads was required for inclusion of a cytosine in a sample. All samples were merged and samples with sample CpG call rate <80% were dropped and then CpGs across the remaining sample with a call rate <80% were excluded. Chromosomes X and Y were excluded to eliminate confounding of results by sex, given the known differences in sex distribution of patients with PSC, PBC and ALD. Unsupervised hierarchical clustering and principle components analysis (PCA) were performed to examine the sample relationship by overall methylation patterns of CpGs using complete data in all samples.
Statistical analysis for patient & histologic characteristics
Continuous values were summarized using the median and interquartile range (IQR) and comparisons between PSC, PBC and ALD were made using the Kruskal–Wallis test. Categorical values were reported as percentages, with comparisons of group differences between PSC, PBC and ALD estimated using a chi-square test. A p-value of <0.05 was considered significant. The sodium MELD (Na-MELD) score was calculated using published methods [Citation25]. This score determines the degree of liver dysfunction at the time of transplant. Key liver parameters were collected within a month of transplant: ALP (normally the primary derangement in PSC and PBC), ALT (a key liver enzyme in PSC, PBC, ALD and controls) and bilirubin (a measure of liver function). Histologic characteristics were also compared between PSC, PBC and ALD. This included assessment of the proportion of hepatocytes (liver cells), portal fibrosis (scarring of portal tracts) and steatosis (fat) in each representative slide from each patient. These were recorded as percentages. The degree of fibrosis and inflammation was also noted, with fibrosis noted according to standardized criteria [Citation26]. Statistical analysis for patient characteristics and differential methylation was performed using R (R Core Team, Vienna, Austria, version 3.4.1).
Statistical analysis for differential methylation between patients & controls
Differentially methylated CpG loci (DML) were identified using a beta-binomial model that takes into account read coverage and biological variation across samples (R dispersion shrinkage for sequencing data [DSS] package 2.26) and were defined as loci with an absolute methylation difference of >10% and p < 0.01 [Citation27]. As nearby CpGs often change in coordinated fashion, the authors used differentially methylated regions (DMRs) for the main analysis and further interpretation. DMRs were derived from the DML analysis and required a region to have at least four CpG sites (DML with methylation difference >5% and p < 0.05), a minimum of 50 bases long, with adjacent CpGs < 100 bases apart and with a regional absolute methylation difference >5% after pulling in other non-significant CpGs in the DMR. The analysis also accounted for the direction of CpG differences, as well as the percentage of significant DML in the DMR. Methylation comparisons were performed by subtracting the average methylation of controls from that of the disease groups.
Differentially methylated genes (DMGs) were defined using DMRs ±1.5 kb of transcription start sites (TSSs), as determined by Ensembl gene annotation (v75). Differentially methylated enhancer regions were identified, and the genes they are known to regulate (enhancer-associated genes [EAGs]) were defined using FANTOM5 (http://fantom.gsc.riken.jp/5/) [Citation28]. Candidate genes identified by these two approaches were then pooled for the purposes of pathway enrichment (Ingenuity Pathway Analysis [IPA], QIAGEN, Hilden, Germany) [Citation29]. Functional enrichment analysis was also performed using g:Profiler [Citation30].
Pathway enrichment & network analysis
Pathway enrichment with comparative analysis was performed using IPA. Additional pathway enrichment was performed using g:Profiler, and these results were used for network analysis (Cytoscape, ClueGo). Potential candidate genes involved in the following key disease states were established using publicly available curated databases: genes involved in PSC, PBC, fibrosis, epigenetic regulation, tumor suppressor genes and cancer-germline genes (Library of Molecular Associations [LOMA]), senescence (Cell Senescence Gene Database [CSGene]), immune regulation (ImmPort), tumor suppressor genes (TSGene), Catalogue of Somatic Mutations in Cancer (COSMIC) [Citation31–34].
Results
Patients & samples
Following the clinical exclusion criteria, there were 81 eligible individuals who underwent liver transplant or were living donors for liver transplant, from whom 306 FFPE slides were reviewed. Of these, there were a total of 60 individuals with available FFPE liver tissue blocks that did not meet any exclusion criteria (PSC, n = 14; PBC, n = 20; ALD, n = 21; HCs, n = 5). Following RRBS of these FFPE samples, a single HC sample failed the library preparation and one PSC sample was excluded, as the sample call rate was below 80%. The clinical and histologic characteristics of the final 58 included patients are provided in Supplementary Tables 1 & 2.
RRBS data & global methylation patterns
A mean of 88 million paired-end reads were generated for each sample with an average mapping rate of 62% (44–82%). The bisulfite conversion rate exceeded 98% in all samples and an average of 3.9 million CpG sites per sample were sequenced at a depth of 5X or greater, the minimum cutoff for study inclusion (Supplementary Figure 1). After removing CpGs on X and Y chromosomes and those with less than 5X coverage in at least 80% of the samples, there were 2,270,877 CpGs available for final analyses. As expected for the RRBS platform, CpGs were predominantly CGIs located in the intergenic, promoter and intronic regions (Supplementary Figure 2A & B).
The cytosine residues at the majority of CpG sites were either unmethylated or minimally methylated, consistent with expectations. On unsupervised clustering, HC samples were mostly in a distinct cluster; most PSC and PBC samples grouped in close proximity (A). PCA showed some separation of samples based on disease (B). Approximately 20–40% of DML and 20–44% of DMRs were unique to PSC, PBC and ALD (C & D). In total, there were 18,498, 17,509 and 23,455 DML identified for PSC, PBC and ALD, respectively, and 1432, 1374 and 1905 DMRs, respectively ().
(A) Unsupervised hierarchical clustering. Hierarchical clustering of CpGs from PSC, PBC, ALD and HC samples demonstrates that PSC and PBC samples formed relative clusters, while ALD and HCs formed more distinct clusters. (B) Principle component analysis. A clustering plot of CpGs from PSC, PBC and ALD demonstrated that PSC, PBC and ALD samples demonstrated some clustering. (C) Venn diagram of DML. DML were defined as using an absolute methylation difference of >10% and p < 0.01. (D) Venn diagram of Differentially methylated regions (DMRs). DMRs were defined as regions ≥4 CpGs with CpGs ≤100 bases apart, with p < 0.05 and regional methylation difference >5%. PSC, PBC and ALD were compared with HCs to define DMRs for each disease. This demonstrated that there are unique and common DMRs associated with PSC, PBC and ALD when compared with HCs. Note that discrepancies in the total number of DMRs in and this (D) are a consequence of genomic ranges with multiple overlaps.
ALD: Alcoholic liver disease; DML: Differentially methylated loci; HC: Healthy control; PBC: Primary biliary cholangitis; PSC: Primary sclerosing cholangitis; TSS: Transcription start site.
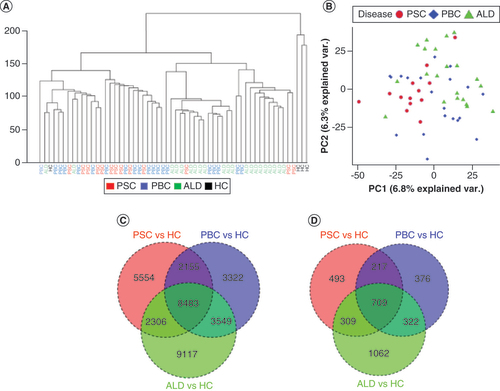
Table 1. Number and proportions of total, hypomethylated and hypermethylated differentially methylated loci and differentially methylated regions in primary sclerosing cholangitis, primary biliary cholangitis and alcoholic liver disease.Table Footnote†
Comparing liver diseases to HCs
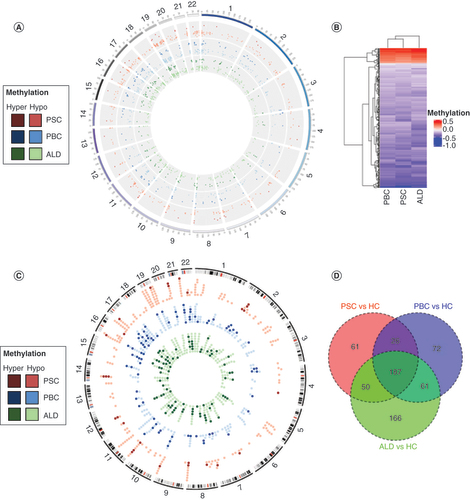
DMGs were predominantly hypomethylated in PSC (90%), compared with PBC (71%) and ALD (73%), with hypomethylation distributed globally (A & B). Candidate genes derived from differentially methylated promoters annotated to 324, 346 and 464 Ensembl genes for PSC, PBC and ALD, respectively; approximately 20% of genes were unique to PSC and PBC, and 36% unique to ALD (C & D). For all three diseases, approximately 60% were protein coding, while the remainder were largely lincRNA and antisense transcripts (Supplementary Figure 3).
(A) Differentially methylated region (DMR) distribution across the genome. Hypermethylated DMRs are represented by darker colors and hypomethylated DMRs are represented by lighter colors. Each disease is represented by the following colors: PSC in red, PBC in blue and ALD in green. (B) Heat map of DMRs. PSC and PBC were demonstrated to be more similar than ALD using a heat map with hierarchical clustering. Red bars demonstrate hypermethylation and blue bars hypomethylation. (C) Circos plot of differentially methylated genes (DMGs). The majority of DMGs were hypomethylated (light colors), and relatively few were hypermethylated (dark colors). There was no clear distribution across the genome. (D) Venn diagram of DMGs.
ALD: Alcoholic liver disease; HCs: Healthy controls; PBC: Primary biliary cholangitis; PSC: Primary sclerosing cholangitis.
Comparative pathway enrichment (IPA) demonstrated common and unique enriched canonical pathways in PSC and PBC (A). Both PSC and PBC were enriched in Th1 and Th2 activation pathways, with a predominance of Th2. Neither demonstrated enrichment of 3-phosphoinositide biosynthesis, unlike ALD. Meanwhile, PSC alone was enriched in macrophage signaling and PBC was uniquely enriched in stem cell differentiation. PSC was uniquely enriched in signal transduction and cellular response to stimulus, while PBC was uniquely enriched in inflammatory response and cell surface receptor signaling pathway (B). The common theme related to DMGs from all three diseases was the enrichment of multiple immune-related pathways, some of which were shared (A). To further investigate commonalities and differences at a gene level, the authors extracted pathways with enrichment in at least one disease (Supplementary File 1). This demonstrates that all three diseases are associated with virtually identical genes in Th1 and Th2 pathways, but only PSC and PBC involve differential methylation in IL2RA, whereas ALD involved NFATCC4 and NFATC1. While both CXCR4 and CXCR5 signaling pathways were enriched in PSC, PBC involved only CXCR5, and neither pathway was enriched in ALD. Moreover, there was strong involvement of pathways involving leukocyte extravasation and macrophages, fibroblasts and endothelial cells in both PBC and PSC, but not ALD. Notably, PSC but not PBC was enriched in IL-17 and IL-22 pathways. Due to the discrete number of hypermethylated promoters, the authors sought to determine the function of these candidate genes. Pathway enrichment showed that these were largely associated with transcription factors among all three diseases, with specific associations with retinol metabolism (PSC) and 22q11.2 deletion syndrome (PBC).
(A) Comparative analysis of canonical pathway enrichment of DMGs. Comparative analysis (Ingenuity Pathway Analysis) was used to identify canonical pathways and their associations with each disease. PSC and PBC were strongly associated with pathways involved in Th2 >Th1 signaling. PSC was also enriched in pathways involved in lymphocyte and macrophage signaling. By contrast, ALD was significantly enriched for Th1 signaling and inositol phosphate metabolism. (B) Pathway enrichment analysis (g:Profiler) demonstrating pathways uniquely and commonly enriched in PSC and PBC. Bubble size represents proportion of candidate genes in PSC and PBC in each pathway, compared with total number of candidate genes. (C) Overlap between differentially methylated genes (DMGs) and known genes involved in fibrosis, senescence, PSC and PBC. Each band in the circular form represents a chromosome with an associated gene. (D) Overlap between DMGs and known genes involved in immune response. Each band in the circular form represents a chromosome with an associated gene.
ALD: Alcoholic liver disease; FIB: Fibrosis; IPA: Ingenuity Pathway Analysis; PBC: Primary biliary cholangitis; PSC: Primary sclerosing cholangitis, SEN: Senescence.
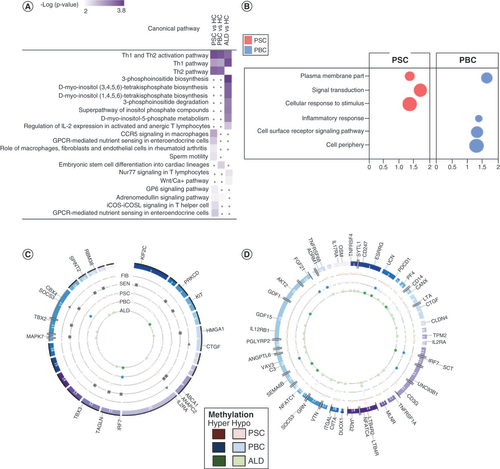
As the majority of PSC, PBC and ALD patients in this study had cirrhosis, and all diseases were highly enriched in immune signaling, the authors sought to determine if PSC, PBC and ALD shared genes specifically involved in fibrosis or senescence or whether these genes had previously been associated with PSC and PBC (C) or immune response (D). This demonstrated that while all three diseases shared numerous genes involved in immune signaling, the same could not be said of genes associated with fibrosis and senescence. Notably, of the genes that have been associated with PSC and PBC in genome-wide association studies (GWAS), only CD247 and C3 were found to be differentially methylated. To determine if promoter methylation for the DMGs enriched in the immune-related pathways clustered in specific diseases, the authors also created a heat map (Supplementary Figure 4). This showed that the vast majority of these genes had reduced methylation in the diseased samples (relative to the normal controls). While differential methylation in PBC, PSC and ALD was variable from patient to patient, patients with ALD did appear to cluster together, while PBC and PSC patients both clustered among each other, suggesting the presence of common immune-related genes.
Comparing the liver diseases with each other
The authors also compared differential methylation across all three diseases directly (A). Compared with ALD, DMRs in PBC were relatively hypermethylated, while DMRs in PSC were relatively hypomethylated. Interestingly, when compared with PBC, DMRs in PSC were almost all hypomethylated.
(A) Paired comparisons of differential methylation (differentially methylated regions). PSC demonstrated the greatest relative hypomethylation. Green, hypomethylation; red, hypermethylation. (B) Comparative pathway enrichment between diseases. This demonstrated that PSC and primary biliary cholangitis share similar pathways but that PSC is enriched in a number of distinct pathways.
ALD: Alcoholic liver disease; PBC: Primary biliary cholangitis; PSC: Primary sclerosing cholangitis.
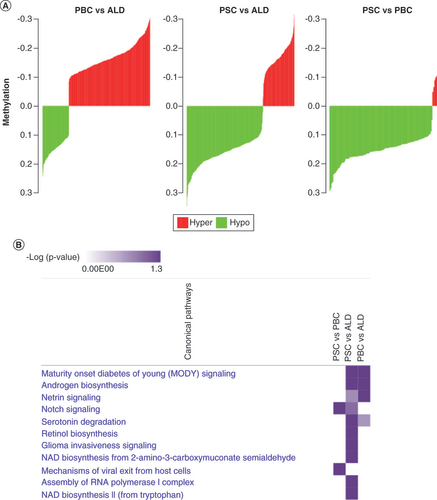
When compared with ALD, similar pathways were enriched in PBC and PSC DMGs, although PSC had more enriched pathways (B). This suggests that while differential methylation is associated with similar pathways in PSC and PBC, there are also distinct pathways enriched only in PSC. When comparing PSC and PBC, only two pathways (notch signaling, mechanisms of viral exit) were enriched. All these genes had reduced methylation in PSC, suggesting that these genes and pathways are more active in PSC.
Network analysis
Network analysis of pathways derived from DMGs demonstrated unique features for each disease (Supplementary Figure 5A–C). PSC involved networks related to immune response, signal transduction, cellular response to stress, response to stimulus and cell population proliferation. PBC networks were similarly involved with immune response, cellular response to stress and response to stimulus, but also metabolic processes and extracellular and intracellular components (i.e., vesicles, intracellular organelles, non-membrane-bound organelles). ALD networks shared many similarities with PBC.
Expanded gene annotation using differentially methylated Fantom5 enhancers & pathway enrichment analysis
The overlaps between DMRs and Fantom5 enhancers are listed in . Like DMGs, enhancers were globally distributed (A). The majority of enhancers were hypomethylated, with nearly 100% of enhancers hypomethylated in PSC (all but one), as well as 93% and 96% hypomethylated in PBC and ALD, respectively. Approximately 50% of genes were common among the three diseases, with 66% common between any disease pair (B). A number of DMGs and EAGs involved in epigenetic control were shown to be differentially methylated, with several uniquely hypomethylated in PSC and one in PBC (Supplementary Table 3). TET3, critical to control of methylation, was hypomethylated in all three diseases.
Table 2. Associations between differentially methylated regions, genes and enhancers.
(A) Circos plot of enhancer-associated differentially methylated region (DMR). Virtually all enhancer-associated DMRs were hypomethylated in PSC, relative to PBC and ALD. Hypomethylated DMRs are represented by lighter colors, while hypermethylated DMRs are represented by darker colors. There was no clear distribution across the genome. (B) Venn diagram of enhancer-associated genes. (C) Comparative analysis of canonical pathway enrichment of enhancer-associated genes. Comparative analysis (Ingenuity Pathway Analysis) was used to identify canonical pathways and their associations with each disease. PSC and PBC were highly enriched in pathways involved in cancer and T cell signaling. PSC was again associated with apoptosis signaling. (D) Comparative analysis of toxicity functions. Toxicity functions analysis (Ingenuity Pathway Analysis) was used to identify associations between experimental data and pathology. PSC was associated with hepatocyte apoptosis and necrosis, while all three diseases were associated with malignancy.
ALD: Alcoholic liver disease; DMG: Differentially methylated gene; HC: Healthy control; IPA: Ingenuity Pathway Analysis; PBC: Primary biliary cholangitis; PSC: Primary sclerosing cholangitis; Tox: Toxicity functions.
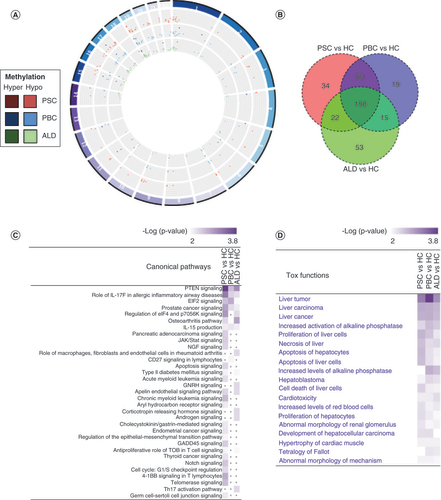
IPA analysis showed tumor/cell proliferation pathways were significantly enriched in all three conditions; however, each disease was also enriched for specific pathways; PSC was enriched for pathways involving cancer, apoptosis and telomerase signaling, while PBC was enriched in only CD27 signaling in lymphocytes (C). Toxicity functions analysis revealed significant involvement with PSC in liver-related pathological processes, such as liver carcinoma, hepatocyte apoptosis, cell death of liver cells and proliferation of hepatocytes (D). Given the enrichment bias toward malignancy, the authors sought to determine the relationship among tumor suppressor genes (TSGs), cancer-germline genes, disease and methylation status. This demonstrated that approximately 10% of enhancer-associated genes in all three diseases have been identified as TSGs; these were all hypomethylated. None of the EAGs were associated with cancer-germline genes (Supplementary Table 4).
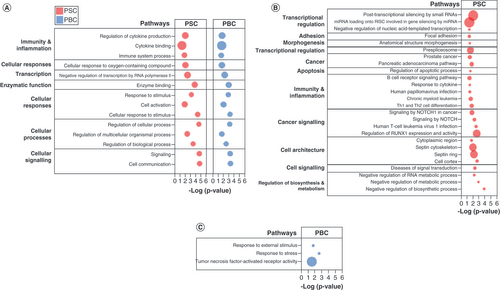
Pathway enrichment with g:Profiler showed that PSC and PBC shared numerous enriched pathways with similar gene involvement, such as pathways related to cytokine binding, immune system processes and cell communication, as well as transcriptional regulation (A). PSC was uniquely enriched with numerous pathways involving immunity and inflammation (B cell receptor signaling, leukocyte, human T cell leukemia virus 1 infection), apoptosis, cell architecture (septin cytoskeleton, cell cortex) and cancer signaling (signaling by NOTCH, regulation of RUNX1 expression and activity) (B). PBC was enriched with few distinct pathways (response to external stimulus, response to stress, tumor necrosis factor-activated receptor activity) (C). (Data is available in the form of Supplementary Files 1–4).
(A) Pathways commonly enriched in PSC and PBC. (B) Pathways uniquely enriched in PSC. (C) Pathways uniquely enriched in PBC. Pathway enrichment analysis performed using g:Profiler. Bubble size represents proportion of candidate genes in PSC and PBC in each pathway, compared with total number of genes in pathway.
DMR: Differentially methylated region; PBC: Primary biliary cholangitis; PSC: Primary sclerosing cholangitis.
Discussion
In this methylome-wide study in cholestatic liver disease, the authors have shown that liver tissues from individuals with advanced PSC and PBC have similar, but distinct, methylome signatures. Both cholestatic liver diseases are characterized by hypomethylation as compared with HCs. Relative to cirrhotic controls with ALD, PSC liver tissue appears to be more globally hypomethylated than PBC; consequently, it is characterized by a greater number of hypomethylated promoters and enhancers. Pathway enrichment and network analysis demonstrate common associations between PSC and PBC, revealing potential candidate genes involved in T cell signaling and signal transduction. PSC was uniquely enriched in pathways implicated in cancer, macrophage and apoptotic signaling and cellular cytoskeleton. Nearly all the candidate genes identified in this study have not been associated with PSC or PBC.
Global hypomethylation is a remarkably consistent finding across a range of pathological states [Citation35,Citation36]. Diverse autoimmune conditions such as systemic lupus erythematosus (SLE), rheumatoid arthritis (RA) and systemic sclerosis are characterized by hypomethylation of PBMCs, particularly CD4+ T cells [Citation37–39]. The current findings indicate that overrepresentation of global hypomethylation is more significant in PSC than PBC or ALD. In PSC, pathway enrichment of DMGs and EAGs was associated with a number of putative pathways involved in immune signaling and cancer. By contrast, PBC pathway enrichment demonstrated relatively few unique pathways. This suggests that both aberrant promoter and enhancer hypomethylation may be a key driver of uniquely aberrant immune responses and malignant risk in PSC.
Like chronic disease, the majority of cancers demonstrate global hypomethylation, with discrete areas of hypermethylation often involving TSGs, which leads to gene silencing and subsequent malignant transformation [Citation36]. Hypomethylation, on the other hand, is frequently associated with genomic instability and activation of germline genes, which can enhance tumor progression [Citation40,Citation41]. Promoter hypermethylation of TSGs such as p16 has been shown to be fairly common in PSC-associated cholangiocarcinoma [Citation42]. In the current study, the authors demonstrate that in the absence of malignant transformation, livers from patients with PSC and PBC are not typically characterized by aberrant methylation of TSGs or cancer-germline genes. It remains to be seen whether altered methylation is a harbinger of possible liver or bile duct cancer in this population.
The mechanisms that underlie global hypomethylation and focal hypermethylation are unclear. This study did find that TET3 hypomethylation was consistent across PSC, PBC and ALD, while a number of genes related to epigenetic control were differentially methylated in PSC and/or PBC. In PSC, it has been shown that hepatic DNA methyltransferases (DNMTs) are upregulated, particularly DNMT3b, while TET2 and TET3 protein expression is severely repressed [Citation43]. Interestingly, TET1 and TET3 have been shown to be hypomethylated in patients exposed to air pollution and aflatoxin β1, which in turn may alter gene expression, suggesting a link with environmental exposures and TET enzyme dysfunction [Citation44,Citation45]. Together, these findings suggest that aberrant methylation patterns in cholestatic liver disease may be secondary to impaired expression of DNMTs and TET.
Known treatments for autoimmune disease and malignancy have been associated with changes in methylation; thus, inhibitors of methylation are being explored for their potential therapeutic benefit. In experimental animal models of SLE, DNMT inhibitors can induce autoreactivity and a lupus-like syndrome, while treatment of RA with methotrexate can reverse hypomethylation of PBMCs [Citation41–43]. It is currently unknown whether treatment with ursodeoxycholic acid or obeticholic acid may mediate DNA methylation. Intriguing evidence in mouse models demonstrates that paternal dietary cholic acid exposure can modify DNA methylation in germ cells as well as the liver, suggesting that changes in bile acid profiles may lead to epigenetic modification [Citation46]. Thus, not only may changes in differential methylation increase predisposition to cholestatic liver disease, but there may be a feed forward mechanism whereby these diseases can lead to aberrant bile acid production, which in turn exacerbates changes in the methylome.
Pathway enrichment of candidate genes for PSC demonstrate several interesting associations. The apoptosis pathway was highly enriched in PSC DMGs and EAGs. A recent study from the authors’ group has demonstrated that mice deficient in TRAIL and its receptor are resistant to developing a sclerosing cholangitis phenotype, suggesting that apoptosis may be a key pathogenic mechanism [Citation47]. Pathways involved in the septin cytoskeleton and the cell cortex were also enriched in PSC. These pathways share links to cilia development, highlighting a possible role for differential methylation in aberrant ciliary function. As there is evidence that PSC is a cholangiociliopathy, with PSC cholangiocytes characterized by abnormally elongated cilia, abnormal methylation may be a key feature in this physiologic disruption [Citation48].
In PBC, EAGs demonstrated pathway enrichment in TNF-activated receptor activity, with differential methylation involving enhancers for TNFRSF4, TNFSF1A, TNFRSF14 and TNFRSF1B. These genes are involved in the regulation of T cell immune responses, including CD4+ T cell responses, as well as T cell-dependent B cell proliferation and differentiation. Furthermore, TNFSF1A and TNFRSF4 are involved in the regulation of TNF-α and NF-κB, respectively, both of which have been associated with PBC pathogenesis. Increasing levels of TNF-α have been associated with disease stage, while reduced levels have been associated with ursodeoxycholic acid treatment [Citation49]. Meanwhile, NF-κB has been implicated in CD40-induced apoptosis of biliary epithelial cells via Fas/Fas-ligand (FasL) in PBC [Citation50]. TNFRSF1B has also been associated with mediating apoptosis through recruitment of anti-apoptotic proteins, c-IAP1 and c-IAP2, both of which have been found to be relatively downregulated in PBC as compared with PSC [Citation51]. Differential methylation of enhancers demonstrated far greater unique pathway enrichment as compared with promoters and involved pathways associated with malignancy and cell-specific disruptions to hepatocytes. This suggests that these enhancers may have been derived from hepatocytes and might be implicated in tissue- and disease-specific changes.
Comparison between the different liver diseases demonstrated numerous differences. PSC demonstrated the greatest DMR hypomethylation, followed by PBC and then ALD. Pathway enrichment comparing the different liver diseases with each other showed that all three diseases were associated with virtually identical genes in Th1 and Th2 pathways, but PSC and PBC involved differential methylation in IL2RA. GWAS have implicated IL2RA gene polymorphisms in PSC, which in turn have been associated with a reduction in regulatory T cells in PSC, possibly implicating specific immune dysregulation in PSC pathogenesis [Citation52,Citation53]. There is likewise evidence that a reduction in regulatory T cells may induce susceptibility to PBC in patients and their first-degree relatives, while an IL2RA-/- mouse model has been developed that mimics many of the pathological characteristics of PBC [Citation54]. Both CXCR4 and CXCR5 signaling pathways were enriched in PSC, while only CXCR5 was enriched in PBC; CXCR4 is expressed by lymphocytes that infiltrate the liver in inflammatory liver diseases and its ligand, stromal cell-derived factor-1 (SDF-1), has been shown to be highly expressed in biliary epithelial cells in various liver diseases [Citation55]. By contrast, CXCR5 is expressed on follicular helper T cells and altered levels of these cells have been implicated in PSC and PBC [Citation56]. There were also a number of distinct pathways enriched only in PSC, including IL-17 and IL-22 pathways. It has recently been shown that biliary T cells from individuals with PSC display a CD103+ CD69+ effector memory phenotype that secretes both IL-17 and IL-22 [Citation57]. Taken together, the authors’ findings suggest that epigenetic modifications may be partly driving the altered immune landscape in PSC and PBC and could be potential targets for these orphan diseases, particularly PSC, for which there is currently no effective treatment.
The small sample sizes in the current study reflect the difficulty of selecting relatively homogenous samples in patients with advanced liver disease. The authors sought to eliminate environmental factors known to alter the DNA methylation landscape, including factors such as infection, renal failure and malignancy [Citation1–3]. However, despite the small sample size, both end-stage PSC and PBC displayed unique methylation profiles, suggesting that there are disease-specific methylation changes associated with each disease despite the prevailing environment of cholestasis. In order to confirm the results, a replication cohort and integration with additional omics data would be ideal; however, there are numerous practical challenges due to the relative rarity of PSC and PBC, the relatively heterogenous population and the lack of fresh tissue from which to obtain robust complementary data such as transcriptomics. Another limitation of this study is that RRBS is unable to distinguish 5-methylcysteine (5mC) from the downstream metabolite of demethylation, 5-hydroxymethylcytosine (5hmC). Whereas 5mC is generally linked to gene repression at promoter sites, and cell- and tissue-specific expression at other genomic sites, 5hmC is associated with active enhancers and gene expression outside the promoter region [Citation58]. However, recent data suggest that gene expression generally correlates regardless of whether 5mC or 5hmC is present [Citation58].
Important future directions would include the prospective collection of concurrent liver and blood at different disease stages to aid with validation and the potential development of non-invasive biomarkers for diagnosis or staging. Differentiation of 5hmC and 5mC with newer methods of genome-wide methylation analysis would also help to further validate RBBS findings. Finally, there is evidence that single nucleotide polymorphisms may impact DNA methylation (methylation quantitative trait loci); thus, paired genomic and epigenomic studies may provide additional insights into the functional consequences of previously performed GWAS [Citation59].
Conclusion
In this methylome-wide study in cholestatic liver disease, we demonstrated that PSC and PBC have disease-specific profiles, even in the setting of advanced liver disease. These differential methylation profiles may provide insights into disease pathogenesis. Pathway enrichment analysis suggests that aberrant promoter and, in particular, enhancer methylation may provide a key step in the dysregulation of cell survival/apoptotic signaling and TSGs in PSC and disrupted immune signaling in both cholestatic liver diseases. Future studies will be needed to help differentiate hepatocyte- and cholangiocyte-specific epigenetic changes from other relevant cell types in the liver, such as PBMCs and hepatic stellate cells. By including patients with different stages of cholestatic liver disease and gene expression profiles, this approach may provide critical data for the development of biomarkers for risk stratification. Further research into the epigenetics of cholestatic liver disease has the potential to elucidate pathogenic mechanisms and facilitate new therapeutic discoveries.
Future perspective
Our study suggests that the methylome plays a critical role in the development and possibly the progression of PSC and PBC. We posit that environmental factors are integral to altering the methylome and that identification of these risk factors will be key to disease prevention and treatment. Further, novel therapies targeting the methylome may prove invaluable in the treatment of cholestatic liver disease.
This is a novel, methylome-wide association study performed using liver tissue from individuals with primary sclerosing cholangitis (PSC) and primary biliary cholangitis (PBC).
Cholestatic liver disease is characterized by global hypomethylation, with hypomethylation most prominent in PSC.
A number of novel candidate genes were identified and have been made publicly available for future study.
In PSC, pathway enrichment of hypomethylated genes demonstrated unique associations with B cell and macrophage signaling, cancer, apoptosis and ciliary function.
This suggests that both aberrant promoter and enhancer hypomethylation may be a key driver of unique dysfunctional immune responses and malignant risk in PSC liver tissue.
By contrast, in PBC, pathway enrichment demonstrated relatively few unique pathways. These were associated with the regulation of T cell immune responses.
Alterations in the methylome point to distinct functional pathways affected in PSC and PBC.
As the methylome is likely modifiable, existing investigational therapies targeting DNA methylation may lead to novel therapeutics in cholestatic liver disease, particularly PSC, for which there is no currently approved therapy.
Author Contributions
AC Cheung was involved in the study design, data collection, pathway analysis, generation of figures and manuscript writing. BD Juran was involved in the study design and review of the manuscript. EM Schlicht was involved in data collection. BM McCauley and EJ Atkinson provided statistical support. R Moore performed the bioinformatics and aided with figure generation. JK Heimbach and KD Watt aided with data collection and prior enrollment of healthy controls. TT Wu reviewed and classified findings on all the slides. NF LaRusso and GJ Gores were involved in the study design. Z Sun provided bioinformatics support and aided in the generation of figures. All authors read and approved the final manuscript.
Ethical conduct of research
The authors state that they have obtained appropriate approval from the Mayo Clinic Institutional Review Board. In addition, for investigations involving human subjects, informed consent has been obtained from the participants involved.
Availability of data & materials
The datasets supporting the conclusions of this article are included within the article (and Supplementary Files 1–4). The raw datasets used and/or analyzed during the current study are available from the corresponding author on reasonable request.
Acknowledgments
The authors would like to acknowledge the Mayo Clinic Medical Genome Facility for their expertise in genomic processing and sequencing for RRBS.
Supplementary data
To view the supplementary data that accompany this paper please visit the journal website at: www.tandfonline.com/doi/suppl/10.2217/epi-2021-0343
Financial & competing interests disclosure
This work was supported by RC2 DK118619 (to KNL) 1RO1DK126691 (to KN Lazaridis) and Chris M. Carlos and Catharine Nicole Jockisch Carlos Endowment in PSC. The authors have no other relevant affiliations or financial involvement with any organization or entity with a financial interest in or financial conflict with the subject matter or materials discussed in the manuscript apart from those disclosed.
No writing assistance was utilized in the production of this manuscript.
Additional information
Funding
References
- Wilson AS , PowerBE , MolloyPL. DNA hypomethylation and human diseases. Biochim. Biophys. Acta1775(1), 138–162 (2007).
- Jeffries MA , SawalhaAH. Autoimmune disease in the epigenetic era: how has epigenetics changed our understanding of disease and how can we expect the field to evolve?Expert Rev. Clin. Immunol.11(1), 45–58 (2015).
- Zhong J , AghaG , BaccarelliAA. The role of DNA methylation in cardiovascular risk and disease: methodological aspects, study design, and data analysis for epidemiological studies. Circ. Res.118(1), 119–131 (2016).
- Jones PA . Functions of DNA methylation: islands, start sites, gene bodies and beyond. Nat. Rev. Genet.13(7), 484–492 (2012).
- Rivera CM , RenB. Mapping human epigenomes. Cell155(1), 39–55 (2013).
- Jones MJ , GoodmanSJ , KoborMS. DNA methylation and healthy human aging. Aging Cell14(6), 924–932 (2015).
- Cheung AC , LaRussoNF , GoresGJ , LazaridisKN. Epigenetics in the primary biliary cholangitis and primary sclerosing cholangitis. Semin. Liver Dis.37(2), 159–174 (2017).
- Klump B , HsiehCJ , DetteSet al. Promoter methylation of INK4a/ARF as detected in bile – significance for the differential diagnosis in biliary disease. Clin. Cancer Res.9(5), 1773–1778 (2003).
- Andresen K , BobergKM , VedeldHMet al. Four DNA methylation biomarkers in biliary brush samples accurately identify the presence of cholangiocarcinoma. Hepatology61(5), 1651–1659 (2015).
- Trauner M , GindinY , JiangZet al. Methylation signatures in peripheral blood are associated with marked age acceleration and disease progression in patients with primary sclerosing cholangitis. JHEP Reports2(1), 100060 (2020).
- Mitchell MM , LleoA , ZammataroLet al. Epigenetic investigation of variably X chromosome inactivated genes in monozygotic female twins discordant for primary biliary cirrhosis. Epigenetics6(1), 95–102 (2011).
- Lleo A , ZhangW , ZhaoMet al. DNA methylation profiling of the X chromosome reveals an aberrant demethylation on CXCR3 promoter in primary biliary cirrhosis. Clin. Epigenetics7(1), 61 (2015).
- Arenas F , HervíasI , SáezEet al. Promoter hypermethylation of the AE2/SLC4A2 gene in PBC. JHEP Reports1(3), 145–153 (2019).
- Darwish Murad S , FidlerJL , PoteruchaJJet al. Longterm clinical and radiological follow-up of living liver donors. Liver Transpl.22(7), 934–942 (2016).
- Lazaridis KN , LaRussoNF. Primary sclerosing cholangitis. N. Engl. J. Med.375(12), 1161–1170 (2016).
- Nguyen DL , JuranBD , LazaridisKN. Primary biliary cirrhosis. Best Pract. Res. Clin. Gastroenterol.24(5), 647–654 (2010).
- O’Shea RS , DasarathyS , McCulloughAJet al. Alcoholic liver disease. Hepatology51(1), 307–328 (2010).
- Chalasani N , WilsonL , KleinerDE , CummingsOW , BruntEM , ÜnalpA. Relationship of steatosis grade and zonal location to histological features of steatohepatitis in adult patients with non-alcoholic fatty liver disease. J. Hepatol.48(5), 829–834 (2008).
- Brunt EM , TiniakosDG. Histopathology of nonalcoholic fatty liver disease. World J. Gastroenterol.16(42), 5286–5296 (2010).
- Batts KP , LudwigJ. Chronic hepatitis: an update on terminology and reporting. Am. J. Surg. Pathol.19(12), 1409–1417 (1995).
- Gu H , SmithZD , BockC , BoyleP , GnirkeA , MeissnerA. Preparation of reduced representation bisulfite sequencing libraries for genome-scale DNA methylation profiling. Nat. Protoc.6(4), 468–481 (2011).
- Sun Z , BahetiS , MiddhaSet al. SAAP-RRBS: streamlined analysis and annotation pipeline for reduced representation bisulfite sequencing. Bioinformatics28(16), 2180–2181 (2012).
- Xi Y , LiW. BSMAP: whole genome bisulfite sequence MAPping program. BMC Bioinformatics10, 232 (2009).
- Li H , HandsakerB , WysokerAet al. The sequence alignment/map format and SAMtools. Bioinformatics25(16), 2078–2079 (2009).
- Kim WR , BigginsSW , KremersWKet al. Hyponatremia and mortality among patients on the liver-transplant waiting list. N. Engl. J. Med.359(10), 1018–1026 (2008).
- Bedossa P , PoynardT. An algorithm for the grading of activity in chronic hepatitis C. Hepatology24(2), 289–293 (1996).
- Wu H , WangC , WuZ. A new shrinkage estimator for dispersion improves differential expression detection in RNA-seq data. Biostatistics14(2), 232–243 (2013).
- Lizio M , HarshbargerJ , ShimojiHet al. Gateways to the FANTOM5 promoter level mammalian expression atlas. Genome Biol.16, 22 (2015).
- Kramer A , GreenJ , PollardJJr , TugendreichS. Causal analysis approaches in Ingenuity Pathway Analysis. Bioinformatics30(4), 523–530 (2014).
- Raudvere U , KolbergL , KuzminIet al. g:Profiler: a web server for functional enrichment analysis and conversions of gene lists (2019 update). Nucleic Acids Res.47(W1), W191–W198 (2019).
- Buchkremer S , HendelJ , KruppMet al. Library of molecular associations: curating the complex molecular basis of liver diseases. BMC Genomics11(1), 189 (2010).
- Tacutu R , ThorntonD , JohnsonEet al. Human ageing genomic resources: new and updated databases. Nucleic Acids Res.46(D1), D1083–D1090 (2018).
- Bhattacharya S , DunnP , ThomasCGet al. ImmPort, toward repurposing of open access immunological assay data for translational and clinical research. Sci. Data5, 180015 (2018).
- Bamford S , DawsonE , ForbesSet al. The COSMIC (Catalogue of Somatic Mutations in Cancer) database and website. Br. J. Cancer91(2), 355–358 (2004).
- Mazzone R , ZwergelC , ArticoMet al. The emerging role of epigenetics in human autoimmune disorders. Clin. Epigenetics11(1), 1–15 (2019).
- De Smet C , LoriotA. DNA hypomethylation in cancer: epigenetic scars of a neoplastic journey.Epigenetics5(3), 206–213 (2010).
- Coit P , YalavarthiS , OgnenovskiMet al. Epigenome profiling reveals significant DNA demethylation of interferon signature genes in lupus neutrophils. J. Autoimmun.58, 59–66 (2015).
- Richardson B , ScheinbartL , StrahlerJ , GrossL , HanashS , JohnsonM. Evidence for impaired T cell DNA methylation in systemic lupus erythematosus and rheumatoid arthritis. Arthritis Rheum.33(11), 1665–1673 (1990).
- Lei W , LuoY , YanKet al. Abnormal DNA methylation in CD4+ T cells from patients with systemic lupus erythematosus, systemic sclerosis, and dermatomyositis. Scand. J. Rheumatol.38(5), 369–374 (2009).
- de Smet C , LoriotA. DNA hypomethylation in cancer: epigenetic scars of a neoplastic journey. Epigenetics5(3), 206–213 (2010).
- De Smet C , LoriotA. DNA hypomethylation and activation of germline-specific genes in cancer. Adv. Exp. Med. Biol.754, 149–166 (2013).
- Ahrendt SA , EisenbergerCF , YipLet al. Chromosome 9p21 loss and p16 inactivation in primary sclerosing cholangitis-associated cholangiocarcinoma. J. Surg. Res.84(1), 88–93 (1999).
- Page A , PaoliP , MoranSalvador E , WhiteS , FrenchJ , MannJ. Hepatic stellate cell transdifferentiation involves genome-wide remodeling of the DNA methylation landscape. J. Hepatol.64(3), 661–673 (2016).
- Somineni HK , ZhangX , BiaginiMyers JMet al. Ten-eleven translocation 1 (TET1) methylation is associated with childhood asthma and traffic-related air pollution. J. Allergy Clin. Immunol.137(3), 797–805.e5 (2016).
- Tryndyak V , KindratI , DrevalK , ChurchwellMI , BelandFA , PogribnyIP. Effect of aflatoxin B1, benzo[a]pyrene, and methapyrilene on transcriptomic and epigenetic alterations in human liver HepaRG cells. Food Chem. Toxicol.121, 214–223 (2018).
- Baptissart M , SèdesL , HolotaHet al. Multigenerational impacts of bile exposure are mediated by TGR5 signaling pathways. Sci. Rep.8(1), 1–12 (2018).
- Guicciardi ME , KrishnanA , BronkSF , HirsovaP , GriffithTS , GoresGJ. Biliary tract instillation of a SMAC mimetic induces TRAIL-dependent acute sclerosing cholangitis-like injury in mice. Cell Death Dis.8(1), e2535–e2535 (2017).
- Masyuk TV , MasyukAI , LarussoNF. TGR5 in the cholangiociliopathies. Dig. Dis. S.KargerAG ( Ed.). 420–425 (2015).
- Neuman M , AnguloP , MalkiewiczIet al. Tumor necrosis factor-α and transforming growth factor-β reflect severity of liver damage in primary biliary cirrhosis. J. Gastroenterol. Hepatol.17(2), 196–202 (2002).
- Afford SC , Ahmed-ChoudhuryJ , RandhawaSet al. CD40 activation-induced, Fas-dependent apoptosis and NF-κB/AP-1 signaling in human intrahepatic biliary epithelial cells. FASEB J.15(13), 2345–2354 (2001).
- Shackel NA , McGuinnessPH , AbbottCA , GorrellMD , McCaughanGW. Identification of novel molecules and pathogenic pathways in primary biliary cirrhosis: cDNA array analysis of intrahepatic differential gene expression. Gut49(4), 565–576 (2001).
- Srivastava B , MellsGF , CordellHJet al. Fine mapping and replication of genetic risk loci in primary sclerosing cholangitis. Scand. J. Gastroenterol.47(7), 820–826 (2012).
- Sebode M , PeiselerM , FrankeBet al. Reduced FOXP3+ regulatory T cells in patients with primary sclerosing cholangitis are associated with IL2RA gene polymorphisms. J. Hepatol.60(5), 1010–1016 (2014).
- Wakabayashi K , LianZX , MoritokiYet al. IL-2 receptor α-/- mice and the development of primary biliary cirrhosis. Hepatology44(5), 1240–1249 (2006).
- Terada R , YamamotoK , HakodaTet al. Stromal cell-derived factor-1 from biliary epithelial cells recruits CXCR4-positive cells: implications for inflammatory liver diseases. Lab. Investig.83(5), 665–672 (2003).
- Adam L , ZoldanK , HofmannMet al. Follicular T helper cell signatures in primary biliary cholangitis and primary sclerosing cholangitis. Hepatol. Commun.2(9), 1051–1063 (2018).
- Zimmer CL , von SethE , BuggertMet al. A biliary immune landscape map of primary sclerosing cholangitis reveals a dominant network of neutrophils and tissue-resident T cells. Sci. Transl. Med.13(599), eabb3107 (2021).
- Li L , GaoY , WuQ , ChengASL , YipKY. New guidelines for DNA methylome studies regarding 5-hydroxymethylcytosine for understanding transcriptional regulation. Genome Res.29(4), 543–553 (2019).
- Smith AK , KilaruV , KocakMet al. Methylation quantitative trait loci (meQTLs) are consistently detected across ancestry, developmental stage, and tissue type. BMC Genomics15, 145 (2014).
- Quddus J , JohnsonKJ , GavalchinJet al. Treating activated CD4+ T cells with either of two distinct DNA methyltransferase inhibitors, 5-azacytidine or procainamide, is sufficient to cause a lupus-like disease in syngeneic mice. J. Clin. Invest.92(1), 38–53 (1993).
- Yung RL , QuddusJ , ChrispCE , JohnsonKJ , RichardsonBC. Mechanism of drug-induced lupus. I. Cloned Th2 cells modified with DNA methylation inhibitors in vitro cause autoimmunity in vivo. J. Immunol.154(6), 3025–3035 (1995).
- de Andres MC , Perez-PampinE , CalazaMet al. Assessment of global DNA methylation in peripheral blood cell subpopulations of early rheumatoid arthritis before and after methotrexate. Arthritis Res. Ther.17(1), 233 (2015).