
 ?Mathematical formulae have been encoded as MathML and are displayed in this HTML version using MathJax in order to improve their display. Uncheck the box to turn MathJax off. This feature requires Javascript. Click on a formula to zoom.
Abstract
Aim: Tandem bisulfite (BS) and oxidative bisulfite (oxBS) conversion on DNA followed by hybridization to Infinium HumanMethylation BeadChips allows nucleotide resolution of 5-hydroxymethylcytosine genome-wide. Here, the authors compared data quality acquired from BS-treated and oxBS-treated samples. Materials & methods: Raw BeadArray data from 417 pairs of samples across 12 independent datasets were included in the study. Probe call rates were compared between paired BS and oxBS treatments controlling for technical variables. Results: oxBS-treated samples had a significantly lower call rate. Among technical variables, DNA-specific extraction kits performed better with higher call rates after oxBS conversion. Conclusion: The authors emphasize the importance of quality control during oxBS conversion to minimize information loss and recommend using a DNA-specific extraction kit for DNA extraction and an oxBSQC package for data preprocessing.
Lay abstract
DNA hydroxymethylation (5-hydroxymethylcytosine [5hmC]) is a chemical modification of the cytosines in the DNA that affects gene transcription. 5hmC has been used as a biomarker for early cancer detection and survival prediction in recent years. 5hmC is measured using tandem bisulfite (BS) and oxidative bisulfite (oxBS) conversion of DNA followed by quantification through DNA methylation microarrays. This study observed a consistent loss of high-quality data in oxBS-treated samples compared with BS-treated samples. The authors offer a bioinformatic tool to evaluate potential quality issues in the process and some technical advice to reduce false signals in the data. Thus, they emphasize the importance of preserving DNA integrity when using tandem BS- and oxBS-treated DNA to measure 5-methylcytosine and 5hmC.
DNA methylation is a type of epigenetic modification where a methyl group replaces one hydrogen in the fifth position of the cytosine nucleotide in DNA (5-methylcytosine [5mC]). Specifically, DNA methylation occurs most frequently in the context of CpG dinucleotides. 5mC is well-studied in regulating gene transcription, inhibiting retrotransposon activation and maintaining gene dosage compensation in naturally imprinted regions and is essential for establishing and preserving cellular identity [Citation1–4]. Although 5mC is a stable DNA chemical modification, 5mC demethylation can be achieved by either passive dilution through DNA replication or active demethylation by the TET family of enzymes. During active demethylation, the TET enzymes oxidize 5mC into 5-hydroxymethylcytosine (5hmC). TET further oxidizes 5hmC to 5-formylcytosine (5fC) and then 5-carboxylcytosine (5caC) [Citation5–7]. Finally, the TDG and the base excision repair (BER) pathway convert 5fC and 5caC into an unmethylated cytosine [Citation8].
5hmC is frequently used as a marker to investigate the dynamic DNA demethylation process, as an intermediate state between 5mC and an unmethylated cytosine [Citation5]. Most tissues have ∼4% of 5mC, while 5hmC varies under 1% by different tissue types [Citation9]. 5fC and 5caC are ten- to 1000-fold less abundant than 5hmC and considered committed demethylation intermediates as they are effectively removed to complete the demethylation process [Citation10]. Unlike 5fC and 5caC, 5hmC modifications are relatively stable and have multiple independent functions beyond serving as an intermediate oxidized form of 5mC in the active demethylation process [Citation5]. Recent research has demonstrated that 5hmC can serve as an informative biomarker in mammalian development and diseases [Citation6,Citation11]. In the human fetal brain, 5hmC modification plays a critical role in neuronal function, learning and memory during neurodevelopment [Citation12]. In the immune system, the dynamic change of 5hmC is responsible for T-cell development and differentiation [Citation13]. In cancer, the 5hmC signal in circulating cell-free DNA (cfDNA) is a promising biomarker for early cancer detection and indicates multiple tumor types and stages [Citation14–17].
The Infinium HumanMethylation450K and MethylationEPIC BeadChip arrays designed by Illumina (CA, USA) have been most commonly used after sodium bisulfite (BS) treatment for genome-wide methylation studies in recent years [Citation18]. When DNA is treated with sodium BS, 5mC and 5hmC are preserved as cytosines, while unmethylated cytosines are deaminated to uracil. In other words, DNA methylation measured by methylation microarrays following BS treatment is an aggregation of 5mC and 5hmC. Most differentiated tissues and cell types have a very low level of 5hmC, with the central nervous system tissue containing the highest level of 5hmC (0.3–0.7%) in DNA [Citation9]. The kidney, nasal epithelium, bladder, heart, skeletal muscle and lung are considered to have a medium level of 5hmC abundance (0.15–0.17%) [Citation9]. The aggregation of 5mC and 5hmC measured using BS treatment is acceptable for most tissues, as the 5hmC level is generally low. However, for tissues with a relatively high 5hmC abundance, it is necessary to distinguish 5hmC from 5mC to obtain the true signals.
Tandem BS and oxidative bisulfite (oxBS) treatment is one of the most commonly used methods to discern 5hmC from 5mC at the single-nucleotide level on the same sample, followed by hybridization to the methylation microarrays [Citation19,Citation20]. Separate aliquots of each DNA sample are processed in parallel where one aliquot undergoes BS treatment only and the other first undergoes oxidation and then BS treatment. When DNA is oxidized, 5mC remains as 5mC, while 5hmC is converted into 5fC. The 5fC is susceptible to BS treatment, and it is deaminated into uracil (equivalent to an unmethylated cytosine), while 5mC is preserved as a cytosine upon BS treatment [Citation21]. Thus, oxBS conversion allows the measurement of nucleotide-level 5mC specifically. The level of 5hmC at a single-nucleotide resolution is then estimated by subtracting the oxBS measure (5mC) from the BS measure (5hmC + 5mC) at each probe [Citation19].
Although it is considered the gold standard for measuring DNA methylation, BS treatment results in some DNA damage by fragmentation [Citation22,Citation23]. By first using an oxidant to convert 5hmC to 5fC in oxBS treatment, additional damage may be incurred [Citation24]. However, the second-generation oxBS-seq protocol demonstrated a comparable DNA recovery from the oxBS conversion workflow to that from the BS conversion [Citation21]. Importantly, the oxidant is also sensitive to several contaminants if present. Special cautions must be taken to prevent interactions with chemicals such as alcohols (ethanol, isopropanol, phenol), alcohol-containing compounds (Tris, EB buffer, TE buffer, glycerol, surfactants), solutions < pH 9.0 and CO2, both in the air and in the solution, which may interfere with the oxBS reaction [Citation25].
Probe call rate is usually evaluated using detection p-values derived from comparing negative control probe fluorescence signal intensity to intensities at measured cytosines. Background signals are primarily based on negative technical controls included in the array and used in multiple methylation data processing pipelines as part of their quality control [Citation26,Citation27]. However, more recently, some evidence has shown that the use of negative controls (even using extremely stringent detection p-value limits) cannot filter out artifacts caused by failed hybridization due to compromised DNA integrity [Citation28,Citation29]. Those unfiltered, low-quality probes often manifest falsified intermediate methylation. In one study, p-value with out-of-band (OOB) array hybridization (pOOBAH) was designed and tested to address those artifacts [Citation28]. Unlike a negative detection p-value, pOOBHA evaluates probe call rate using OOB signals of the type I probes [Citation28,Citation30]. For type I probes, only one out of two color channels was used to measure the methylation signal. The intensities in the unused color channel were utilized as a reference to calculate pOOBHA and assess probe call rate [Citation28].
This study aims to evaluate the call rate of the probes on Illumina microarrays in paired samples exposed to tandem BS and oxBS conversion and identify potential sources of technical variability contributing to the altered signals. As a secondary aim, the authors developed a new bioinformatic tool to perform quality control in an effort to eliminate unstable 5hmC signals and identify potentially mislabeled samples undergoing tandem oxBS using control probes in the Illumina microarrays.
Materials & methods
Datasets
Twelve independent datasets were included in this study, four data sets from the authors’ laboratories available through Gene Expression Omnibus (GEO; GSE182919) and eight publicly available datasets on GEO that have Illumina Human Methylation450K or MethylationEPIC array data on paired BS and oxBS-treated samples (). In total, 417 pairs of samples were accessed, including clear cell renal cell carcinoma (ccRCC; n = 22), human fetal oligodendrocyte (HFO; n = 18), dexamethasone-treated glioma patient whole blood (DWB; n = 16), pediatric brain tumors (n = 40), human cerebellum (n = 4) [Citation19], Kagami–Ogata syndrome patient peripheral blood (n = 10) [Citation31], human placenta (n = 23) [Citation32], glioblastoma (n = 30) [Citation33], high-grade glioma (n = 21), Alzheimer’s disease patients’ brains and controls (n = 192) [Citation34], human bronchial epithelial cells (n = 6) [Citation35] and smokers’ bronchoalveolar lavage (n = 35) [Citation36]. The pOOBHA value was computed using the SeSAMe pipeline.
Table 1. Baseline characteristics of discovery datasets.
Probe call-rate calculation
The probe call rate was defined as the proportion of probes with a pOOBHA <0.05 over the total number of probes contained on the microarray. It was calculated as . A one-sided pairwise Wilcoxon rank-sum test was used to compare the probe call rate between paired BS-treated samples and oxBS-treated samples across datasets.
Statistical analyses on technical variables & signal variation
Next, the authors conducted principal component regression analyses, with extraction kit, array ID, single-stranded DNA amount (ng/μl), BS and oxBS treatment batch, total DNA amount, amount of sample to use per oxBS reaction and subject included in the model to investigate the variable attribution to the variation of unfiltered methylation signal in BS-converted and oxBS-converted samples, respectively. Multiple types of commercial DNA extraction kits are available on the market and the performance of kits may vary by the purpose of the experiment [Citation37,Citation38]. While a DNA-specific extraction kit targets DNA extraction solely, tandem nucleic acid extraction kits are designed for both DNA and RNA extraction. In this study, the DNA-specific extraction kits used included Qiagen Blood & Tissue Kit, CelProgen and Zymo Quick-DNA Miniprep Plus Kit, and the tandem nucleic acid extraction kit used was Qiagen AllPrep Kit. To test whether the probe call rate is significantly different between using a DNA-specific extraction kit and using a tandem nucleic acid extraction kit, for DNA extraction in BS and oxBS samples, the authors employed two different models: a multivariable linear regression model with sample source adjusted as a fixed-effect (Equation 1) and a linear mixed-effect model with sample source included as a random intercept (Equation 2).(Equation 1)
(Equation 2)
In the equations above, the dependent variable Y is the probe call rate. i represents sample (i = 1, 2, …, n). j represents whether the samples are BS-converted or oxBS-converted (j = BS or oxBS). b represents random effect, and ε is random error. p-value < 0.05 is the cutoff for testing the hypothesis that the mean probe call rate is equivalent between using a tandem nucleic acid extraction kit and using a DNA-specific extraction kit (e.g., H0:β1j = 0).
Statistical analyses on 5mC & 5hmC stability
To further investigate the consistency and reproducibility of 5mC and 5hmC signals, the authors examined the correlation of 5mC and 5hmC beta values across 18 replicate HFO samples. The Pearson’s correlation coefficient was computed for 5mC and 5hmC signals in each pair in the replicates. Next, to explore the stability of 5mC and 5hmC signals across all probes, the coefficient of variation was calculated and plotted against the median beta value for each probe in the replicate samples. The replicate samples were prepared in four different batches. The intraclass correlation coefficient (ICC) with different batches defined as groups was calculated and regressed against the median beta value for each probe across the replicate samples. The ICC indicates how stable the signal is per probe across the batches.
Making recommendations to eliminate unstable 5hmC signals & evaluate the information loss with low-quality probes
To eliminate the probes with unstable 5hmC signals, a cutoff 5hmC level is recommended based on the coefficient of variation of the 5hmC signal across probes. The cutoff point was selected using the optimality criteria modified by Perkins and Schisterman [Citation39]. The unstable probes were defined as probes with a median 5hmC value smaller than the optimized cutoff value. For probes that passed the recommended cutoff (stable probes), a low-quality probe was identified as a probe with a pOOBHA <0.05 for less than 20% of the samples. The low-quality probe fraction is calculated as .
To evaluate the loss of information for low-quality probes, a density plot was created to visualize the distribution of 5hmC signal between the low-quality probes and the probes that passed quality control. A genomic location enrichment analysis was conducted to assess if a certain CpG location (island, shore, shelf and open sea) was enriched for low-quality probes. The oxBScut function in the oxBSQC package was created to make the 5hmC cutoff recommendation, identify low-quality probes and evaluate the information loss by excluding the low-quality probes from the study. The package is available on https://github.com/SalasLab/oxBSQC.
The package was tested on the authors’ ccRCC datasets. The ccRCC dataset is comprised of two batches of sample processing. The first batch contains eight pairs of BS and oxBS-treated DNA that are extracted using only the tandem nucleic acid extraction kit. The second batch contains 16 pairs of BS- and oxBS-treated DNA that are extracted using the tandem nucleic acid extraction kit and the DNA-specific extraction kit. More operational effort was made toward maintaining the integrity of DNA in the second batch.
Development of using internal normalization control probes to check BS & oxBS sample labeling
The Illumina HumanMethylation BeadChip contains internal normalization control probes (NORM_A/G/C/T) to assess the array performance in two color channels (red A/T and green G/C) and can further be used for correcting intensity-related dye biases [Citation26,Citation40]. As the oxBS procedure involves additional oxidative treatment on DNA compared with the BS procedure, the authors hypothesized that the signal intensities in the internal control probes are lower in oxBS-converted samples than in the BS-converted samples. Such differences would allow discrimination between two samples in a BS and an oxBS-treated pair. To test the hypothesis, the authors applied the one-sided pairwise Wilcoxon rank-sum test to the paired ccRCC samples to investigate if the signal intensity in oxBS-treated samples is lower than that in BS-treated samples in NORM_A, NORM_G, NORM_C and NORM_D probes, respectively. The p-value <0.05 is defined as the cutoff for statistical significance.
Furthermore, to test if the same standard can be used to correctly categorize BS and oxBS-converted samples in another independent dataset, the authors applied the one-sided pairwise Wilcoxon rank-sum test with the direction defined as ‘greater’ to the paired HFO samples with their BS and oxBS information masked and randomized. In a BS and an oxBS-treated HFO pair, if the returned p-value <0.05, the first sample is categorized as ‘BS’ whereas the other one is classified as ‘oxBS’. If the returned p-value ≥0.05, the first sample is categorized as ‘oxBS’ while the other is ‘BS’ The sensitivity and specificity of using the method to predict BS and oxBS-converted samples were calculated for NORM_A, NORM_G, NORM_C and NORM_D probes, respectively. The oxBSlabel function was created to predict BS and oxBS labels using the NORM_A/G/C/T internal control probes and included in the oxBSQC package.
Results
Probe call rates in BS- & oxBS-treated samples
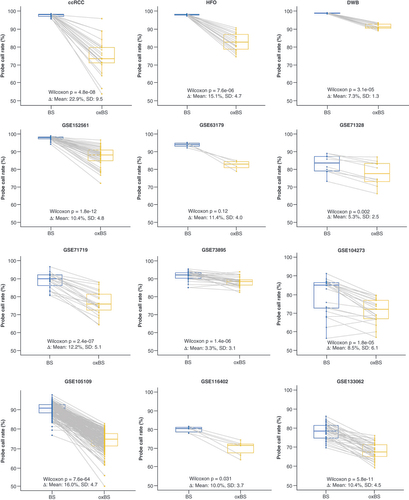
Twelve independent datasets with 417 paired BS- and oxBS-treated samples across 14 tissue types were investigated for probe call rate (). A consistent decrease of probe call rate was observed in paired oxBS-treated samples compared with BS-treated samples across all datasets (). The probe call rate decreased, on average, by 11.1% (ranges from 3.4 to 22.9%) in oxBS samples compared with BS samples (Supplementary Figure 1). All datasets with sample sizes of five or more (11 out of the 12) had significantly lower probe call rates in oxBS-treated samples (p < 0.05). The magnitude of the probe call rate decrease varied by datasets (CV = 0.47).
A consistent decrease of probe call rates was observed in paired oxidative bisulfite-treated samples compared with bisulfite-treated samples across all datasets. p-values were calculated using one-sided pairwise Wilcoxon rank-sum tests.
ccRCC: Clear cell renal cell carcinoma; DWB: Dexamethasone-treated glioma patient whole blood; HFO: Human fetal oligodendrocyte.
Probe quality differences between BS- & oxBS-treated samples based on DNA extraction kit used
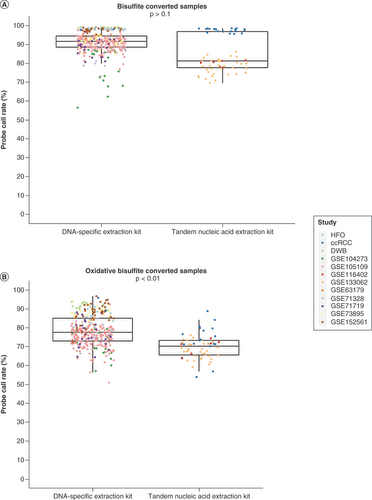
To understand the attribution of different factors to the variation of methylation signal in BS-treated samples and oxBS-treated samples, the authors conducted principal component analyses on the ccRCC samples. For the BS-treated samples, the only variable identified as significant in the first principal component is the subject, which explains 22.1% of the data variation (Supplementary Figure 2A). For the oxBS-treated samples, the first component identified the extraction kit, array ID, oxBS treatment batch, total DNA amount and subject as significant, which in total explains 29.3% of the data variation (Supplementary Figure 2B). The results revealed more variables that greatly contribute to the variation of methylation signal after the oxBS treatment compared with the BS treatment. To further explore how the DNA extraction kit can impact the data quality, the authors compared the probe call rate between samples that used a DNA-specific extraction kit and samples that used a tandem nucleic acid extraction kit (). For BS-converted samples, no significant difference in probe call rate was observed between samples that used a DNA-specific extraction kit and samples that used a tandem nucleic acid extraction kit in the multivariable linear regression model after adjusting for sample source (Δ = -0.4%; p > 0.1; Supplementary Table 1) and the linear mixed-effect model with sample source included as a random intercept (Δ = -1.7%; p > 0.1; Supplementary Table 2). For oxBS-converted samples, significantly lower probe call rates were observed in samples that used the tandem nucleic acid extraction kit compared with samples that used the DNA-specific extraction kit in the multivariable linear regression model after adjusting for sample source (Δ = -19.5%; p < 0.01; Supplementary Table 1) and linear mixed-effect model with sample source as a random intercept (Δ = -15.6%; p < 0.01; Supplementary Table 2). As a sensitivity analysis, the authors excluded the ccRCC samples, as they appeared to drive the insignificant results in the BS-converted samples. The authors observed significantly lower probe call rates in samples that used the tandem nucleic acid extraction kit compared with samples that used the DNA-specific extraction kit for both BS (Δ = -12.2%; p = 0.038) and oxBS (Δ = -12.5%; p = 0.039) conversions. Cumulatively, the data demonstrated that for oxBS conversion, using a DNA-specific extraction kit as opposed to a tandem nucleic acid extraction kit yields higher-quality data.
(A) For bisulfite-converted samples, no significant difference was observed in the probe call rates between samples that used DNA-specific extraction kits and samples that used tandem nucleic acid extraction kits (p > 0.1). (B) For oxidative bisulfite-converted samples, significantly lower probe call rates were observed in samples that used the tandem nucleic acid extraction kit compared with samples that used the DNA-specific extraction kit (p < 0.01). p-values were calculated using multivariable linear regression models and linear mixed-effect models.
ccRCC: Clear cell renal cell carcinoma; DWB: Dexamethasone-treated glioma patient whole blood; HFO: Human fetal oligodendrocyte.
5mC & 5hmC signal stability
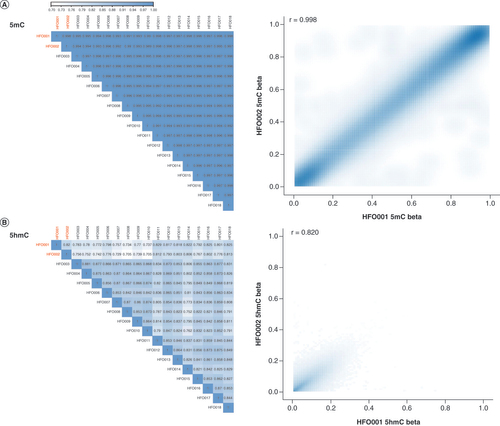
With 18 pairs of replicate HFO samples, the authors assessed the stability of the 5mC and 5hmC signals. 5mC signal is highly stable in the replicates with the Pearson’s r >0.99 for any pair (), whereas the Pearson’s r ranges from 0.70 to 0.88 for 5hmC signal (). For instance, the Pearson’s r between HFO001 and HFO002 is 0.998 for 5mC () and 0.820 for 5hmC (). Next, the authors computed the coefficient of variation for each probe across the replicate samples and regressed against median beta values for 5mC and 5hmC to explore the stability of the signal at the probe level. For 5hmC, the signal is unstable for probes with a low 5hmC level, especially for the ones approaching zero (Supplementary Figure 3A). Although the signal is also relatively unstable for low 5mC level probes, the CV does not reach as high as that of low 5hmC level probes (Supplementary Figure 3B). Next, the authors investigated how the BS and oxBS treatment batch can impact 5mC and 5hmC stability at the probe level by exploring the relationship between the ICC with different batches defined as groups and the median beta values for each probe across the replicate samples. The authors observed that ICC is lower in low 5hmC level probes (r = 0.45; Supplementary Figure 3C). Although a positive r (r = 0.30) is also observed between ICC and 5mC level, the correlation is not as strong as that in 5hmC (Supplementary Figure 3D). In summary, the authors observed more instability for the 5hmC signal than for the 5mC signal in replicate samples, especially for probes with low levels of 5hmC.
(A) The 5mC signal is highly stable in the replicates with the Pearson’s r >0.99 for any pair. For instance, the Pearson’s r between HFO001 and HFO002 is 0.998 for 5mC. (B) The Pearson’s r ranges from 0.70 to 0.88 for the 5hmC signal. The Pearson’s r between HFO001 and HFO002 is 0.820 for 5hmC.
5hmC: 5-hydroxymethylcytosine; 5mc: 5-methylcytosine; HFO: Human fetal oligodendrocyte.
Making a recommendation for a 5hmC cutoff value
As the authors observed instability with low-level 5hmC signals, they next developed a bioinformatic tool, oxBSQC, to recommend a 5hmC cutoff value that excludes the probes with an unstable 5hmC signal. The oxBSQC was applied to the ccRCC datasets. The recommended 5hmC cutoff is 0.09 for batch 1 samples and 0.08 for batch 2 samples (Supplementary Figure 4). The low-quality probe fractions are 71.84% in batch 1 samples and 40.82% in batch 2 samples (Supplementary Figure 5). By evaluating the CpG genomic location enrichment for low-quality probes, the authors observed that the open sea area is significantly enriched for the low-quality probes in both batch 1 and batch 2 samples (Supplementary Figure 6). In summary, the oxBSQC is a practical tool that makes recommendations for 5hmC cutoff and evaluates the information loss with the unusable probes accommodating the variability of datasets.
Using internal normalization controls for a quality check on BS & oxBS labeling
In the next step, the authors assessed whether the signal intensities in the internal normalization control probes (NORM_A/G/C/T) were distinguishable between BS-converted and oxBS-converted ccRCC samples. Among 22 pairs of BS- and oxBS-converted ccRCC samples, all pairs demonstrated discernible signal intensities in NORM_A and NORM_T probes in the red channel and NORM_C in the green channel (p < 0.05). For NORM_G probes in the green channel, one pair out of 22 did not reach the statistical significance threshold but was marginally significant (p = 0.053; Supplementary Figure 7 & Supplementary Table 3). Signal intensity in the internal normalization control probes to distinguish BS- and oxBS-converted samples in 18 pairs of HFO replicate samples reached 100% sensitivity and 100% specificity. Applying the same standard to the publicly available datasets included in this study, the authors identified mislabeled samples and reached out to the researchers for correction on public repositories.
Discussion
Although DNA hydroxymethylation serves as an intermediate during the dynamic DNA demethylation process, it is involved in normal tissue development and disease pathogenesis, such as cancer [Citation41–43]. Studies have identified stable 5hmC biomarkers for the early diagnosis, prognostic evaluation and prediction of therapeutic efficacy for various cancer types [Citation11,Citation42]. 5hmC signatures in cfDNA using non-invasive blood tests have shown promising early cancer detection results [Citation14–17]. Tandem oxBS and BS treatments are among the most commonly used methods for measuring 5mC and 5hmC at the genome-wide scale due to cost–effectiveness and efficiency [Citation19,Citation20].
The present study observed a consistent decrease in the probe call rate after oxBS treatment on Illumina HumanMethylation microarrays, although the magnitude of the loss varied across datasets. The reduction in the probe call rates in oxBS-treated samples was consistent across all datasets. Although one of the most commonly used methods for measuring 5hmC at the base resolution, paired BS conversion and oxBS conversion have been criticized for their harsh chemical treatment that could significantly degrade the DNA [Citation22,Citation23]. BS-free methods such as TET-assisted pyridine borane sequencing (TAPS) have been developed to overcome the issue [Citation44]. However, such methods are costly and laborious to conduct and have not been validated for use with microarrays. Although a certain level of DNA degradation can be caused by BS treatment, the authors have shown that obtaining a probe call rate above 80–90% is achievable. Although the second-generation oxBS-seq protocol illustrated that a similar level of DNA recovery between BS and oxBS workflow is feasible [Citation21], the authors observed variability in the extent of high-quality probe loss after oxBS treatment. Two major components that could explain the variation of DNA quality after BS and oxBS treatments are the biological nature of the sample used and the artifacts engendered during the experimental operation. DNA fragility is dependent on the tissue or organ from which the cell originated [Citation45,Citation46]. Inherently more fragile DNA would be more susceptible to the damage caused by BS and oxBS treatment. Due to the biological nature of tissue-specific DNA fragility, the possible effort is limited to addressing the vulnerability of specific DNA during BS and oxBS conversion. However, interventions are possible during the process to reduce artificial damage to DNA to preserve DNA integrity to the fullest extent. For instance, in the present study, in the two batches of ccRCC samples, the data quality of the second batch outperformed the first batch immensely, with the low-quality probe fraction decreased by 31%. The authors believe that such improvement is greatly attributed to the operational attention paid to maintaining the integrity of DNA, with DNA fragmentation being monitored in the second batch.
The present study identified multiple factors that contribute to the variation in methylation and hydroxymethylation data. Apart from the variability between subjects, the data variation is substantially attributed to the DNA extraction kit used, the total DNA amount used and the batches of Infinium methylation arrays. The authors identified 5hmC as more susceptible to technical effects other than the between-subject effect compared with the 5mC signals. DNA extraction is a key step preceding BS and oxBS treatment. The two major types of DNA extraction kits on the market are DNA-specific extraction kits designed specifically for DNA purification and extraction and tandem nucleic acid extraction kits designed for simultaneous purification of DNA and RNA. Previous evidence has demonstrated the variations in extracted DNA quality across different commercial extraction kits [Citation37,Citation38]. An 83–406% increase in DNA yields was observed in a DNA-specific kit compared with tandem nucleic acid extraction kits [Citation38]. From these results, although there were no significant differences between using the two types of kits in methylation data integrity in BS-treated samples, the authors observed a better quality of data retained in oxBS-treated samples by using the DNA-specific extraction kit. Compared with the BS conversion of DNA, the additional oxidative chemical treatment in oxBS conversion likely added more burden to DNA fragments [Citation24]. Larger yields of DNA by using a DNA-specific extraction kit may help prepare the samples to survive the harsh chemical treatments. DNA-specific extraction is the authors’ recommended method for preparing DNA for tandem BS and oxBS treatment. Further studies are still required to identify potential contaminants in the process.
The high consistency and reproducibility of methylation measurements using Infinium HumanMethylation BeadChips across replicate samples observed in the present study are consistent with previous findings [Citation47]. Furthermore, with the 5mC and 5hmC signals distinguished, the authors observed better stability of the 5mC signal than the 5hmC signal in replicate samples. The instability of the 5hmC signal mainly came from CpGs with low levels of 5hmC. The probes with a generally lower measure of 5hmC demonstrated more variation and more susceptibility to batch effect in this study. Especially for the probes approaching zero levels of 5hmC, the variation increased exponentially. The instability of 5hmC measurements in those probes may result in false positive or negative findings in downstream epigenome-wide association study analyses. To eliminate the probes with an unstable 5hmC signal, the authors developed the oxBScut function in the package to make a recommendation for a 5hmC cutoff; the recommended cutoff is derived from minimizing the coefficient of variation of 5hmC signals across samples. As 5hmC level and DNA susceptibility to oxBS treatment vary by tissue and cell type [Citation9,Citation45,Citation48], the authors recommend applying the oxBScut for 5hmC cutoff selection with specificity to tissue and cell type.
On Illumina HumanMethylation BeadChips, internal normalization control probes are included for quality control (NORM_A/G/C/T). Ninety-three and 85 pairs of internal normalization control probes are contained in the 450K array and the EPIC array, respectively [Citation40,Citation49]. In each pair, one probe will incorporate a base A or T in the red channel, and the other probe will include a base G or C in the green channel. The probes are used to evaluate the array performance in two color channels and can further be used for correcting intensity-related dye biases [Citation26]. On publicly available datasets, sample mislabeling can impede research communication and data reusability and even produce spurious results [Citation50]. With the heterogeneity and abundance of publicly available methylation data, mislabeling can often happen [Citation51]. Especially for paired samples, incorrect labels are a common mistake. For BS and oxBS paired data, one can identify mislabeled samples when calculating the 5mC and 5hmC levels, as the 5hmC are measured as BS methylation minus oxBS methylation. If the 5hmC signal is estimated to be under zero, the sample may be mislabeled. However, random assay noise and artifacts can generate negative 5hmC estimation with correct labels [Citation20]. To the authors’ knowledge, no other standards have been developed to check the labeling of BS and oxBS paired samples for quality control. The authors compared the signal intensities of internal normalization control probes between BS-treated and oxBS-treated samples. They developed a method to distinguish BS-converted samples and oxBS-converted samples in a tandem treated pair. The consistent lower intensities of oxBS-converted samples in internal normalization control probes allowed a quality check for BS and oxBS sample labeling in the data preprocessing pipeline. By applying the method to publicly available datasets, the authors identified multiple mislabeled BS and oxBS samples. They reached out to the curators of the mislabeled samples and asked for reinspection of the sample labels. The authors believe that inserting the method into the tandem treated BS and oxBS methylation data preprocessing pipeline would benefit the scientific community by eliminating the relatively common BS and oxBS mislabeling issue.
While this analysis generally points to valid results on high-quality probe loss in oxBS-treated samples compared with BS-treated samples and 5hmC signal instability compared with 5mC signal, there are some limitations. First, although the loss of high-quality probes is consistent in oxBS-treated samples, the variation of the magnitude of the problem by different tissue used is not elucidated. The problem might be more prevalent in tissue types with more fragile DNA [Citation45,Citation46]. Additional research is needed to investigate the susceptibility of the DNA from specific tissues to damage by oxBS treatment. Second, although multiple technical variables are included in this study, further investigation on how other technical effects impact the DNA reaction to oxBS treatment is needed. For instance, technical variation caused by using different protocols on sample freezing, thawing and storage may also significantly impact how DNA reacts to oxBS conversion [Citation52,Citation53]. Third, 5mC and 5hmC stability was investigated in only one cell type, HFOs. Future research on validation using multiple tissue types is necessary. Also, how technical variables can impact signal stability needs further investigation. Finally, when comparing data quality between the tandem nucleic acid extraction kit samples and the DNA-specific extraction kit samples, multiple studies with different sample types and protocols were pooled. For a better comparison, the same samples with DNA extracted using the tandem nucleic acid extraction kits and the DNA-specific extraction kits are needed. Also, only one type of commercial tandem nucleic acid extraction kit was included in the authors’ datasets, and they can only speculate about the reasons behind those alterations, such as lower DNA yield or the presence of kit contaminants interfering with the oxidation step. Modifications in the DNA extraction protocols to reduce these problems are also needed in future analyses.
Conclusion
Our study demonstrated a consistent decrease in the probe call rate in oxBS-treated samples compared with BS-treated samples. Here, we emphasized preserving DNA integrity during the oxBS conversion operation to minimize information loss. We recommend using DNA-specific extraction kits instead of tandem nucleic acid extraction kits on DNA purification and extraction. To mitigate the instability of 5hmC signals, we recommend using oxBSQC to remove highly unstable probes. We recommend a quality check using the oxBSQC on possible mislabeling on BS and oxBS samples using the internal normalization control probes when using publicly available datasets.
Future perspective
DNA hydroxymethylation has been found to serve more than just an intermediate role in the demethylation process. While 5mC is a well-studied biomarker for cancer diagnosis and prognosis, 5hmC biomarkers have been developed for early cancer detection and survival in recent years, especially in cfDNA. As more effort will be put into studies using 5hmC to predict cancer and other diseases, our study emphasizes the importance of preserving DNA integrity when using tandem BS and oxBS-treated DNA to measure 5mC and 5hmC. A reasonable evaluation of DNA quality is required when using these approaches. Future studies should pay attention to preserving DNA integrity during BS and oxBS conversion and develop methods to more efficiently measure 5hmC.
A consistent decrease in probe call rates was observed in oxidative bisulfite samples compared with bisulfite samples.
Concerns are raised regarding reduced power in 5-hydroxymethylcytosine (5hmC) epigenome-wide association studies with a decreased level of high-quality probes.
Multiple technical components can contribute to compromised DNA integrity in oxidative bisulfite conversion, especially DNA extraction kits.
DNA-specific extraction kits are recommended for DNA extraction for oxidative bisulfite treatment compared with tandem nucleic acid extraction kits.
5hmC signal is relatively unstable compared with 5-methylcytosine signal, especially for probes with low levels of 5hmC.
Using oxBSQC to eliminate unstable probes with 5hmC signal is recommended.
Using internal normalization controls for quality checks on bisulfite and oxidative bisulfite labeling is recommended.
Z Zhang, MK Lee and LA Salas designed the study. Z Zhang acquired data and performed data analyses of the paper. Z Zhang, MK Lee, L Perreard, BC Christensen and LA Salas participated in the interpretation of data for the work. Z Zhang and MK Lee were responsible for the initial draft of the work. Z Zhang, MK Lee, L Perreard, BC Christensen, KT Kelsey and LA Salas participated in the final drafting and critical revision for important intellectual content. Z Zhang, MK Lee, L Perreard, BC Christensen, KT Kelsey and LA Salas read and approved the final manuscript.
Ethical conduct of research
For local human samples, the authors state that they have obtained appropriate institutional review board approval or have followed the principles outlined in the Declaration of Helsinki for all human or animal experimental investigations. In addition, for investigations involving human subjects, informed consent has been obtained from the participants involved.
Supplemental Document 1
Download MS Word (1.8 MB)Supplementary data
To view the supplementary data that accompany this paper please visit the journal website at: www.tandfonline.com/doi/suppl/10.2217/epi-2021-0490
Financial & competing interests disclosure
This study is funded by United States Congressionally Directed Medical Research Programs Funding (number: W81XWH-20-1-0778), United States National Institute of General Medical Sciences (number: P20GM104416/8299) and National Institutes of Health (number: R01CA216265, R01CA253976, R01CA207360). The authors have no other relevant affiliations or financial involvement with any organization or entity with a financial interest in or financial conflict with the subject matter or materials discussed in the manuscript apart from those disclosed.
No writing assistance was utilized in the production of this manuscript.
Data sharing statement
The datasets analyzed during the current study are publicly available on the Gene Expression Omnibus data repository: https://www.ncbi.nlm.nih.gov/geo/ (accession numbers: GSE182919, GSE152561, GSE63179, GSE71328, GSE71719, GSE73895, GSE104723, GSE105109, GSE116402, GSE133062). For publicly available data, the original data sources are referenced in the manuscript methods.
Additional information
Funding
References
- Bogdanovic O , ListerR. DNA methylation and the preservation of cell identity. Curr. Opin. Genet. Dev.46, 9–14 (2017).
- Houseman EA , AccomandoWP , KoestlerDCet al. DNA methylation arrays as surrogate measures of cell mixture distribution. BMC Bioinformatics13, 86 (2012).
- Sharp AJ , StathakiE , MigliavaccaEet al. DNA methylation profiles of human active and inactive X chromosomes. Genome Res.21(10), 1592–1600 (2011).
- Ponomaryova AA , RykovaEY , GervasPA , CherdyntsevaNV , MamedovIZ , AzhikinaTL. Aberrant methylation of LINE-1 transposable elements: a search for cancer biomarkers. Cells9(9), doi:10.3390/cells9092017 (2020).
- Cui XL , NieJ , KuJet al. A human tissue map of 5-hydroxymethylcytosines exhibits tissue specificity through gene and enhancer modulation. Nat. Commun.11(1), 6161 (2020).
- Tahiliani M , KohKP , ShenYet al. Conversion of 5-methylcytosine to 5-hydroxymethylcytosine in mammalian DNA by MLL partner TET1. Science324(5929), 930–935 (2009).
- Ito S , ShenL , DaiQet al. TET proteins can convert 5-methylcytosine to 5-formylcytosine and 5-carboxylcytosine. Science333(6047), 1300–1303 (2011).
- He YF , LiBZ , LiZet al. TET-mediated formation of 5-carboxylcytosine and its excision by TDG in mammalian DNA. Science333(6047), 1303–1307 (2011).
- Globisch D , MunzelM , MullerMet al. Tissue distribution of 5-hydroxymethylcytosine and search for active demethylation intermediates. PLoS ONE5(12), e15367 (2010).
- Song CX , HeC. Potential functional roles of DNA demethylation intermediates. Trends Biochem. Sci.38(10), 480–484 (2013).
- Xu T , GaoH. Hydroxymethylation and tumors: can 5-hydroxymethylation be used as a marker for tumor diagnosis and treatment?Hum. Genomics14(1), 15 (2020).
- Spiers H , HannonE , SchalkwykLC , BrayNJ , MillJ. 5-hydroxymethylcytosine is highly dynamic across human fetal brain development. BMC Genomics18(1), 738 (2017).
- Tsagaratou A , AijoT , LioCWet al. Dissecting the dynamic changes of 5-hydroxymethylcytosine in T-cell development and differentiation. Proc. Natl Acad. Sci. USA111(32), e3306–e3315 (2014).
- Guler GD , NingY , KuCJet al. Detection of early stage pancreatic cancer using 5-hydroxymethylcytosine signatures in circulating cell free DNA. Nat. Commun.11(1), 5270 (2020).
- Song CX , YinS , MaLet al. 5-Hydroxymethylcytosine signatures in cell-free DNA provide information about tumor types and stages. Cell Res.27(10), 1231–1242 (2017).
- Zeng C , StroupEK , ZhangZ , ChiuBC , ZhangW. Towards precision medicine: advances in 5-hydroxymethylcytosine cancer biomarker discovery in liquid biopsy. Cancer Commun. (Lond.)39(1), 12 (2019).
- Cao F , WeiA , HuXet al. Integrated epigenetic biomarkers in circulating cell-free DNA as a robust classifier for pancreatic cancer. Clin. Epigenetics12(1), 112 (2020).
- Teschendorff AE , ReltonCL. Statistical and integrative system-level analysis of DNA methylation data. Nat. Rev. Genet.19(3), 129–147 (2018).
- Field SF , BeraldiD , BachmanM , StewartSK , BeckS , BalasubramanianS. Accurate measurement of 5-methylcytosine and 5-hydroxymethylcytosine in human cerebellum DNA by oxidative bisulfite on an array (OxBS-array). PLoS ONE10(2), e0118202 (2015).
- Houseman EA , JohnsonKC , ChristensenBC. OxyBS: estimation of 5-methylcytosine and 5-hydroxymethylcytosine from tandem-treated oxidative bisulfite and bisulfite DNA. Bioinformatics32(16), 2505–2507 (2016).
- Booth MJ , OstTW , BeraldiDet al. Oxidative bisulfite sequencing of 5-methylcytosine and 5-hydroxymethylcytosine. Nat. Protoc.8(10), 1841–1851 (2013).
- Tanaka K , OkamotoA. Degradation of DNA by bisulfite treatment. Bioorg. Med. Chem. Lett.17(7), 1912–1915 (2007).
- Olova N , KruegerF , AndrewsSet al. Comparison of whole-genome bisulfite sequencing library preparation strategies identifies sources of biases affecting DNA methylation data. Genome Biol.19(1), 33 (2018).
- Cadet J , DaviesKJA. Oxidative DNA damage & repair: an introduction. Free Radic. Biol. Med.107, 2–12 (2017).
- Nugen ATGC. TrueMethyl® oxBS module user guide. (2019). M01481_v3_User_Guide:_TrueMethyl_oxBS_module_4977.pdf(nugen.com)
- Wilhelm-Benartzi CS , KoestlerDC , KaragasMRet al. Review of processing and analysis methods for DNA methylation array data. Br. J. Cancer109(6), 1394–1402 (2013).
- Aryee MJ , JaffeAE , Corrada-BravoHet al. Minfi: a flexible and comprehensive bioconductor package for the analysis of Infinium DNA methylation microarrays. Bioinformatics30(10), 1363–1369 (2014).
- Zhou W , TricheTJ Jr , LairdPW , ShenH. SeSAMe: reducing artifactual detection of DNA methylation by Infinium BeadChips in genomic deletions. Nucleic Acids Res.46(20), e123 (2018).
- Heiss JA , JustAC. Improved filtering of DNA methylation microarray data by detection p values and its impact on downstream analyses. Clin. Epigenetics11(1), 15 (2019).
- Triche TJ Jr , WeisenbergerDJ , VanDen Berg D , LairdPW , SiegmundKD. Low-level processing of Illumina Infinium DNA Methylation BeadArrays. Nucleic Acids Res.41(7), e90 (2013).
- Matsubara K , KagamiM , NakabayashiKet al. Exploration of hydroxymethylation in Kagami–Ogata syndrome caused by hypermethylation of imprinting control regions. Clin. Epigenetics7, 90 (2015).
- Green BB , HousemanEA , JohnsonKCet al. Hydroxymethylation is uniquely distributed within term placenta, and is associated with gene expression. FASEB J.30(8), 2874–2884 (2016).
- Johnson KC , HousemanEA , KingJE , Von HerrmannKM , FadulCE , ChristensenBC. 5-Hydroxymethylcytosine localizes to enhancer elements and is associated with survival in glioblastoma patients. Nat. Commun.7, 13177 (2016).
- Smith AR , SmithRG , PishvaEet al. Parallel profiling of DNA methylation and hydroxymethylation highlights neuropathology-associated epigenetic variation in Alzheimer’s disease. Clin. Epigenetics11(1), 52 (2019).
- Zhang X , ChenX , WeirauchMTet al. Diesel exhaust and house dust mite allergen lead to common changes in the airway methylome and hydroxymethylome. Environ. Epigenet.4(3), dvy020 (2018).
- Ringh MV , Hagemann-JensenM , NeedhamsenMet al. Tobacco smoking induces changes in true DNA methylation, hydroxymethylation and gene expression in bronchoalveolar lavage cells. EBioMedicine46, 290–304 (2019).
- Patel PG , SelvarajahS , GuerardKPet al. Reliability and performance of commercial RNA and DNA extraction kits for FFPE tissue cores. PLoS ONE12(6), e0179732 (2017).
- Mathieson W , ThomasGA. Simultaneously extracting DNA, RNA, and protein using kits: is sample quantity or quality prejudiced?Anal. Biochem.433(1), 10–18 (2013).
- Perkins NJ , SchistermanEF. The inconsistency of ‘optimal’ cutpoints obtained using two criteria based on the receiver operating characteristic curve. Am. J. Epidemiol.163(7), 670–675 (2006).
- Xu Z , LangieSA , DeBoever P , TaylorJA , NiuL. RELIC: a novel dye-bias correction method for Illumina Methylation BeadChip. BMC Genomics18(1), 4 (2017).
- Richa R , SinhaRP. Hydroxymethylation of DNA: an epigenetic marker. EXCLI J.13, 592–610 (2014).
- Pfeifer GP , XiongW , HahnMA , JinSG. The role of 5-hydroxymethylcytosine in human cancer. Cell Tissue Res.356(3), 631–641 (2014).
- Ficz G , GribbenJG. Loss of 5-hydroxymethylcytosine in cancer: cause or consequence?Genomics104(5), 352–357 (2014).
- Liu Y , Siejka-ZielinskaP , VelikovaGet al. Bisulfite-free direct detection of 5-methylcytosine and 5-hydroxymethylcytosine at base resolution. Nat. Biotechnol.37(4), 424–429 (2019).
- Huebner K . Molecular biology: DNA fragility put into context. Nature470(7332), 46–47 (2011).
- Letessier A , MillotGA , KoundrioukoffSet al. Cell-type-specific replication initiation programs set fragility of the FRA3B fragile site. Nature470(7332), 120–123 (2011).
- Moran S , ArribasC , EstellerM. Validation of a DNA methylation microarray for 850,000 CpG sites of the human genome enriched in enhancer sequences. Epigenomics8(3), 389–399 (2016).
- Li W , LiuM. Distribution of 5-hydroxymethylcytosine in different human tissues. J. Nucleic Acids2011, 870726 (2011).
- Xu Z , NiuL , LiL , TaylorJA. ENmix: a novel background correction method for Illumina HumanMethylation450 BeadChip. Nucleic Acids Res.44(3), e20 (2016).
- Toker L , FengM , PavlidisP. Whose sample is it anyway? Widespread misannotation of samples in transcriptomics studies. F1000Res5, 2103 (2016).
- Heiss JA , JustAC. Identifying mislabeled and contaminated DNA methylation microarray data: an extended quality control toolset with examples from GEO. Clin. Epigenetics10, 73 (2018).
- Shao W , KhinS , KoppWC. Characterization of effect of repeated freeze and thaw cycles on stability of genomic DNA using pulsed field gel electrophoresis. Biopreserv. Biobank.10(1), 4–11 (2012).
- Huang LH , LinPH , TsaiKWet al. The effects of storage temperature and duration of blood samples on DNA and RNA qualities. PLoS ONE12(9), e0184692 (2017).