
Abstract
Aim: To detect expression quantitative trait methylation (eQTM) loci within the cerebrum of prenatal Down syndrome (DS) and controls. Material & methods: DNA methylation gene expression profiles were acquired from NeuN+ nuclei, obtained from cerebrum sections of DS and controls. Linear regression models were applied to both datasets and were subsequently applied in an integrative analysis model to detect DS-associated eQTM loci. Results & conclusion: Widespread aberrant DNA methylation and gene expression were observed in DS. A substantial number of differentially methylated loci were replicated according to a previously reported study. Subsequent integrative analyses (eQTM) yielded numerous associated DS loci. the authors associated DNA methylation, gene expression and eQTM loci with DS that may underlie particular DS phenotypical characteristics.
Plain language summary
Down syndrome (DS) is a common (1 of 1000 live births) autosomal aneuploidy in humans. Epigenetic programming regulates gene expression, defines cell fate and differentiation and drives early development. The authors aimed to detect DNA loci that are linked with the early developing brain of DS by analyzing DNA methylation and gene expression in prenatal DS neuronal samples. Numerous differential DNA methylated and expressed loci were found to be linked with DS. These findings may underlie particular DS characteristics, yet follow-up confirmation is required.
Down syndrome (DS) is the most common autosomal aneuploidy in humans, involving chromosome 21 or parts of it, which occurs in approximately 1 in 1000 live births. DS includes a range of phenotypical features, including short stature, congenital heart defects, gastrointestinal disorders and intellectual disability (ID). In addition, DS patients are at high risk to develop thyroid diseases (congenital or by autoimmune-driven processes) and early-onset Alzheimer disease (AD) [Citation1–4]. However, the severity of these clinical and phenotypical features is variable [Citation5–7]. In relation to diagnostic testing, several postnatal screening methodologies have been developed over the last few decades [Citation8–11]. Prenatal screening of DS involves an invasive test based on the analysis of chorion villi or a non-invasive prenatal test (NIPT), which is based on the analysis of cell free fetus DNA within the maternal peripheral blood [Citation12,Citation13]. The number of full-term DS pregnancies has been shown to remain stable over the past decades [Citation14,Citation15]. The latter implies that the need to unravel the involved molecular mechanisms of DS remains high. Understanding how DS aneuploidy manifests at a molecular level may contribute to the development of novel clinical and therapeutic strategies that improve the quality of life of DS patients and decrease the clinical and socio-economic burden of DS. DS was characterized in the mid-20th century, yet the exact molecular mechanisms through which the DS aneuploidy results in the observed phenotypes remain largely unclear. In particular, the mechanisms explaining aberrant brain development in DS are unknown to date [Citation7]. Within the scope of genetics, it has been postulated that the dosage of particular chromosomal segments of chromosome 21 is associated with specific DS features [Citation16–19]. In relation to variable ID, it has recently been shown that aberrant differentiation of neuronal progenitor cells in the brain was associated with abnormal development of the brain in a DS mice model [Citation20]. Regulation of cell differentiation is, by definition, associated with gene expression patterns, which are under the control of epigenetic processes, of which DNA methylation is the most commonly studied feature. In order to determine any functional effect of aberrant DNA methylation within a particular feature of a gene, the first essential step to investigate is whether it is associated with any difference in gene expression [Citation21,Citation22]. The human brain and its early development are highly complex and only accessible for molecular analyses via postmortem specimens. Furthermore, the level of cellular heterogeneity of the brain demands a focus on the analysis of specific types of cells. For example, cells representing the neuronal brain fraction express the RBFOX3 gene, NeuN+, in their nuclei [Citation23,Citation24]. Price et al. recently reported about divergent neuronal DNA methylation across the developmental stages of the normal human brain. Prenatal and postnatal neuronal versus non-neuronal samples were investigated [Citation25]. A previous report on ‘bulk’ prenatal brain showed that DNA methylation differed significantly between DS and healthy subjects [Citation26]. It was postulated that the expression of epigenetic writers, such as DNMT3L, could be involved in this context. Although these studies emphasize the importance of epigenetic mechanisms in the DS brain, these analyses were not focused on neuronal cells per se, which obviously confounds a relation with the DS ID characteristic. Studying neuronal cells in particular remains challenging. However, study of the neuronal nuclei represents a more suitable way of studying neuronal cells [Citation24,Citation27]. To the authors’ knowledge, the neuronal (NeuN+) cell population of the prenatal brain has not been investigated in such a context. It this study, the authors aim to detect differences in DNA methylation and gene expression, as well as their integrative relation, in the neuronal (NeuN+) nuclei fraction of the prenatal DS brain.
Materials & methods
Cohort description, quality control & confirmation of the DS phenotype
Prenatal human brain tissue was obtained from the NIH Neurobank, University of Maryland, MD, USA: in total, 12 (seven female and four male) cerebrum section specimens representing DS and 20 (14 female and six male) cerebrum section specimens from normal fetuses. For the latter sample, it was reported that terminations were not initiated due to particular clinical or phenotypical aberrations in fetuses or mothers, nor were there indications of the involvement of obvious environmental factors, such as extensive substance(s) abuse. Specimens were shipped to the Amsterdam University Medical Centers, deep-frozen and under non-tissue interacting preservatives. Frozen slices of 20 μm were obtained using a Cryostar NX70 from Thermo Scientific. Prior to further analyses, the authors first performed quality control (QC) in order to confirm a DS aneuploidy or not for all specimens. To this end, DNA and RNA were isolated from a single frozen slice using the Allprep DNA/RNA mini kit (cat# 80204) from Qiagen®, conforming to the manufacturer’s protocol. RNA integrity number (RIN) values were obtained according to the manufacturer’s protocol using a Bioanalyzer G2938 (Agilent Technologies, CA, USA), were a RIN >8 was considered a good-quality specimen, eligible for further analysis. Genotypic confirmation was achieved using quantitative fluorescence-polymerase chain reaction (QF-PCR), which was performed using the QSTR-plus, v2-kit from Elucigene (Manchester, UK) for chromosomes 13, 18, 21, X and Y. Where inconclusive, the results of the latter test were further investigated using comparative genomic hybridization (CGH) arrays, 4 × 180 K slides, AMADID 023363 (Agilent Technologies, CA, USA) per the manufacturer’s protocol.
Isolation of NeuN+ nuclei sub fraction
Isolation of NeuN+ nuclei was performed according to the previously reported protocol of Krishnawami et al. [Citation28]. In brief, 20 μm slices of frozen brain were dissociated in homogenization buffer using a pestle and tube (Bel-Art Micro-Tube Homogenizer F65000-0006, Fisher Scientific) until no tissue chunks remained. Subsequently, the lysate was filtered using a 30 μm cell strainer (MACS SmartStrainer, 130-098-548). The nuclei yield was microscopically determined using trypan blue staining, where 400 k nuclei per ml indicated a sufficient yield for further sorting processing. Immunostaining was done using Hoechst 33342 (general staining) in combination with Mouse IgG kappa Isotype Control (clone P3.6.2.8.1, phycoerythrin [PE], eBioscience) and Anti NeuN-PE (Clone A60, FCMAB137PE, EMD Millipore Corp.) for non-neuronal and neuronal nuclei, respectively. Sorting of nuclei was performed using a Sony SH800Z Cell Sorter (Sony Biotechnology), 405 nm (Hoechst), 488 nm and 561 nm for PE labeled nuclei. Finally, DNA and RNA were simultaneously isolated from NeuN+ nuclei using a ZR-Duet DNA/RNA Miniprep Plus kit (cat# D7003; ZYMO® research), conform the manufacturer’s protocol. Quality of DNA and RNA was determined using a Bioanalyzer G2938 (Agilent Technologies, CA, USA). The RIN values threshold was relaxed to 3–6 due to the aberrant rRNA compositions within nuclei. Bisulphite conversion was done using a quantatative PCR (qPCR) service provider standard protocol (GenomeScan, Leiden, The Netherlands).
DNA methylation profiling & analyses
DNA methylation profiles were obtained from 100–200 ng DNA, using the Illumina HumanMethylation Infinium Methylation EPIC BeadChip array, per the manufacturer’s protocol. Raw data were imported in the R statistical environment (v3.6.3); QC was performed using MethylAid (v. 1.20.0), where samples within default parameter quality limits were used for further analyses [Citation29]. Subsequent exploratory data analyses included the identification of potential confounding effects, obtained from the metadata by applying correlation analysis of the first eight principal components (PCs) with sex, cerebrum section and cerebrum region variables. PC analysis was based on the singular deconvolution function, available in base R. Correlation coefficients (r2) >0.3 were eligible for inclusion in the final design model. Probes annotated as hybridizing to the allosomes, flagged as harboring potential genetic variants with an minor allele frequency > 0.01 (either at the CpG or at the single base extension) or being potentially promiscuous (i.e., cross-hybridizing) were removed [Citation30]. Raw data were normalized using the preprocesNoob function, whereupon the authors applied linear regression models (limma function, V3.40.6), available under the Minfi (v. 1.32.0) package, in order to detect differentially methylated positions (DMPs) between DS and controls. Cell composition estimation (NeuN-neg and NeuN-pos, available under the Minfi) was applied and confirmed using standardcytospin-based microscopy quality control, in and between DS and controls. The authors considered probes with a false discovery rate (FDR) < 0.05 to be significant. The statistical power estimate of the present study was based on DNA methylation data because, compared with gene expression profiles, this dataset holds a substantially larger number of measured features and its effect size range is limited. According to the report of Tsai and Bell (2015), the authors estimated 80% statistical power, at an α < 0.05 in a sample including 15 to 20 patients and controls, to detect a delta mean β difference of 10–12% (single locus) [Citation31]. Differentially methylated regions (DMRs) were defined as regions spanning two or more adjacent probes, all at an FDR < 0.05 using the R package DMRcate (v1.20.0) [Citation32]. DMRs representing a Stouffer score < 0.05 were considered statistically significant. DMRs were annotated to genes (Ensembl, GRCh38) if they occurred within 2000 bp upstream or downstream of the gene.
Gene expression profiling & analyses
mRNA was isolated through rRNA depletion, whereupon cDNA libraries were generated using low RNA input kit NEBNext Ultra II Directional RNA Library Prep Kit (Illumina, NEB #E7760S/L). Resulting libraries were subsequently submitted for paired-end next generation sequencing on the Illumina NOVAseq 6000 to a sequencing depth of 40 × 106 reads per sample. Image analysis, base calling and quality check were performed with the Illumina data analysis pipeline RTA (v3.4.4) and Bcl2fastq (v2.20). Primary QC assessment of the raw sequencing data was performed using the FastQC (v 0.11.9) package [Citation33]. Genomic features were added using featureCounts (v.2.0.0) [Citation34]. Raw reads were aligned against the GRCh38 reference genome using STAR (v2.7.3) [Citation35,Citation36]. Postalignment processing was performed using SAMTOOLS and counts were generated using featureCounts [Citation34,Citation37]; QC metrics were summarized for each step using MultiQC [Citation38]. Genes with zero counts in more than 25% of the samples were removed from the dataset. Raw counts were imported into the R statistical environment, whereupon the differential expression analyses were performed using DESeq2 (v3.1.0), applying a similar design as used for differential methylation analyses [Citation39]. Genes with an FDR < 0.05 were considered statistically significant.
Integrative expression methylation analysis
Integrative DNA methylation and gene expression analyses were performed by means of an expression quantitative trait methylation (eQTM) analysis, as described by Li Yim et al. [Citation40]. In brief, the Pearson correlation coefficient was calculated between the median percentage methylation per DMR per sample and the log-transformed count of the associated gene. The 95% confidence intervals were calculated using 10,000 bootstraps, while the p-values were calculated using a resampling approach, where the Pearson correlation coefficient was compared with a null distribution of Pearson correlation coefficients generated from randomly generated DMRs of equal length to the DMR of interest. In this analysis, DMRs were included that spanned a region of >2 adjacent probes at an FDR < 0.1. DMR-gene correlations with a p-value < 0.05 were considered statistically significant.
Gene set enrichment analysis
Gene set enrichment analysis (GSEA) was performed using the R package fgsea (v1.12.0) according to default parameters [Citation41]. Reference gene sets or molecular pathways were obtained at Hallmark (www.gsea-msigdb.org/gsea/msigdb/collections.jsp) and by querying the harmonizome database (http://amp.pharm.mssm.edu/Harmonizome/download) using the following search terms: Down Syndrome, intellectual disability, neuronal development, dementia, epilepsy and Alzheimer’s disease. In total, 26 gene sets of interest were obtained (Supplementary Table 1). Together with the Hallmark gene sets, the authors queried 76 gene sets for enrichment and assumed an FDR < 0.05 to be statistically significant.
Results
Rigid NeuN+ nuclei isolation from prenatal cerebrum tissue
Primary characterization using QF-PCR confirmed the DS status for the DS patient and control sample sets, with the exception of two samples that showed partially inconclusive results. These two samples were further investigated by means of CGH array analysis, through which the authors were able to confirm trisomy of chromosome 21 (Supplementary File 1). Frozen slices of the cerebrum specimens were lysed and dissociated for isolation of nuclei. Flow cytometry analyses using Hoechst indicated low numbers of NeuN+ nuclei in one DS patient and two control samples. For this reason, these samples were not included in further analyses. In order to confirm the performance of the NeuN+ labeling and sorting, the authors performed cytospin analysis on a subset of samples, which showed a clear distinction between the NeuN- and NeuN+ nuclei (). Extracted DNA and RNA were subsequently submitted for DNA methylation and gene expression analysis. Initial QC of the raw methylation and expression data indicated low quality for three DS samples and nine control samples. In total, eight DS and nine control samples were of sufficient quality for further statistical evaluation. Full descriptions of these samples can be found in & Supplementary File 1.
(A) Right: fluorescent activated sorting of NeuN+ and NeuN- nuclei based on scatter properties and verified with cytospin staining. In short, DAPI signal was removed using forward and side scatter (data not shown), leaving only nuclei (left panel). Selected areas represent selection thresholds for nuclei selection, blue annotated nuclei represent NeuN+ nuclei and orange annotated nuclei represent NeuN- nuclei. The x-axis represents NeuN absorption (nm) spectrum and the y-axis represents Hoechst absorption (nm). The panel on the right side represents the NeuN counts, where the first peak is NeuN- (56%) and the second is Neun+ (37%). (B) Cytospin image confirmation of fluorescent activated sorting procedure of nuclei. Left: NeuN staining, middle: DAPI staining and right: overlay of NeuN and DAPI staining.
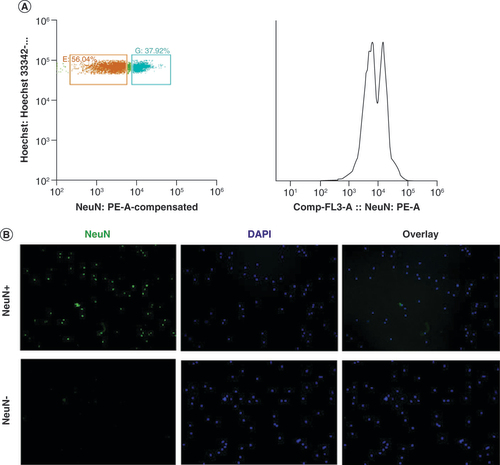
Table 1. Characteristics of cerebrum specimens that passed quality control for both DNA methylation and gene expression data.
Widespread differential DNA-methylation within the NeuN+ neuronal fraction of prenatal DS
Explorative analysis based on the first two PCs showed a clear separation of the DS and controls, indicating a widespread differential methylation (A). The authors further explored the DNA methylome for biases by correlating the first eight PCs with the following metadata: group, sex, gestational age (GA), section of the region, cerebrum region, postmortem interval, ethnicity and technical variables, such as array and slide position (B). The authors applied the following model for linear regression analysis: methylation∼group + sex + GA. In total, they detected 9908 DMPs at an FDR < 0.05 (top five, [I] & full list, Supplementary Table 1). These DMPs were annotated to all autosomes and generally showed an enrichment of hypermethylation in DS subjects versus controls. For chromosome 21, the authors observed an equal distribution of hypomethylation and hypermethylation of significant DMPs (C). In addition, the effect sizes of the DMPs, defined as beta-value mean difference between groups, were generally large, with a maximum of 59% hypomethylation in DS (D). Next, the authors searched for DMRs. In total, the authors detected 2067 DMRs, of which 288 were assumed significant (Stouffer < 0.05). Of these 288 significantly DS-associated DMRs, 180 were annotated to a particular gene and subsequently queried for the presence of a differentially expressed gene (DEG). In total, they detected an overlap of 173 DMR/DEG pairs, while for 7 DMRs an insufficient number of gene expression counts was detected. The top five are described in (II) and the full list can be found in Supplementary Table 1. DMRs were detected in all chromosomes. The maximum difference in percentage methylation observed for a DMR was 51%. This DMR was located at chr22: 18527557–18527778 (GRCh37/hg19), which represents the promoter region of both the MICAL3 and PEX26 genes. The two most significant DMRs, located at chr22:51016386–51017723 and chr10:94819559–94822747, respectively, and both comprising a region of 17 adjacent CpGs, were annotated to the promoter regions of CHKB-CPT1B gene cluster (SC 2.3 × 10⁻²²) and the CYP26C1 gene (SC 9.5 × 10⁻²⁰), respectively.
(A) Explorative principal component analysis of normalized DNA methylation profiles annotated by group. The x-axis represents the first principal component and the y-axis represents the second principal component. (B) Correlation analysis of the first eight principal components of normalized DNA methylation profiles (x-axis) with the following metadata: group, sex, section of the region, age, cerebrum region, postmortem interval, ethnicity, array and slide position. The y-axis represents the correlation coefficient. (C) Manhattan plot showing the relative percentage of DMPs at a FDR < 0.05. The x-axis represents chromosome number and the y-axis represents relative percentage of DMPs (with respect to the total per chromosome) and separated for direction of effect. (D) Volcano plot DMPs. The x-axis represents delta mean β difference (DS vs controls). The y-axis represents -log10 (FDR). Green dots represent significant DMPs at a delta difference > 0.4. Blue dots represent significant DMPs with a FDR < 0.05. Orange dots represent non-significant DMPs.
DMP: Differentially methylated position.
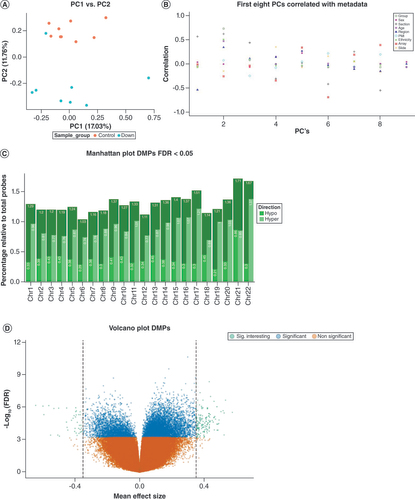
Table 2. Overview of top significant differential associations between Down syndrome and controls.
Next, in order to validate the differential DNA methylation analyses, we performed a replication analysis of our results using the study of Mendioroz et al., Supplementary Table 9 [Citation42]. First, we evaluated the overlap of 441 DMPs, of which we replicated 208 (47.2%) effect concordant and significant DMPs and five (2.3%) effect discordant and significant DMPs. Next, we compared overlap in DMRs. First, we defined 64 DMRs in the data output of Mendioroz et al., which overlapped with 20 (31.3%) effect concordant and significant DMRs of the present study. These 20 replicated DMRs were annotated to the following genes: TNFRSF25, C1orf35, CELSR3, STK19, TNXB, HLA-DQB2, TMEM151B, GLI4, FAM83H, GPT / LRRC24, VPS37B, PIWIL1, DNAJC15, UNC45A, ADAMTS10, RYR1, FKRP, ZNF837, CECR2 and CPT1B (Supplementary Table 1).
Widespread differential gene expression within the NeuN+ neuronal fraction of prenatal DS
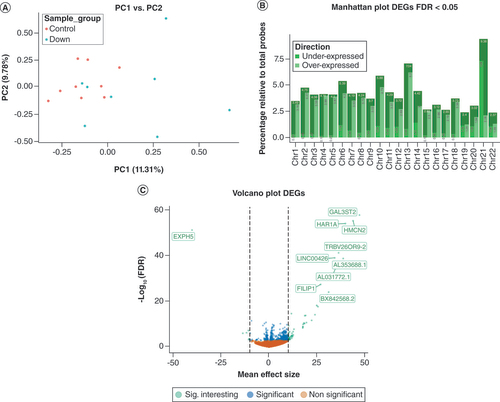
In addition to the DNA methylation analyses, the authors performed genome-wide expression analysis. Analysis of the first two principal components (PC1 and PC2) indicated a clear separation of DS subjects and controls. While the control samples were reasonably clustered, the DS samples were more dispersed across PC1 and PC2 (A). Comparing the DS with control samples, the authors observed a total of 725 DEGs at an FDR < 0.05 (top five, [III] & full list, Supplementary Table 1). The distribution of these DEGs was spread over all chromosomes. For chromosomes 2, 6, 10 and 13, the authors observed a relative enrichment of DS significant and overexpressed DEGs. The largest relative number of significant and suppressed DEGs was annotated to chromosome 21 (B). Effect sizes, expressed as -log2 fold change on count data, were generally relatively large (C). The DEG showing the largest effect size and most significant effect was observed for the GAL3ST2 gene (chr2: 241776825–241804208, GRCh38/hg38).
(A) Explorative principal component analysis of gene expression (count) profiles annotated by group. The x-axis represents the first principal component and the y-axis represents the second principal component. (B) Manhattan plot showing the relative percentage of DEGs at a FDR < 0.05. The x-axis represents chromosome number and the y-axis represents relative (with respect to the total per chromosome) percentage of DEGs, annotated for direction of effect. (C) Volcano plot representing DEGs. The x-axis represents -log2 fold change counts and the y-axis represents -log10 (FDR). Green dots represents significant DEGs with mean effect size change >10. Blue dots represent significant DEGs with -log10 (FDR) < 0.05. Orange dots represent non-significant DEGs.
DEG: Differentially expressed gene; FDR: False discovery rate.
Differentially methylated regions are abundantly correlated with gene expression in DS
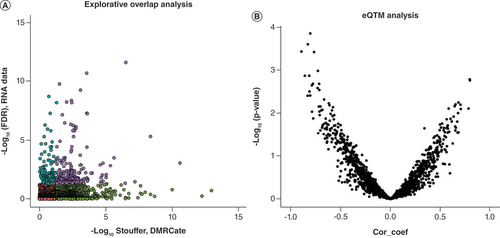
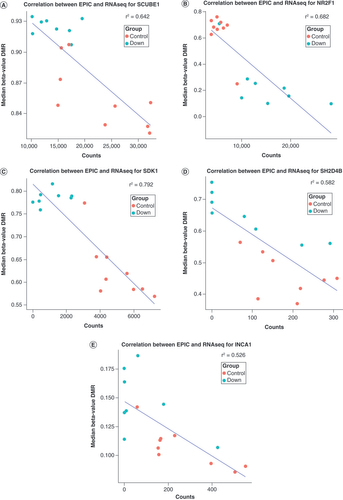
In order to explore to what extent the DS-associated DMRs were also differentially expressed, the authors plotted their relation according to the observed significance level, with the x-axis representing the Stouffer coefficient of gene-annotated DMRs and the y-axis representing their -log10(p-value) of differential expression (A & Supplementary Table 1). In total, this evaluation included 173 DMRs and DEGs, of which 50 DMR/DEG significant pairs were associated with DS. Among the top five, the authors identified the EXPH5, ADAMTS18, LHX2, HSPA12A and ITPR2 genes ([IV], ranked according significant DEGs). Subsequently, they quantified relationships (eQTM) between DMRs and DEGS following an integrative approach, wherein they observed 1526 correlations (B & Supplementary Table 1), of which 144 showed p < 0.05 (Supplementary Table 1). The top five eQTMs included loci annotated to the SCUBE1, NR2F1, SDK1, SH2D4B and INCA1 genes ([V] & A–E, respectively). The correlation coefficients in this latter set of significant eQTMs also represented the largest correlation coefficients, which ranged between -0.89 (SDK1; p = 3.0E-4) and -0.72 (INCA1; p = 9.0E-3). Although the authors observed no clear enrichment of eQTMs annotated to chromosome 21 (37 eQTMs), one DMR-gene expression pair annotated to chromosome 21 showed significant correlation, the PRMT2 gene (r = -0.79; p = 2.3E-3). The largest DMR representing a significant eQTM involved the STK19 gene (50 CpGs, chr6, r = -0.34; p = 2.4E-2).
(A) Genomic overlap between Down syndrome-associated DMRs and DEGs. The x-axis represents -log10 Stouffer coefficient of DMRs and the y-axis represents -log10 (FDR) of DEGs. Purple dots represent significant DEG/DMR overlap, blue dots represent significant DEGs, green dots represent significant DMRs and red dots represent non-significant DEG/DMRs. (B) Expression quantitative trait methylation analysis. The x-axis represents the Pearson correlation coefficient between DMRs (median percentage difference of the β-value) and DEGs (-log2 fold change). the y-axis represents -log10 p-value of the Pearson correlation coefficient.
DEG: Differentially expressed gene; DMR: Differentially methylated region; FDR: False discovery rate.
The x-axis represents gene expression count data, and the y-axis represents median percentage difference of the β-value. The blue line represents correlation coefficient. r2 represents the absolute Pearson correlation coefficient. The red dots represent Down syndrome and the blue dots represent controls. (A) eQTM observed for the SCUBE1 gene. (B) eQTM observed for the NR2F1 gene. (C) eQTM observed for the SDK1 gene. (D) eQTM observed for the SH2D4B gene. (E) eQTM observed for the INCA1 gene.
Gene set enrichment analyses
Gene set analysis of DMPs, DMRs, DEGs, DMR/DEG overlap and eQTMs was based on 76 specified gene sets, which were obtained from databases including general and immunological pathways as well as gene sets based on DEGs of previously reported studies matching the scope of interest of this study. At the level of DMPs (FDR < 0.05), the authors detected 71 significantly enriched gene sets out of the total of 76 gene sets. Cerebrum gene expression, ID and DS-annotated gene sets represented the top 20 (Supplementary Table 2). For DMRs, DEGs, DMR/DEG overlap and eQTMs, the authors did not detect any significant gene set enrichments. DS-annotated gene sets were, however, consistently nominally significant enriched. Moreover, DEGs, DMR/DEG overlap and eQTMs also showed nominally significant association with the gene set annotated to the developing human brain characteristic.
Discussion
Widespread DMPs & regions in NeuN+ DS versus control cerebrum nuclei
In this study, the authors observed widespread differential DNA methylation analyses of neuronal fractions between DS and controls. Significant DMPs were evenly spread over all autosomes (relative to chromosome sizes,) and the authors observed a general trend toward hypermethylation, except for chromosome 21, which is in line with previously reported observations [Citation42–44]. These observations may be explained by epigenetic regulators/modulators annotated to chromosome 21, which act primarily in cis in some cases but also systematically in trans (e.g., BRWD1, DNMT3L, USP16, BACH1, PRDM15, SETD4, PRMT2 or AIRE). The top five significant DMPs indicated that loci annotated to the MSRB, SSBP3, KDM2A, ZNRF2 and DYNC1IL2 genes were associated with DS, which is further discussed in Supplementary File 1. GSEA based on these significant DMPs indicated a large number of significantly associated gene sets related to DS or brain development. Gene sets involved in immunological and metabolic processes scored substantially lower, however (Supplementary Table 2). In order to replicate these DMPs, the authors performed replication analysis. Mendioroz et al. reported on DMPs detected in the NeuN+ nucleus fraction of fetal specimens, GA 12–17 weeks [Citation42]. Although none of their reported DMPs reached FDR < 0.05, evaluation of the present study’s DMPs (at FDR < 0.05) replicated 47.2% of their top loci, concordant regarding the direction of effect. Taken together, it may be concluded that both studies are in line with each other and constitute an accurate association analysis.
Next, DMR analysis indicated DS associations spread over all autosomes, showing no particular enrichment of DMRs annotated to chromosome 21. DMR GSEA detected only four nominally significant gene set associations, involving interferon responses, DS and apoptosis. On the other hand, replication analysis of DMRs in the dataset of Mendioroz et al. showed a relatively high number (31.3%) of replicated DMRs, concordant in direction of effect. Since the applied gene sets originated mainly from bulk tissue gene expression analysis databases, these results should be taken with caution. The authors’ replication analysis, however, was based on a similar study design and can therefore be assumed to be more specific. Three of these 20 replicated DMRs, annotated to the TNFRSF25, UNC45A and CECR2 genes, were previously linked to ID and neural tube closure defects. The 20 replicated DMRS are briefly discussed further in Supplementary File 1.
Abundantly differential gene expression in NeuN+ DS versus control cerebrum nuclei
For 725 loci, the authors observed significant differential gene expression (Supplementary Table 1). The top five hits are briefly described in Supplementary File 1. GSEA fed with these DEGs did not yield significant gene sets. However, the top 10 gene sets showed nominal significance and included brain development (5x) and DS (2x). All these gene sets were based on text mining or bulk tissue gene expression databases, which may explain the absence of significant signals in the NeuN+ nuclei. Shi et al. (2016) reported on an mRNA expression set of the fetal hippocampus samples. However, the present study was unable to replicate their top hit, annotated to the EZH2 gene [Citation45]. Differences in study design, analyses and cell heterogeneity between the present study and that of Shi et al. likely explain this absence of replication.
Simultaneously differentially methylated & expressed genes (eQTMs) link to DS features
This study particularly explored the link between altered DNA methylation and gene expression of the neuronal cerebrum in DS and controls. To the authors’ knowledge, integrative analyses in the context of prenatal DS and control cerebra have not been reported previously. DNA methylation and gene expression profiles were annotated according to GRCh37 and GRCh38, respectively; however, both datasets were merged based on the HUGO Gene Nomenclature Committee gene symbol. Interrogating the genes present in GRCh37 for the gene symbols reported alongside the eQTMs indicated that this procedure did not affect the observations. First, the authors evaluated whether both the DMR and the DEG of the 173 overlapping DMR/DEG pairs reached genome-wide significance. Here, 50 (29%) pairs showed both significant DMR and DEG associations (Supplementary File 1). GSEA for these 50 DMR/DEG pairs yielded no significant gene sets. However, the top 10 gene sets did show nominal significance, including gene sets linked to brain development (5x) and DS (2x), similar to the DEG analysis. Second, eQTM analysis was performed (A–E), in which 1526 correlations were detected, of which 144 were assumed significant. The top hit was annotated to the SCUBE1 gene, which encodes for the SCUBE1 protein. Deletion of this locus (including SULT4A1 and TCF20) has been associated with aberrant neuronal development and speech and communication disorders [Citation46], which are typically also seen in DS patients [Citation47]. The eQTM locus showed a clustered but dynamic pattern regarding DS and controls, suggesting that the hypermethylation of the body of SCUBE1 leads to suppressed gene expression in DS. The second eQTM top hit was annotated to the NR2F1 gene. This locus has been shown to be linked to Bosch–Boonstra–Schaaf (BBS) syndrome (autosomal dominant), which includes optic atrophy, developmental delay and ID. The correlation between gene expression and DNA methylation to some extent suggests a clustering of DS compared with controls, where DS overall showed a hypomethylation and an overexpression of the locus. This observation is not in line with the suggested mechanism in BBS syndrome. Third, the authors detected a substantial correlation between DNA methylation and gene expression for a locus annotated to the SDK1 gene, of which hypomethylation has been associated with neuronal development, schizophrenia and post-traumatic stress disorder (PTSD) severity [Citation48,Citation49]. In this context, DS showed hypermethylation and reduced expression, which may be linked to the decreased risk for schizophrenia and PTSD in DS [Citation50]. The authors’ fourth eQTM was annotated to the SH2D4B locus for which decreased expression has been linked to renal disease. The eQTM locus did not show a clear clustering between DS and controls, suggesting a DS-unrelated effect. Despite the fact that renal diseases are not uncommon within DS [Citation51], this association, notably detected in NeuN+ nuclei, has to be taken with caution. Fifth, the authors detected an eQTM for the locus annotated to the intergenic region between the INCA1 and CAMTA2 genes. Decreased expression of INCA1 has been associated with leukemia severity [Citation52]. Most DS samples showed INCA1 hypermethylation and a corresponding absence of INCA1 expression, which may be associated with late-onset DS-linked leukemia. The CAMTA2 gene has been associated with cardiac growth stimulation [Citation53] and linked to neuronal defects involving tremor and dystonia [Citation54]. Moreover, this locus may include an enhancer region for the KIF1c gene, which is associated with spastic ataxia [Citation55]. Since the authors observed decreased expression and hypermethylation in DS, these findings may be in line with the previous reports. The present survey for enriched gene sets did not yield any significant results. Similar to the DEG and DMR/DEG overlap, nominally significant gene sets were found for DS (2x) and several that involved brain development (5x). This study is the first integrative eQTM analysis report on DS differentially methylated and expressed loci within NeuN+ nuclei of the prenatal cerebrum. Since these eQTMs reflect functionally aberrant methylation, these results may contribute to the elucidation of the molecular mechanism underlying DS and its related ID phenotype.
Causative or consequence associations
Taken together, the present analyses detected several plausible loci that may be involved in the early neuronal development of DS. Neuronal development should, however, be considered a complex interplay between different cell types such as microglia. The authors therefore acknowledge that other cell types are also likely to be involved in neuronal development and differentiation, which follows that both causal and consequence effects probably underlie the associations observed [Citation56,Citation57]. Future studies applying single cell analysis techniques may provide further insight into the interaction between different cell types and their differentiation and maturation.
Limitations
Confounders, NeuN+ in development
The criteria for sample selection focused on optimizing the homogeneity between DS and control specimens, particularly addressing sex, gestational age and the postmortem interval of the samples. Therefore, the sample size of this study was relatively small and limited the statistical power to detect lower effect differences in DNA methylation and gene expression between DS and controls. The authors acknowledge that variables such as sampled section and region of the cerebrum may have a confounding effect. The authors therefore cannot exclude a bias introduced by differences of highly specific cell type proportions while expressing NeuN, which is further discussed in Supplementary File 1. In general, array based DNA methylation detection has been reported to be bias sensitive with regard to copy number variation – in particular, in the case of small indels in specific loci. Although all cases were screened (QSTR-plus or CGH) for complete aneuploidy of chromosome 21, the authors acknowledge that they cannot fully exclude such a bias in their studies [Citation58]. Finally, the authors were unable to perform technical validation of both DNA methylation and gene expression analyses due to insufficient availability of raw materials. Consequently, false positive top findings due to technical bias cannot be ruled out in this study. On the other hand, a strength of this study is that substantial parts of the findings were successfully replicated using previously reported studies.
Conclusion
The present explorative study on differential DNA methylation and gene expression profiles in a sample of NeuN+ cerebrum tissue of DS and controls demonstrated an association of numerous loci with DS. The additional value of an integrative approach based on genome-wide DNA methylation and gene expression profiling comprises an internal validation, wherein a substantial number of the evaluated loci showed a link with DS or with one of its phenotypical characteristics such as ID, heart defects and speech impairment.
Future perspective
The present study on integrative DNA methylation and gene expression of prenatal NeuN+ neurons of DS and controls is a first explorative step toward unraveling the molecular mechanism underlying DS and, in particular, its early aberrant brain development. Still, cell heterogeneity and interaction between different types of brain subtype cells have not yet been studied at a single cell resolution in our study or studies of others. To date, recently developed methodologies and technologies, as offered by companies like 10x genomics® and Nanostring®, now allow a multi-omics (DNA, mRNA and protein) approach to a single cell or nucleus resolution. Such approaches will not only enable in-depth detection of specific aberrant cellular subtypes but also allow differential and integrative analysis. We may expect that the application of these novel methodologies will advance the elucidation of DS and its heterogeneous intellectual deficit characteristic, contributing to the improvement of DS diagnostics and prognosis.
DNA methylation and gene expression profiles were generated from NeuN+ nuclei from prenatal Down syndrome (DS) and control cerebrum.
The authors detected widespread DS-associated differential methylation and gene expression.
A substantial number of aberrant DS-associated DNA methylation loci have been replicated within a previously reported study of similar design.
Numerous DS-associated loci showed both differential gene expression and differential methylation.
Subsequent integrative analysis detected several expression quantitative trait methylations, associated with DS.
Evaluation of the detected differentially methylated regions, differentially expressed genes and expression quantitative trait methylations suggests several plausible links to neuronal impairment and DS and related disorders, but the results were not restricted to neuronal development and DS per se.
Author Contributions
P Henneman, AN Mul, MR Mizee and MM Mannens contributed to the initial study conception and design. P Henneman and AN Mul contributed to the material preparation and data collection. Statistical analyses were performed by AN Mul and P Henneman, IM Krzyzewska, M Alders and A Adelia. The first draft of the manuscript was written by P Henneman, and all authors commented on previous versions of the manuscript. All authors read and approved the final manuscript.
Ethical conduct of research
Prenatal human brain tissue were provided by the NIH Neurobank, University of Maryland, MD, USA, approved by its ethical committee, including written informed consent, and in accordance with the ethical standards as laid down in the 1964 Declaration of Helsinki and its later amendments or comparable ethical standards (https://neurobiobank.nih.gov/about-best-practices). The Neurobank, University of Maryland, MD, USA, and its ethical committee approved the study (NBB request #431, approval HP-00042077, Dr. Thomas Blanchard, 2016) and inherently publication of results obtained from these materials described in this report.
Data availability & statistical scripting
Summary statistics supporting the results in this manuscript have been provided as supplementary material. Raw data supporting the results presented in this manuscript are available on reasonable request, and under a data transfer agreement (DTA) following the Dutch data protection act (DPA) at the European Genome-Phenome Archive: https://ega-archive.org/studies, under accession id EGAS00001005564. All scripts used for statistical analyses are described in Supplementary File 1.
Supplemental File 1
Download MS Word (227.7 KB)Supplemental Information 1
Download MS Excel (22.5 MB)Supplemental Information 2
Download MS Excel (108.4 KB)Acknowledgments
The authors would like to thank the NIH Neurobank, University of Maryland, MD, USA, for the disposal of Down syndrome and control samples.
Supplementary data
To view the supplementary data that accompany this paper please visit the journal website at: www.tandfonline.com/doi/suppl/10.2217/epi-2021-0523
Financial & competing interests disclosure
This research was supported by a grant from the ZABAWAS Foundation, The Hague, The Netherlands. The authors have no other relevant affiliations or financial involvement with any organization or entity with a financial interest in or financial conflict with the subject matter or materials discussed in the manuscript apart from those disclosed.
No writing assistance was utilized in the production of this manuscript.
Additional information
Funding
References
- Pierce MJ , LafranchiSH , PinterJD. Characterization of thyroid abnormalities in a large cohort of children with Down syndrome. Horm. Res. Paediatr.87(3), 170–178 (2017).
- Aversa T , CoricaD , ZirilliGet al. Phenotypic expression of autoimmunity in children with autoimmune thyroid disorders. Front. Endocrinol. (Lausanne)10, 476 (2019).
- Wiseman FK , Al-JanabiT , HardyJet al. A genetic cause of Alzheimer disease: mechanistic insights from Down syndrome. Nat. Rev. Neurosci.16(9), 564–574 (2015).
- Asai M , KawakuboT , MoriR , IwataN. Elucidating pathogenic mechanisms of early-onset Alzheimer’s disease in Down syndrome patients. Yakugaku Zasshi137(7), 801–805 (2017).
- Antonarakis SE , LyleR , DermitzakisET , ReymondA , DeutschS. Chromosome 21 and Down syndrome: from genomics to pathophysiology. Nat. Rev. Genet.5(10), 725–738 (2004).
- Newton R . Quality of life in Down syndrome: a matter of perspective. Dev. Med. Child Neurol.60(4), 337–338 (2018).
- Baburamani AA , PatkeePA , ArichiT , RutherfordMA. New approaches to studying early brain development in Down syndrome. Dev. Med. Child Neurol.61(8), 867–879 (2019).
- Lyle R , BenaF , GagosSet al. Genotype-phenotype correlations in Down syndrome identified by array CGH in 30 cases of partial trisomy and partial monosomy chromosome 21. Eur. J. Hum. Genet.17(4), 454–466 (2009).
- Schouten JP , McelgunnCJ , WaaijerR , ZwijnenburgD , DiepvensF , PalsG. Relative quantification of 40 nucleic acid sequences by multiplex ligation-dependent probe amplification. Nucleic Acids Res.30(12), e57 (2002).
- Aref-Eshghi E , BendEG , ColaiacovoSet al. Diagnostic utility of genome-wide DNA methylation testing in genetically unsolved individuals with suspected hereditary conditions. Am. J. Hum. Genet.104(4), 685–700 (2019).
- Henneman P , BoumanA , MulAet al. Widespread domain-like perturbations of DNA methylation in whole blood of Down syndrome neonates. PLoS One13(3), e0194938 (2018).
- Oepkes D , Page-ChristiaensGC , BaxCJet al. Trial by Dutch laboratories for evaluation of non-invasive prenatal testing. Part I – clinical impact. Prenat. Diagn.36(12), 1083–1090 (2016).
- Van Der Meij KRM , SistermansEA , MacvilleMVEet al. TRIDENT-2: national implementation of genome-wide non-invasive prenatal testing as a first-tier screening test in the Netherlands. Am. J. Hum. Genet. doi:10.1016/j.ajhg.2019.10.005 (2019).
- Bakkeren IM , Kater-KuipersA , BunnikEMet al. Implementing non-invasive prenatal testing (NIPT) in the Netherlands: an interview study exploring opinions about and experiences with societal pressure, reimbursement, and an expanding scope. J. Genet. Couns. doi:10.1002/jgc4.1188 (2019).
- Hill M , BarrettA , ChoolaniM , LewisC , FisherJ , ChittyLS. Has noninvasive prenatal testing impacted termination of pregnancy and live birth rates of infants with Down syndrome?Prenat. Diagn.37(13), 1281–1290 (2017).
- Antonarakis SE . Down syndrome and the complexity of genome dosage imbalance. Nat. Rev. Genet.18(3), 147–163 (2017).
- Lejeune J , GautierM , TurpinR. [Study of somatic chromosomes from 9 mongoloid children]. C. R. Hebd. Seances Acad. Sci.248(11), 1721–1722 (1959).
- Korenberg JR , KawashimaH , PulstSMet al. Molecular definition of a region of chromosome 21 that causes features of the Down syndrome phenotype. Am. J. Hum. Genet.47(2), 236–246 (1990).
- Patterson D . Genetic mechanisms involved in the phenotype of Down syndrome. Ment. Retard. Dev. Disabil. Res. Rev.13(3), 199–206 (2007).
- Kurabayashi N , SanadaK. Molecular mechanism underlying abnormal differentiation of neural progenitor cells in the developing Down syndrome brain. Yakugaku Zasshi137(7), 795–800 (2017).
- Koch A , DeMeyer T , JeschkeJ , Van CriekingeW. MEXPRESS: visualizing expression, DNA methylation and clinical TCGA data. BMC Genomics16, 636 (2015).
- Kribelbauer JF , LuXJ , RohsR , MannRS , BussemakerHJ. Toward a mechanistic understanding of DNA methylation readout by transcription factors. J. Mol. Biol. doi:10.1016/j.jmb.2019.10.021 (2019).
- Sarnat HB , NochlinD , BornDE. Neuronal nuclear antigen (NeuN): a marker of neuronal maturation in early human fetal nervous system. Brain Dev.20(2), 88–94 (1998).
- Rizzardi LF , HickeyPF , RodriguezDiblasi Vet al. Neuronal brain-region-specific DNA methylation and chromatin accessibility are associated with neuropsychiatric trait heritability. Nat. Neurosci.22(2), 307–316 (2019).
- Price AJ , Collado-TorresL , IvanovNAet al. Divergent neuronal DNA methylation patterns across human cortical development reveal critical periods and a unique role of CpH methylation. Genome Biol.20(1), 196 (2019).
- Lu J , MccarterM , LianGet al. Global hypermethylation in fetal cortex of Down syndrome due to DNMT3L overexpression. Hum. Mol. Genet.25(9), 1714–1727 (2016).
- Montano CM , IrizarryRA , KaufmannWEet al. Measuring cell-type specific differential methylation in human brain tissue. Genome Biol.14(8), R94 (2013).
- Krishnaswami SR , GrindbergRV , NovotnyMet al. Using single nuclei for RNA-seq to capture the transcriptome of postmortem neurons. Nat. Protoc.11(3), 499–524 (2016).
- Van Iterson M , TobiEW , SliekerRCet al. MethylAid: visual and interactive quality control of large Illumina 450k datasets. Bioinformatics30(23), 3435–3437 (2014).
- Pidsley R , ZotenkoE , PetersTJet al. Critical evaluation of the Illumina MethylationEPIC BeadChip microarray for whole-genome DNA methylation profiling. Genome Biol.17(1), 208 (2016).
- Tsai PC , BellJT. Power and sample size estimation for epigenome-wide association scans to detect differential DNA methylation. Int. J. Epidemiol.44(4), 1429–1441 (2015).
- Peters TJ , BuckleyMJ , StathamALet al. De novo identification of differentially methylated regions in the human genome. Epigenetics Chromatin8, 6 (2015).
- A quality control tool for high throughput sequence data. www.bioinformatics.babraham.ac.uk/projects/fastqc/
- Chen Y , LunAT , SmythGK. From reads to genes to pathways: differential expression analysis of RNA-seq experiments using Rsubread and the edgeR quasi-likelihood pipeline. F1000Res5, 1438 (2016).
- Dobin A , DavisCA , SchlesingerFet al. STAR: ultrafast universal RNA-seq aligner. Bioinformatics29(1), 15–21 (2013).
- Dobin A , GingerasTR. Optimizing RNA-seq mapping with STAR. Methods Mol. Biol.1415, 245–262 (2016).
- Li H , HandsakerB , WysokerAet al. The Sequence Alignment/Map format and SAMtools. Bioinformatics25(16), 2078–2079 (2009).
- Ewels P , MagnussonM , LundinS , KallerM. MultiQC: summarize analysis results for multiple tools and samples in a single report. Bioinformatics32(19), 3047–3048 (2016).
- Anders S , HuberW. Differential expression analysis for sequence count data. Genome Biol.11(10), R106 (2010).
- Li Yim AYF , DeBruyn JR , DuijvisNWet al. A distinct epigenetic profile distinguishes stenotic from non-inflamed fibroblasts in the ileal mucosa of Crohn’s disease patients. PLoS One13(12), e0209656 (2018).
- Korotkevich G , SukhovV , BudinN , ShpakB , ArtyomovMN , SergushichevA. Fast gene set enrichment analysis. BioRxiv doi:10.1101/060012 (2021).
- Mendioroz M , DoC , JiangXet al. Trans effects of chromosome aneuploidies on DNA methylation patterns in human Down syndrome and mouse models. Genome Biol.16, 263 (2015).
- Kerkel K , SchupfN , HattaKet al. Altered DNA methylation in leukocytes with trisomy 21. PLoS Genet.6(11), e1001212 (2010).
- Laufer BI , HwangH , Vogel CierniaA , MordauntCE , LasalleJM. Whole genome bisulfite sequencing of Down syndrome brain reveals regional DNA hypermethylation and novel disorder insights. Epigenetics14(7), 672–684 (2019).
- Shi WL , LiuZZ , WangHDet al. Integrated miRNA and mRNA expression profiling in fetal hippocampus with Down syndrome. J. Biomed. Sci.23(1), 48 (2016).
- Vetrini F , MckeeS , RosenfeldJAet al. De novo and inherited TCF20 pathogenic variants are associated with intellectual disability, dysmorphic features, hypotonia, and neurological impairments with similarities to Smith–Magenis syndrome. Genome Med.11(1), 12 (2019).
- Barbosa RTA , DeOliveira ASB , DeLima Antao JYFet al. Augmentative and alternative communication in children with Down’s syndrome: a systematic review. BMC Pediatr.18(1), 160 (2018).
- Jiang S , ZhouD , WangYYet al. Identification of de novo mutations in prenatal neurodevelopment-associated genes in schizophrenia in two Han Chinese patient-sibling family-based cohorts. Transl. Psychiatry10(1), 307 (2020).
- Yang R , XuC , BiererLMet al. Longitudinal genome-wide methylation study of PTSD treatment using prolonged exposure and hydrocortisone. Transl. Psychiatry11(1), 398 (2021).
- Startin CM , D’souzaH , BallGet al. Health comorbidities and cognitive abilities across the lifespan in Down syndrome. J. Neurodev. Disord.12(1), 4 (2020).
- Malaga S , PardoR , MalagaI , OrejasG , Fernandez-ToralJ. Renal involvement in Down syndrome. Pediatr. Nephrol.20(5), 614–617 (2005).
- Baumer N , BaumerS , BerkenfeldFet al. Maintenance of leukemia-initiating cells is regulated by the CDK inhibitor Inca1. PLoS One9(12), e115578 (2014).
- Fang X , PoulsenR , ZhaoL , WangJ , RivkeesSA , WendlerCC. Knockdown of DNA methyltransferase 1 reduces DNA methylation and alters expression patterns of cardiac genes in embryonic cardiomyocytes. FEBS Open Bio. doi:10.1002/2211-5463.13252 (2021).
- Monies D , AbouAl-Shaar H , GoljanEAet al. Identification of a novel genetic locus underlying tremor and dystonia. Hum. Genomics11(1), 25 (2017).
- Marchionni E , MeneretA , KerenBet al. KIF1C variants are associated with hypomyelination, ataxia, tremor, and dystonia in fraternal twins. Tremor Other Hyperkinet Mov (NY)9, (2019).
- Pinto B , MorelliG , RastogiMet al. Rescuing over-activated microglia restores cognitive performance in juvenile animals of the Dp(16) mouse model of Down syndrome. Neuron108(5), 887–904.e812 (2020).
- Lewcock JW , SchlepckowK , DiPaolo G , TahirovicS , MonroeKM , HaassC. Emerging microglia biology defines novel therapeutic approaches for Alzheimer’s disease. Neuron108(5), 801–821 (2020).
- Zhou W , TricheTJJr , LairdPW , ShenH. SeSAMe: reducing artifactual detection of DNA methylation by Infinium BeadChips in genomic deletions. Nucleic Acids Res.46(20), e123 (2018).