
Abstract
Aim: To perform a comparative epigenomic analysis of DNA methylation in spermatozoa from humans, mice, rats and mini-pigs. Materials & methods: Genome-wide DNA methylation analysis was used to compare the methylation profiles of orthologous CpG sites. Transcription profiles of early embryo development were analyzed to provide insight into the association between sperm methylation and gene expression programming. Results: We identified DNA methylation variation near genes related to the central nervous system and signal transduction. Gene expression dynamics at different time points of preimplantation stages were modestly associated with spermatozoal DNA methylation at the nearest promoters. Conclusion: Conserved genomic regions subject to epigenetic variation across different species were associated with specific organ functions, suggesting their potential contribution to organ speciation and long-term adaptation to the environment.
Methylation of DNA is a well-studied epigenetic mark that is evolutionary conserved among most eukaryotic organisms such as fungi, plants and animals [Citation1,Citation2]. It involves adding a methyl group to a cytosine base within the DNA molecule and is associated with a number of key processes, including regulation of gene expression [Citation3], genomic imprinting [Citation4], X-chromosome inactivation [Citation5], preservation of chromosome stability [Citation6], repression of transposable elements [Citation7,Citation8], aging [Citation9,Citation10] and gametogenesis [Citation11]. Aberrant DNA methylation is observed in a plethora of pathological conditions, such as carcinogenesis [Citation12], kidney disease [Citation13] and metabolic disease [Citation14,Citation15], supporting the notion that DNA methylation also participates in the risk to develop disease.
The role of DNA methylation in gametogenesis is of particular importance: methylation marks in the gametes establish the developmental programming, thereby influencing cell fate, organ formation and the nature of the response to environmental factors later in life [Citation11]. DNA methylation patterns are substantially lost during gametogenesis and subsequently restored at the fully differentiated gamete stage [Citation16]. While such epigenetic reprogramming is conserved in mammalian species [Citation16,Citation17], alterations may influence gene expression and the predisposition to disease [Citation18]. Epigenetic modifications of sperm cells in different phases of spermatogenesis take part in different aspects of embryonic development upon fertilization [Citation19]. Environmental factors like dietary habits, physical activity and pollutants modulate the DNA methylation signature of spermatozoa and the phenotype of the offspring [Citation20–22], indicating that epigenetic variation in sperm may contribute to environmentally driven phenotypic plasticity in the next generation of offspring.
While several studies have mapped the epigenetic patterns of spermatozoa from humans and rodents separately [Citation23–25], little is known about the comparative differences across these species. In the present study we compared the DNA methylomes of spermatozoa from humans, mice, rats and mini-pigs, with a specific interest in conserved genomic regions. Species-specific epigenetic signatures were analyzed for their potential role during early embryo development by investigating the expression of genes near epigenetically variable regions in human and mouse embryos at the preimplantation stage. Our analysis identified epigenetic variation near genes referenced as participating in brain function and the perception of smell, supporting species-specific means to develop certain physiological functions.
Materials & methods
Biological samples & bisulfite sequencing
We performed our analyses on a panel of publicly available data sets, generated for different studies. Human (Gene Expression Omnibus [GEO] accession: GSE49624, GSE109478), mouse (GSE49624, GSE174093) and rat (GSE79566, GSE173898) sperm [Citation20,Citation25–28] are included in whole-genome bisulfite sequencing (WGBS) and reduced-representation bisulfite sequencing (RRBS) data sets, respectively. Samples were only taken from the control groups of the studies in which an exposure/intervention was conducted.
For RRBS on mini-pig sperm, semen samples were collected from four 8-month-old genetically inbred 100% miniature pigs from Specipig® (Pioneer breeding and biomedical research centre, Barcelona, Spain). Genomic DNA was extracted from the sperm cells using an AllPrep DNA/RNA/miRNA Universal Kit (Qiagen, Hilden, Germany; cat. no. 802224). The procedure was changed for processing of sperm according to the recommendations of the manufacturer. RRBS libraries were constructed from 100 ng genomic input DNA using the Ovation® RRBS Methyl-Seq library preparation kit (Tecan, Männedorf, Switzerland; cat no. 0553-32). Briefly, genomic DNA was digested with MspI enzyme, followed by adaptor ligation to Ovation RRBS Methyl-Seq adaptors containing unique molecular barcodes, followed by a final end-repair step. The ligated DNA was subjected to bisulfite conversion and left in the thermal cycler overnight at room temperature. The following day, the bisulfite-converted DNA was amplified by PCR followed by a final clean-up step. Sequencing of RRBS libraries was performed on a NovaSeq 6000 platform (Illumina, CA, USA) as 101-bp single-end reads. The results are available in the NCBI GEO database, with the accession number GSE213548.
For human WGBS data, samples were obtained from men attending the University of Utah Andrology laboratory consented for research (Institutional Review Board approved protocol # 7790). For mouse WGBS data, the study was done under an approved Institutional Animal Care and Use Committee protocol at University of Utah School of Medicine, UT, USA. For rat WGBS data, part of the study was approved by the Zoos scientific review committee and also by the Institutional Animal Care and Use Committee at University of Southern California, CA, USA. For human RRBS data, the study was approved by the Ethics Committee from the Capital Region of Denmark (reference H-1-2013-064) and informed consent was obtained from all participants. For mouse RRBS data, all procedures followed the guidelines of the National Institutes of Health Guide for the Care and Use of Laboratory Animals and the approval for the study was received from the Institutional Animal Care and Use Committee at University of Massachusetts, Amherst, USA. For rat RRBS data, the study was performed following the National Institutes of Health guidelines for the care and use of laboratory animals and approved by the Institutional Animal Care and Use Committee at The Lundquist Institute for Biomedical Innovation at Harbor–UCLA Medical Center, CA, USA. For mini-pig data, all animal procedures were performed following the National Institutes of Health guidelines for the care and use of laboratory animals at Bionea Lab and approved by the French Ministry of Education and Research (reference APAFIS#22853-201911212455784v1).
Processing bisulfite sequencing data sets
Trim Galore! v.0.4.3 (www.bioinformatics.babraham.ac.uk/projects/trim_galore/) was used to trim adapter sequences incorporated in the bisulfite sequencing reads with default parameters, except that we applied a stringency of 3 for both WGBS and RRBS data sets with the –rrbs flag only for the RRBS data set. We eliminated reads shorter than 15 bp after trimming. MultiQC v.0.8 [Citation29] was used for quality control. The trimmed reads were aligned to the human (hg38), mouse (mm10), rat (rn6) or pig (susScr11) genomes, using the Bismark aligner v.0.18.1 [Citation30]. We applied the Bismark deduplication script to the WGBS data set to remove reads mapped to identical starting positions [Citation31]. RRBS reads from mini-pigs were deduplicated using the deduplicate_bismark tool with the –barcode flag because they contained unique molecular identifiers. The bismark_methylation_extractor tool was used to estimate the methylation level at each particular cytosine site. SNPs from the dbSNP database [Citation32] (hg38 [build 151]; mm10 [build 142]; rn6 [build 149]; susScr11[build 150]) and CpGs with coverage higher than ten-times the 95th percentile of coverage were filtered out.
Orthologous CpGs were assigned using the liftOver tool from the University of California Santa Cruz (UCSC) genome browser [Citation33] using the recently published Perl scripts [Citation34] and the following procedure. The mouse, rat and mini-pig CpG sites were mapped to human coordinates (hg38) using chain files available in ftp://hgdownload.cse.ucsc.edu/goldenPath/hg38/liftOver/ and then mapped back to the first genome to ensure that it had a unique correspondent in both genomes. CpGs with a minimum of six counts were considered for further analysis. Multidimensional scaling (MDS) analysis was performed using the ratio of methylated to unmethylated CpGs (M value). The methylation percentages for different genomic regions, including gene bodies, promoters, exons and introns as well as global DNA methylation were obtained by aggregating the individual CpG methylation levels using the R package genomation v.1.20 [Citation35]. Given that the assumptions of parametric testing were violated, the Scheirer–Ray–Hare test (similar to a two-way analysis of variance setup) was performed as previously described [Citation28]. Subsequently, the Dunn post hoc test was performed to identify pairwise comparisons. The R package VennDiagram v.1.7.3 [Citation36] was used to plot Venn diagrams, and Fisher’s exact test was carried out to determine the significance of the overlaps in a pairwise fashion. The density profiles of genes and gene features methylation were performed using the sm.density.compare function of the R package sm v.2.2-5.7.1 [Citation37], applying 10,000 bootstrap for testing significant difference.
Differentially methylated gene components
The comparisons between the human, mouse, rat and mini-pig data sets were carried out using the R package GeneDMRs v.1 [Citation38]. RefGene database hg38 and CpG island annotation from the UCSC genome browser (http://genome.ucsc.edu) were used. We obtained weighted methylation levels for each group, Q-values with the false discovery rate method [Citation39] and methylation differences between species for all promoters, exons and introns. The differentially methylated regions (DMRs), including promoters (DMPs), exons (DMEs) and introns (DMIs), were defined as those with Q-values of less than 0.05.
Functional annotations of cluster networks of all DMRs & biological enrichment of DMP-related genes
To decipher the mechanism of action of DMPs, DMEs and DMIs identified from WGBS and RRBS data in each comparison, we made use of the ClueGO plug-in of Cytoscape v.3.9 [Citation40], which illustrates functionally grouped networks of the nonredundant biological terms for large gene clusters. Enrichment analyses were performed using 20 genes for WGBS and ten genes for RRBS data sets in the cluster with gene ontology (GO) tree interval range of 6–14, a κ-score of 0.4 for network connectivity, two-sided hypergeometric test with p < 0.05 and Bonferroni correction. GO biological processes (GO:BP) of DMP related genes were determined with the Database for Annotation, Visualization and Integrated Discovery website [Citation41] and visualized by the networkD3 v.0.4 [Citation42] and GOplot v.1.0.2 R packages [Citation43].
Identification of hypomethylated regions & visualization of methylation profiles
We additionally used MethPipe v.3.4.3 [Citation44] to identify hypomethylated regions (HMRs) in each species using the WGBS data sets. Briefly, the alignment BAM files from Bismark were converted to the standardized SAM format using the MethPipe ‘format reads’ program. The MethPipe ‘methcounts’ function was then used to count the methylation level at each cytosine site. The ‘merge-methcounts’ program was used to merge the individual methcounts files from multiple replicates to produce a single estimate with higher coverage for each species. The ‘hmr’ program was then used to identify HMRs in each species. This program defines the methylation levels at single sites while considering the number of reads affecting those levels using a hidden Markov model method with a β-binomial distribution. We used MethBase [Citation45] from the UCSC Genome Browser track hub to visualize the methylation profiles and HMRs.
Expression analysis
To investigate the association between DNA methylation level in DMP-related genes and early gene expression, we used stage-specific modules and looked at gene expression levels at different time points of human and mouse early embryos. Given that the zygotic genome activation (ZGA) starts during the one-to-two-cell stage in mice [Citation46,Citation47] and the four-to-eight-cell stage in humans [Citation47–49], we obtained single-cell RNA sequencing reads for the oocyte and two-cell stages in mouse and for the oocyte and eight-cell stages in human from the GEO database (accession: GSE44183) [Citation50].
We aligned the reads to the human (hg38) and mouse (mm10) genomes, using STAR v.2.5.3a [Citation51]. FeatureCounts v.1.5.3 [Citation52] was used to conduct read summation onto genes. Differential expression testing between the oocyte and ZGA stages was performed using edgeR v.3.14.0 [Citation53] with the quasi-likelihood test, then normalized values of transcripts per million (TPM; adjusted with gene length) were calculated for those genes that were overexpressed by the ZGA in at least one species. OrthoFinder [Citation54] was used to identify orthologous gene groups using all available protein sequences (www.ensembl.org/) for human and mouse. Average TPM values of the cells or embryos from the same stage for the orthologous DMP-related genes were used for visualization.
Results
DNA methylation patterns at CpG sites orthologous to humans, mice, rats & mini-pigs
To compare the DNA methylation pattern of spermatozoa from human, mouse and rat, we extracted WGBS and RRBS public data from the GEO database. For mini-pigs, we performed RRBS on spermatozoa isolated from mini-pig semen samples (A). A summary describing the basic features of the data is shown in Supplementary Table 1. Sequencing reads were mapped to in silico-generated bisulfite-converted genomes corresponding to each species. For WGBS, we measured a DNA methylation signal from both strands in 28.8–44.4 million CpG sites per sample, while for RRBS we measured 2.1–7.3 million CpG sites per sample (Supplementary Table 2).
(A) Study design. (B) Multidimensional scaling plot of DNA methylation profiles in humans, rats, mice and mini-pig sperm cells using orthologous CpG sites. The CpG profiles of different species formed different groups, as expected. (C) Methylation percentage across different genomic regions as all CpGs (global DNA methylation), gene bodies, promoters, exons, introns, first exon and intron and rest of exons and introns of human, mouse and rat orthologous CpG sites using WGBS data set and (D) of human, mouse, rat and mini-pig orthologous CpG sites using RRBS data set. Significant differences in methylation percentages were seen across different genomic regions. (pregion = 1.06E-89 and 1.86E-24 for WGBS and RRBS data sets, respectively; Scheirer–Ray–Hare test). X-axis: genomic regions; Y-axis: methylation percentage. Mean and standard deviation are shown by solid horizontal and vertical lines, respectively. Dunn test results for the genomic regions are shown in Table 1. (E & F) Venn diagrams of all identified genes, promoters, exons and introns using (E) WGBS and (F) RRBS data sets for human–mouse and human–rat comparisons. (G & H) Density plots for DNA methylation in genes, promoters, introns and exons for (G) human–mouse and (H) human–rat using WGBS data sets.
RRBS: Reduced-representation bisulfite sequencing; WGBS: Whole-genome bisulfite sequencing.
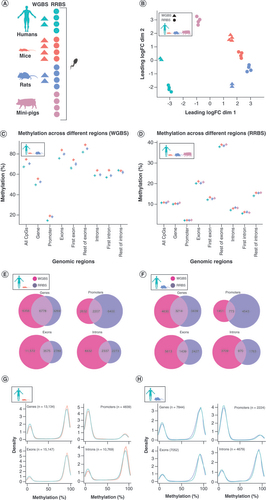
Next, we mapped nonhuman DNA methylomes to the human reference genome at single-CpG resolution (see Methods section). CpG sites from mice and rats were mapped to the human genome, even when their orthologous positions did not correspond to a CpG site in humans; for example, in the context of CHG, CHH (where ‘H’ represents any base except G). This allowed us to map 12.5–17.6 million CpG sites per sample for WGBS data, and 1.6–4.2 million CpG sites per sample for RRBS data (Supplementary Table 2). We annotated 0.9–1.9 million fully conserved orthologous CpGs in the human and mouse genomes (i.e., CpG in both genomes) and 0.6–2.5 million fully conserved CpGs in the human and rat genomes using the RRBS and WGBS data sets, respectively, as well as 1.4 million fully conserved CpGs in the human and mini-pig genomes using the RRBS data set (Supplementary Table 2). For the subsequent analyses, we opted to only use fully conserved orthologous CpG sites.
The methylation levels of orthologous CpGs were mapped against densities of genes, as shown in Supplementary Figure 1A. Comparing human and mouse genomes using WGBS data, we identified a respective distribution of orthologous CpG sites of 14.8, 37.3, 34.4 and 13.5% within promoters, exons, introns and intergenic regions, respectively, and 16.1, 14.1 and 69.8% within CpG islands, CpG island shores and other regions, respectively. Using the RRBS data, the distribution was 54.3, 21.8, 20.9 and 3.0% within promoters, exons, introns and intergenic regions, respectively, and 83.8, 8.1 and 8.1% within CpG islands, CpG island shores and other regions, respectively (Supplementary Figure 1B). Comparing the human and rat genomes and using WGBS data, the respective distribution within promoter, exon, intron and intergenic regions was 14.4, 42.7, 32.1 and 10.8%, and 20.4, 14.3 and 65.3% for CpG islands, CpG island shores and other regions. Using the RRBS data, the distribution was respectively 51.8, 23.5, 21.1 and 3.6% for promoter, exon, intron and intergenic regions and 78.8, 10.4 and 10.8% for CpG islands, CpG island shores and other regions (Supplementary Figure 1B). Comparing human and mini-pig genomes using the RRBS data, the distribution was respectively 50.0, 22.2, 23.8 and 4.0% within promoters, exons, introns and intergenic regions, and 84.8, 6.4 and 8.8% within CpG islands, CpG island shores and other regions (Supplementary Figure 1B). Thus our analysis showed a trend for a higher CpG density in promoter and CpG islands when using RRBS compared with WGBS data.
Multidimensional scaling analysis of methylation levels for orthologous CpGs in humans, mice, rats and mini-pigs showed a very distinct separation of data (B). While we found no significant differences between species in CpG methylation across the entire genomes (Scheirer–Ray–Hare test, pgroups = 0.26 and 0.31 based on WGBS and RRBS data sets, respectively), differences were highly significant for specific regions (Scheirer–Ray–Hare test, pregion = 1.06E-89 and 1.86E-24 based on WGBS and RRBS data sets, respectively). Most genomic regions displayed different DNA methylation levels, according to the Dunn test for pairwise comparisons (). Based on both WGBS and RRBS data sets and across species, we found that the annotation with the highest methylation levels were the exons, particularly the exons beyond the first exons (annotated ‘Rest of exons’ in C & D). On the other side of the spectrum, promoter regions exhibited the lowest methylation levels at orthologous CpGs (C & D).
Table 1. Dunn post hoc test comparison of methylation levels in different genomic regions.
Human and mouse orthologous CpG sites identified in WGBS data were found in 13,134 genes, 4839 promoters, 15,147 exons and 10,769 introns. From these CpG sites, we found sites in common with the RRBS data for 6778 genes, 2207 promoters, 3575 exons and 2337 introns (Fisher’s exact test, all p < 0.05) (E). When analyzing human and rat orthologous CpG sites based on the WGBS data, we found orthologous CpG sites in 7844 genes with 2224 promoters, 7052 exons and 4679 introns, of which we found sites in common within the RRBS data for 3214 genes, 773 promoters, 1439 exons and 970 introns (Fisher’s exact test, all p < 0.05) (F). Human and mini-pig orthologous CpG sites identified in RRBS data were found in 16,028 genes, 14,513 promoters, 12,872 exons and 10,497 introns.
Using WGBS data for each genomic region of interest, the DNA methylation patterns had a bimodal distribution, with important densities of hypermethylated or hypomethylated regions but a low density of intermediate methylation levels in both human–mouse (G) and human–rat (H) comparisons. For each annotation, the bimodal distribution was differently balanced between hypermethylation and hypomethylation: while introns and exons showed a comparable bimodal DNA methylation pattern with a higher density of hypermethylation, in promoters, CpG sites were largely unmethylated (G & H). For each annotation, the methylation density of orthologous CpG methylation showed significant hypomethylation in humans compared with both mice and rats (all p < 0.001). Methylation patterns of all genes/cytosine sites across the different species comparisons and gene bodies in different CpG island regions confirmed that methylation levels within CpG islands are lower compared with CpG island shores (all p < 0.0001) (Supplementary Figure 2).
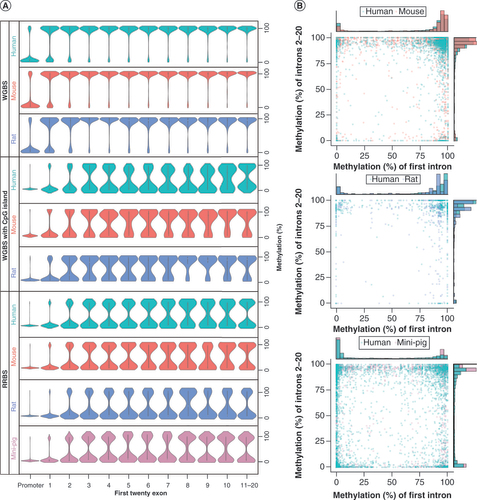
We next aimed to study the distribution of DNA methylation across gene bodies. As the density of exons and introns containing orthologous CpGs decreased within a gene as the ordinal positions of the exons or introns increased, we opted to compare the methylation levels at promoter regions versus the first 20 exons/introns (Supplementary Figure 3). We observed that the methylation levels of promoters were lower than those of the first 20 exons (all p < 0.0001) (A). We found that exons/introns at different ordinal positions have different methylation levels, with the first exon’s methylation levels being lower than those of the remaining exons in all species (all p < 0.0001) (A). Likewise, the first introns had lower levels of methylation than the other introns (all p < 0.0001) (B).
(A) Violin plots of methylation levels (%) of promoters and the first 20 ordinal positions of exons for the human, mouse, rat and mini-pig groups. (B) Scatter plots with marginal histograms of methylation levels (%) of the first 20 ordinal positions of introns for human–mouse and human–rat WGBS data sets and human–mini-pig RRBS data set.
RRBS: Reduced-representation bisulfite sequencing; WGBS: Whole-genome bisulfite sequencing.
Differential methylation identifies pathways related to the function of the central nervous system
We next aimed to identify differential DNA methylation for the genomic regions carrying the orthologous CpG sites characterized above. We focused on regions with methylation differences higher than 20% across all comparisons, because we found that most methylation differences were between 0 and 20% in all species (Supplementary Figure 4). The detailed information regarding the DMPs, DMEs and DMIs is listed in Supplementary Tables 3–7.
Comparing humans and mice using WGBS and RRBS, we identified, respectively, 558 and 195 DMPs, 1769 and 578 DMEs, and 1602 and 266 DMIs. We found that the numbers of genes in common between DMPs, DMEs and DMIs were 51 and 18 using WGBS and RRBS, respectively (Fisher’s exact test; all p < 0.05) (A). Methylation differences within promoters, exons and introns were similar using WGBS and RRBS data sets, which supports that these two techniques are analogous to detect DNA methylation differences (B). Accordingly, our results revealed a good relationship in DNA methylation differences from the same DMRs (Pearson’s r = 0.87) between WGBS and RRBS (C). To get insight into the functional consequence of species-specific methylation at conserved regions, we analyzed the GO:BP networks of the genes with proximity to the DMRs that we identified. We found that DMRs were concentrated within 20 and ten GO:BP groups based on the WGBS and RRBS data sets, respectively (D & E & Supplementary Tables 8 & 9). A substantial number of GO:BP terms relating to the central nervous system were shared between the data sets, including ‘chemical synaptic transmission’ and ‘nervous system development’.
(A) Venn diagrams of all DMPs, DMEs and DMIs for human–mouse. (B) Box plots of methylation differences (%) for DMPs, DMEs and DMIs for human–mouse. Note: Methylation difference (%) describes the variation in methylation levels between the groups (e.g., human–mouse). The width of the box plots indicates the proportion to the square root of the number of observations. (C) Correlation plot of methylation differences (%) of differently methylated regions (DMRs) among WGBS and RRBS data sets for human–mouse. (D & E) Functionally grouped network of enriched categories using all DMRs for human–mouse using (D) WGBS and (E) RRBS data sets. Gene ontology terms are displayed as nodes, and the node size indicates the term enrichment significance. The most significant terms are shown. (F–J) The same structure for the human–rat data set. (K) Venn diagrams of all DMPs, DMEs and DMIs for the human–mini-pig RRBS data set. (L) Functionally grouped network of enriched categories using all DMRs for the human–mini-pig RRBS data set.
DME: Differentially methylated exon; DMI: Ddifferentially methylated intron; DMP: Differentially methylated promoter; RRBS: Reduced-representation bisulfite sequencing; WGBS: Whole-genome bisulfite sequencing.
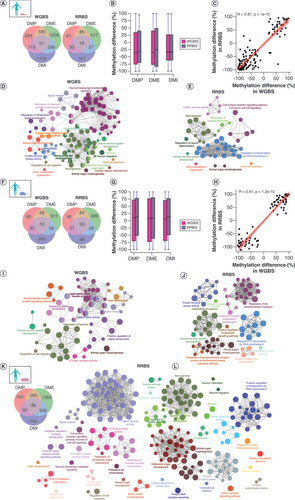
Comparing humans and rats, we identified 184 and 163 DMPs, 643 and 419 DMEs, and 398 and 175 DMIs using WGBS and RRBS, respectively. We identified 15 and 20 common genes related to DMPs, DMEs and DMIs (Fisher’s exact test; all p < 0.05) (F). Similar to the human–mouse comparison, methylation differences within promoters, exons and introns showed a similar distribution using the WGBS and RRBS data sets (G). Here also, methylation differences of DMRs identified in the WGBS and RRBS data sets were highly correlated (Pearson’s r = 0.91) (H). The biological process network of all identified DMRs mainly consisted of 12 groups based on both WGBS and RRBS data sets (I & J & Supplementary Tables 10 & 11). As in the human–rat comparison, many of the biological processes shared were related to the central nervous system, including ‘neurogenesis’ and ‘modulation of chemical synaptic transmission’. Comparing human and mini-pig RRBS data, we identified 609 DMPs, 2223 DMEs and 1460 DMIs, of which 96 were common (Fisher’s exact test; p < 0.05) (K). DMRs were enriched in 40 GO:BP groups, several of which were related to signal transduction and central nervous system development (L & Supplementary Table 12), similar to human and rodent comparisons. We identified some specific terms including ‘regulation of hair follicle development’, ‘sensory perception of sound’, ‘eye development’ and ‘ear morphogenesis’ (L & Supplementary Table 12).
Biological enrichment of DMP & DME1-related genes in human–mouse comparison
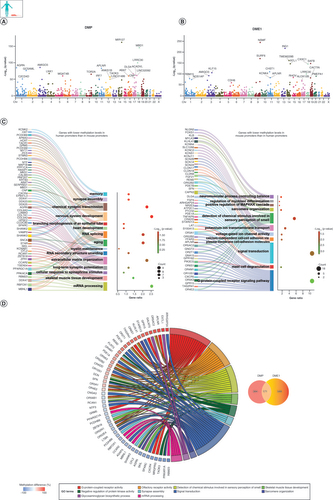
Our analysis of WGBS data from human and mouse sperm identified the promoters of MIR127 (Q-value: 1.6 × 10-162; methylation difference: - 93%), MBD1 (Q-value: 2.3 × 10-146; methylation difference: - 92%), LRRC30 (Q-value: 8.6 × 10-101; methylation difference: - 97%) and AMIGO3 (Q-value: 1.3 × 10-86; methylation difference: - 89%) as the most differentially methylated between species. The genes AMIGO3 and LRRC30 were common between the most DMPs and first exon (A & B). GO enrichment analysis of the promoters harboring lower methylation in humans compared with mice returned terms related to muscle development, RNA processing and the development and function of the nervous system, while the DMPs with lower methylation levels in mice than in humans were largely related to genes controlling muscle function, intracellular signaling pathways and the perception of smell (C & Supplementary Table 13). To get further insight into the cell functions possibly affected by distinct epigenetic signatures in different species, we plotted links between the genes nearest to the DMRs common to DMPs and DME1 and their corresponding GO terms. Out of the 171 DMRs common to DMPs and DME1, we noticed an important fraction of DMRs near genes related to signal transduction (35 genes) and linked to significant GO terms like ‘olfactory receptor activity’ (GO: 0004984) and ‘detection of chemical stimulus involved in sensory perception of smell’ (GO: 0050911), while four DMRs were near genes linked to GO terms related to neuronal function (e.g., ‘synapse assembly’ [GO: 0007416]) (D). Thus, our analysis supports that regions carrying orthologous CpG sites have distinct epigenetic patterns in human and mouse.
(A & B) Manhattan plot representing the top 20 (A) DMPs and (B) DME_1s for all the chromosomes. The red line represents the significant level of Q-value < 0.05. (C) Sankey plots of significantly enriched terms using DMPs. (D) Circos plot of relationships between DMP/DME_1 common genes and significant gene ontology terms. Note: Methylation difference (%) refers to the average methylation difference in differentially methylated regions common to DMP and DME_1.
DME_1: Differentially methylated exon 1; DMP: Differentially methylated promoter.
Mapping of HMRs in sperm
Taking advantage of the higher resolution provided by WGBS compared with RRBS, we used a hidden Markov model approach to identify HMRs in each species individually. We identified 89,761, 72,917 and 73,185 HMRs with an average size of 2.4, 1.8 and 1.3 kbp for humans, mice and rats, respectively (Supplementary Table 14). Promoters were overlapping more with the HMRs compared with exons and introns, and the density of HMRs decreased toward the 3′ end of the genes (Supplementary Figure 5 & Supplementary Table 15).
We next aimed to study the cross-species differences in the size of HMRs that overlapped with the identified DMPs in the human–mouse comparison. Our results showed that species have distinct HMR boundaries. HMRs that overlapped with the promoters of genes harboring lower methylation in humans compared with mice covered a larger region in humans than in rodents. Five genes showed methylation gain (loss of HMRs) in rodents (Supplementary Figure 6A). Conversely, the promoters of genes with lower methylation levels in mice than in humans largely corresponded to lost HMRs in humans (i.e., HMR gain in rodents) (Supplementary Figure 6B). Thus, our analysis reveals a general evolutionary extension of the HMR sizes in humans compared with rodents for the genes with lower methylation levels in human promoters than in mouse promoters (Supplementary Figure 6C). HMR gain in rodents occurred more frequently in the genes with lower methylation levels in mice than in humans, and the HMRs were not significantly larger in size for these genes in rodents (Supplementary Figure 6D).
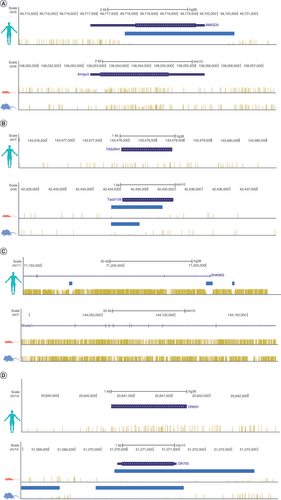
Four examples of methylation levels and identified HMRs across the AMIGO3, TAS2R41, SHANK2 and OR6S1 genes in humans and their orthologs in rodents are shown in . AMIGO3, identified as a common gene between the top 20 DMP and DME1 genes (A & B) is a gene well characterized for its role in brain development [Citation55]. AMIGO3 overlapped with an HMR in humans (light blue line) but had a hypermethylated pattern in mice and rats (A). We identified TAS2R41, a gene that encodes a bitter taste receptor, as linked to G-protein-coupled receptor (GPCR) activity and as harboring both DMP and DME1 (D). In contrast to AMIGO3, TAS2R41 harbors a hypomethylated promoter and exon in mice and rats, and a hypermethylated promoter and exon in humans (B). SHANK2, which was found in three GO terms – ‘memory’, ‘synapse assembly’ and ‘long-term synaptic potentiation’ (C–D) – contains an HMR at the start of the gene in humans, but hypermethylated regions in mice and rats (C). OR6S1, which showed a higher methylation level in humans than in mice and was involved in three significant GO terms – ‘G-protein-coupled receptor activity’, ‘olfactory receptor activity’ and ‘detection of chemical stimulus involved in sensory perception of smell’ (C & D) – contains an HMR in mice and rats but is mostly hypermethylated in the same regions in humans (D).
(A) AMIGO3, a gene well characterized for its role in brain development, overlaps with an HMR in humans but has a hypermethylated pattern in mice and rats. (B)TAS2R41 harbors a hypomethylated promoter and exon in mice and rats, and a hypermethylated promoter and exon in humans. TAS2R41 encodes a bitter taste receptor, as linked to G-protein-coupled receptor activity and as harboring both a differentially methylated promoter and differentially methylated first exon. (C)SHANK2 contains an HMR at the promoter, first exon and part of the first intron in humans, but hypermethylated regions in mice and rats. SHANK2 was found in three gene ontology terms: memory, synapse assembly and long-term synaptic potentiation. (D)OR6S1 has a hypomethylated structure in mice and rats but is mainly hypermethylated in humans. OR6S1 was involved in three significant gene ontology terms: G-protein-coupled receptor activity, olfactory receptor activity and detection of chemical stimulus involved in sensory perception of smell. Blue bars: HMRs. Note: The methylation data of rat were converted to the corresponding locations in the mouse genome using the LiftOver tool.
HMR: Hypomethylated region.
Gene expression in the early embryo is moderately associated with DNA methylation in sperm
Given that methylation of promoters controls gene expression programming [Citation56], we investigated whether the DMPs that we identified in spermatozoa are linked to the expression levels of their nearest genes in early embryos. We studied the expression of genes near human–mouse DMPs in the oocyte and eight-cell stages in humans and in the oocyte and two-cell stages in mice. We used the OrthoFinder program to identify orthologous gene groups in the human and mouse genomes. OrthoFinder returned 16,552 orthologs with one or more genes in mouse and human, of which 14,045 were one-to-one (∼85%). OrthoFinder found only 355 and 270 unique genes in human and mouse, respectively (Supplementary Table 16). Out of 30 genes upregulated by ZGA in humans at the eight-cell stage and with lower methylation levels in humans compared with mice, 19 were similarly upregulated in mice by ZGA at the two-cell stage. Of these genes, eight did not show a significant pattern in mouse by ZGA, and three were significantly downregulated between the oocyte and two-cell stages in mice, showing an expression pattern loaded from the maternal side (A & ). Out of 15 genes with lower methylation levels in mice compared with humans, 12 were upregulated in mice by ZGA but did not show a significant pattern in humans, and three were similarly upregulated in humans by ZGA (B & ). Promoters of genes with lower methylation levels in mice compared with humans consistently exhibited higher transcription abundance (C), thereby validating our approach.
(A & B) Expression values for the genes with lower methylation levels (A) in human promoters compared with mouse promoters and (B) in mouse promoters compared with human promoters. (C) Violin plots displaying the expression values distribution of the genes in human and mouse oocyte and zygotic genome activation stages. Note: Gene names are based on human gene symbols, and mouse orthologous counterparts are considered.
****p < 0.0001; **p = 0.001–0.01; *p = 0.01–0.05.
TPM: Transcripts per million; ZGA: Zygotic genome activation.
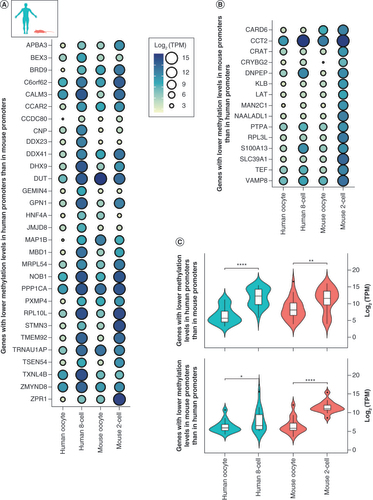
Table 2. Integrative analysis between the early upregulated genes in human and mouse and methylation differences in differentially methylated promoters identified for the human–mouse data set based on the whole-genome bisulfite sequencing approachTable Footnote†.
Discussion
Here we performed an epigenomic comparison of DNA methylation using WGBS and RRBS data from spermatozoa of humans, mice and rats and RRBS data from spermatozoa of mini-pigs. We identified that, while a substantial fraction of epigenome methylation marks are conserved across evolution, some orthologous CpG sites are differentially methylated. Strikingly, the pathways of genes differentially methylated between species were related to distinct functions. Our analysis supports an evolutionary selection of species-specific DNA methylation footprint in orthologous genomic sequences that allows speciation of organ function.
Our study confirmed a bimodal distribution in sperm-cell DNA methylation, consistent with previous reports [Citation23,Citation25]. This bimodal distribution pattern may be responsible for maintaining the basal transcription profile of the preimplantation embryo [Citation57]. Moreover, our study showed that the first exons and first introns had lower levels of methylation than the other exons and introns. This is in accordance with the results of previous findings in pig [Citation58] and fish [Citation59] that reported a lower methylation level on the first exons and introns. Expression levels of the exon gene product are negatively associated with the DNA methylation levels of the first exons [Citation60] and the first introns [Citation59], thus supporting a functional role of sperm DNA methylation on gene expression post-fertilization in the early phase of embryogenesis.
GO terms of orthologous genomic regions found to be differentially methylated when comparing humans with mice, rats and mini-pigs were largely found near genes associated with the development of the central nervous system and signal transduction. Thus genomic regions under epigenetic evolution may be involved in species-specific phenotypic variation, with humans using this means for adapting cognitive function.
We found that promoters with lower methylation in humans compared with rodents are near genes related to the development and function of the nervous system. Conversely, promoters with hypomethylation in rodents compared with humans appeared to be enriched in the proximity of genes related to intracellular signaling and the perception of smell. These results are in line with a study showing that genes with human-specific hypomethylated promoters are related to the development of the central nervous system and enriched for genome-wide association study signals of brain-related traits [Citation23]. In that study, genes with cattle-specific hypomethylated promoters were found to be primarily involved in lipid storage and metabolism [Citation23]. Similarly, a study comparing human and chimpanzee sperm methylomes identified that genes linked to human-specific HMRs are linked to neuronal functions [Citation61]. Previously, we discovered that the differences in DNA methylation in spermatozoa from obese individuals after gastric bypass-induced weight loss are located near genes linked to brain function [Citation62]. Genes referenced as participating in brain function and development appear to carry hot spots of epigenetic variation, as endurance exercise training also altered the DNA methylation signature of human spermatozoa at gene hot spots related to brain function and development [Citation20]. Given that DNA methylation at promoter and CpG-rich regions plays a role in gene repression, our results suggest that promoter hypomethylation in sperm is associated with transcriptional activation of genes after fertilization. A function of DNA methylation in spermatozoa on developmental programming and brain function is further supported by the observation that age-related DNA methylation changes in sperm are passed on to the next generation and contribute to the children of older fathers having an elevated incidence of neuropsychiatric illnesses [Citation63,Citation64]. Thus, we speculate that the hypomethylation of genes controlling the central nervous system in humans contributes to the speciation of brain function in humans compared with rodents.
We identified that genes hypomethylated in rodents are enriched for pathways related to the perception of smell. It was previously posited that genes with promoters that lack HMRs in both human sperm and human embryonic stem cells have a strong enrichment for GPCR and sensory receptors that detect and respond to smell [Citation61]. Odor molecules are detected by olfactory receptors (ORs), which constitute the largest group of GPCR genes. ORs include approximately 350 intact members in humans and approximately 1000 intact members in mice and rats [Citation65]. These genes are largely expressed in sensory neurons found in the main olfactory epithelia of the nasal cavity. The difference in the number of genes between these species appears to be the consequence of both a significant increase in OR genes in the rodent lineage and a large deactivation of OR genes in the human lineage following the primate–rodent divergence [Citation66]. It has been suggested that inactivation of OR genes in higher primates may be the consequence of the development of a full trichromatic vision which aids higher primates in finding food, mates and territory, potentially explaining a decreased need for olfaction [Citation67]. Here we identified TAS2R41, a gene that encodes a bitter taste receptor and which is linked to GPCR activity, which harbors a hypomethylated promoter and exon in mice and rats and a hypermethylated promoter in humans. These findings support that the TAS2R41 gene is selectively silenced in humans, which is in line with previous studies showing a downregulation of taste receptor genes in humans compared with rodents [Citation68,Citation69].
Our results identified a global trend for size extension in HMRs of humans which overlapped with promoters of the genes with lower methylation levels in humans compared with mice. We found rodent-specific HMR gains for genes with lower methylation levels in mice compared with humans. These observations are consistent with a previous study showing that rodent genomes exhibit a stronger tendency toward the birth of novel HMRs, whereas HMR boundaries of promoters have evolved to be significantly longer in primates than in rodents [Citation25].
It is fascinating to hypothesize that HMR size extension in human promoters might be associated with the evolution of new regulatory elements to enhance specificity of the transcriptional regulation of the highly specialized genes involved in the development of the nervous system. A particularly intricate regulation of gene expression is required for the highly specialized functions of neurons [Citation70], which may be accomplished, at least partially, by utilizing the adaptability of transcription factor binding sites. A previous theoretical study on evolution of these sites showed that gain of transcription factor binding sites can be facilitated by the availability of longer regulatory sequences in which the sites can evolve simultaneously and by the biophysical cooperation between transcription factors, which can also match the theoretical time-scale computations derived from comparative genomics [Citation71]. Lineage-specific promoter HMR extensions revealed enhanced RNA polymerase II and EP300 binding sites, and enrichment of numerous transcriptional activators [Citation25].
Our findings that humans and rodents have different types of genes that are hypomethylated supports a mechanism by which orthologous genes are selectively used between species to allow organ specialization. Whether species-specific epigenetic reprogramming of orthologous genes has occurred specifically in response to environmental factors, or may have been selected from stochastic epigenetic variation, remains to be established.
Previous studies suggest that the epigenomic status of embryonic cells and the early activation of developmental genes are influenced by the methylation of germ-cell DNA [Citation72]. Based on our comparison of the gene expression profiles during early embryo development for genes near DMPs, we identified that there are slightly more gene expression differences between the oocyte and eight-cell stages in human than between the oocyte and two-cell stages in mouse when only considering genes that display lower promoter methylation in human compared with mouse. Additionally, as expected, we confirmed that promoters of genes with a lower methylation level in mouse than in human consistently exhibited more gene expression differences between the oocyte and two-cell stages in mouse than between the oocyte and eight-cell stages in human. Together, interspecies differences in gene expression levels during early embryogenesis are modestly associated with promoter DNA methylation profiles in spermatozoa. It is worth mentioning that because the RNA expression and DNA methylation data sets were from independent studies, and therefore distinct tissues or cells, we were unable to make a paired analysis where we could more directly link changes in methylation to changes in gene expression. On the other hand, by using independent samples, our analysis was less affected by internal experimental biases.
Here we found that, when overlapping CpGs annotated by both WGBS and RRBS within gene features, the proportion of cytosines annotated to non-promoter regions decreased, whereas the percentage of cytosines annotated to the promoter section of the genome increased. Additionally, the proportion of cytosines annotated among CpG island shores decreased, whereas the percentage of cytosines annotated within CpG islands increased. This discrepancy in mapping using the two sequencing techniques may be attributed to low coverage of CpGs within CpG-poor regions by the RRBS technique due to the restriction enzyme cut sites used in RRBS. Indeed, RRBS mainly targets promoters and CpG islands because the regions sequenced are flanked by the CCGG sequence, a CG-rich site [Citation73]. It should be noted that the RRBS method superficially covers CpG shores and other intergenic regions and that RRBS data sets have a lower average methylation level compared with that of WGBS data sets, as large stretches of repeated elements in noncoding DNA regions are mainly methylated [Citation74]. Given that the WGBS approach can generate a lot of reads in poorly assembled noncoding DNA regions, this could explain why WGBS data have a lower mapping yield than RRBS data [Citation75]. For instance, even though all CpG sites should, in theory, be covered, some of them have low coverage (one to ten counts) or are not sequenced using the WGBS method [Citation73]. Therefore the average read depth of the RRBS method was greater compared with the WGBS method in our study. Our results highlight the relevance of RRBS as a sequencing method for measuring CpG methylation in comparative studies among species, when sequencing costs, read coverage and the availability of enough methylation information are taken into account.
Conclusion
In conclusion, our detailed comparative analysis identified a divergence in DNA methylation patterns in spermatozoa from rodents, mini-pigs and humans, although the underlying DNA sequence is highly conserved. Our results revealed that the differences in the methylation footprint between human, rodents and mini-pigs are associated with species-specific phenotypic traits. Divergent epigenetic marks on orthologous sequences suggest a mechanism driving phenotypic plasticity and organ speciation, allowing long-term and stable adaptation to the environment.
Future perspective
The growing availability of epigenetic editing techniques may provide a way to test the function of hypomethylated orthologous sequences in sperm on the phenotype of the offspring. Future studies comparing the sperm DNA methylome of additional species will be useful to identify the universal factors driving species adaptation by epigenetic means.
Spermatozoa from rodents and humans have a bimodal distribution of DNA methylation levels.
DNA methylation is generally lower around promoters and first exons and gradually increases toward the 3′ end of the gene.
Human hypomethylated promoters are associated with neurological and brain-related functions, whereas mouse hypomethylated promoters are near genes involved in signal transduction and perception of smell.
Gene expression dynamics at different time points of preimplantation stages are only modestly associated with spermatozoal DNA methylation at the nearest promoters.
Reduced-representation bisulfite sequencing constitutes an effective method for comparative epigenomic analysis of spermatozoa.
Author contributions
R Barrès conceived and designed the study. F Moharrek performed all the bioinformatics and statistical analyses with contributions from C Workman, L Ingerslev, A Altıntaş and L Lundell. A Hansen and L Small contributed to the material preparation. F Moharrek and R Barrès wrote the manuscript. All authors have reviewed and approved the final version of the manuscript.
Ethical conduct of research
For human WGBS data, samples were obtained from men attending the University of Utah Andrology laboratory consented for research (IRB approved protocol # 7790). For mouse WGBS data, the study was done under an approved Institutional Animal Care and Use Committee protocol at University of Utah School of Medicine, USA. For rat WGBS data, part of the study was approved by the Zoos scientific review committee and also by the Institutional Animal Care and Use Committee at University of Southern California, USA. For human RRBS data, the study was approved by the Ethics Committee from the Capital Region of Denmark (reference H-1-2013-064) and informed consent was obtained from all participants. For mouse RRBS data, all procedures followed the guidelines of the National Institutes of Health Guide for the Care and Use of Laboratory Animals and the approval for the study was received from the Institutional Animal Care and Use Committee at University of Massachusetts, Amherst, USA. For rat RRBS data, the study was performed following the National Institutes of Health guidelines for the care and use of laboratory animals and approved by the Institutional Animal Care and Use Committee at The Lundquist Institute for Biomedical Innovation at Harbor–UCLA Medical Center, CA, USA. For mini-pig data, all animal procedures were performed following the National Institutes of Health guidelines for the care and use of laboratory animals at Bionea Lab and approved by the French Ministry of Education and Research (reference APAFIS#22853-201911212455784v1).
Supplemental Figure 1
Download JPEG Image (1.9 MB)
Supplemental Figure 2
Download JPEG Image (689.7 KB)
Supplemental Figure 3
Download JPEG Image (364.6 KB)
Supplemental Figure 4
Download JPEG Image (256.7 KB)
Supplemental Figure 5
Download JPEG Image (653 KB)
Supplemental Figure 6
Download JPEG Image (954.7 KB)
Supplemental information 7
Download MS Excel (2.4 MB)Acknowledgments
The authors acknowledge the Single-Cell Omics platform at the Centre for Basic Metabolic Research (CBMR) for the technical expertise and support, and also thank X Wang for his constructive feedback on statistical matters.
Supplementary data
To view the supplementary data that accompany this paper please visit the journal website at: www.tandfonline.com/doi/suppl/10.2217/epi-2022-0168
Financial & competing interests disclosure
This research was funded by a Challenge Programme Grant from the Novo Nordisk Foundation under grant agreement NNF18OC0033754. The Novo Nordisk Foundation Center for Basic Metabolic Research is an independent research center at the University of Copenhagen, partially funded by an unrestricted donation from the Novo Nordisk Foundation (NNF18CC0034900). The authors have no other relevant affiliations or financial involvement with any organization or entity with a financial interest in or financial conflict with the subject matter or materials discussed in the manuscript apart from those disclosed.
No writing assistance was utilized in the production of this manuscript.
Additional information
Funding
References
- Chan SW-L , HendersonIR , JacobsenSE. Gardening the genome: DNA methylation in Arabidopsis thaliana. Nat. Rev. Genet.6(5), 351–360 (2005).
- Law JA , JacobsenSE. Establishing, maintaining and modifying DNA methylation patterns in plants and animals. Nat. Rev. Genet.11(3), 204–220 (2010).
- Deaton AM , BirdA. CpG islands and the regulation of transcription. Genes Dev.25(10), 1010–1022 (2011).
- Li E , BeardC , JaenischR. Role for DNA methylation in genomic imprinting. Nature366(6453), 362–365 (1993).
- Boumil RM , LeeJT. Forty years of decoding the silence in X-chromosome inactivation. Hum. Mol. Genet.10(20), 2225–2232 (2001).
- Smith SS , CrocittoL. DNA methylation in eukaryotic chromosome stability revisited: DNA methyltransferase in the management of DNA conformation space. Mol. Carcinog.26(1), 1–9 (1999).
- Slotkin RK , MartienssenR. Transposable elements and the epigenetic regulation of the genome. Nat. Rev. Genet.8(4), 272–285 (2007).
- Zemach A , McDanielIE , SilvaP , ZilbermanD. Genome-wide evolutionary analysis of eukaryotic DNA methylation. Science328(5980), 916–919 (2010).
- Voisin S , JacquesM , LandenSet al. Meta-analysis of genome-wide DNA methylation and integrative omics of age in human skeletal muscle. J. Cachexia Sarcopenia Muscle12(4), 1064–1078 (2021).
- Gonzalo S . Epigenetic alterations in aging. J. Appl. Physiol.109(2), 586–597 (2010).
- Stewart KR , VeselovskaL , KelseyG. Establishment and functions of DNA methylation in the germline. Epigenomics8(10), 1399–1413 (2016).
- Wang Y-P , LeiQY. Metabolic recoding of epigenetics in cancer. Cancer Commun.38(1), 25 (2018).
- Gluck C , QiuC , HanSYet al. Kidney cytosine methylation changes improve renal function decline estimation in patients with diabetic kidney disease. Nat. Commun.10(1), 2461 (2019).
- Simar D , VersteyheS , DonkinIet al. DNA methylation is altered in B and NK lymphocytes in obese and type 2 diabetic human. Metabolism63(9), 1188–1197 (2014).
- de Castro Barbosa T , IngerslevLR , AlmPSet al. High-fat diet reprograms the epigenome of rat spermatozoa and transgenerationally affects metabolism of the offspring. Mol. Metab.5(3), 184–197 (2016).
- Dean W , SantosF , StojkovicMet al. Conservation of methylation reprogramming in mammalian development: aberrant reprogramming in cloned embryos. Proc. Natl Acad. Sci. USA98(24), 13734–13738 (2001).
- Fulka H , MrazekM , TeplaO , FulkaJ. DNA methylation pattern in human zygotes and developing embryos. Reproduction128(6), 703–708 (2004).
- Steele W , AllegrucciC , SinghRet al. Human embryonic stem cell methyl cycle enzyme expression: modelling epigenetic programming in assisted reproduction? Reprod. Biomed. Online 10(6), 755–766 (2005).
- Marques CJ , FranciscoT , SousaS , CarvalhoF , BarrosA , SousaM. Methylation defects of imprinted genes in human testicular spermatozoa. Fertil. Steril.94(2), 585–594 (2010).
- Ingerslev LR , DonkinI , FabreOet al. Endurance training remodels sperm-borne small RNA expression and methylation at neurological gene hotspots. Clin. Epigenetics10(1), 12 (2018).
- Carone BR , FauquierL , HabibNet al. Paternally induced transgenerational environmental reprogramming of metabolic gene expression in mammals. Cell143(7), 1084–1096 (2010).
- Liu Y , ChenS , PangDet al. Effects of paternal exposure to cigarette smoke on sperm DNA methylation and long-term metabolic syndrome in offspring. Epigenetics Chromatin15(1), 3 (2022).
- Fang L , ZhouY , LiuSet al. Comparative analyses of sperm DNA methylomes among human, mouse and cattle provide insights into epigenomic evolution and complex traits. Epigenetics14(3), 260–276 (2019).
- Zhou J , SearsRL , XingXet al. Tissue-specific DNA methylation is conserved across human, mouse, and rat, and driven by primary sequence conservation. BMC Genet.18(1), 724 (2017).
- Qu J , HodgesE , MolaroAet al. Evolutionary expansion of DNA hypomethylation in the mammalian germline genome. Genome Res.28(2), 145–158 (2018).
- Hammoud SS , LowDH , YiC , CarrellDT , GuccioneE , CairnsBR. Chromatin and transcription transitions of mammalian adult germline stem cells and spermatogenesis. Cell Stem Cell15(2), 239–253 (2014).
- Oluwayiose OA , MarchoC , WuHet al. Paternal preconception phthalate exposure alters sperm methylome and embryonic programming. Environ. Int.155, 106693 (2021).
- Altıntaş A , LiuJ , FabreOet al. Perinatal exposure to nicotine alters spermatozoal DNA methylation near genes controlling nicotine action. FASEB J.35(7), e21702 (2021).
- Ewels P , MagnussonM , LundinS , KällerM. MultiQC: summarize analysis results for multiple tools and samples in a single report. Bioinformatics32(19), 3047–3048 (2016).
- Krueger F , AndrewsSR. Bismark: a flexible aligner and methylation caller for bisulfite-seq applications. Bioinformatics27(11), 1571–1572 (2011).
- Bock C . Analysing and interpreting DNA methylation data. Nat. Rev. Genet.13(10), 705–719 (2012).
- Sherry ST . dbSNP: the NCBI database of genetic variation. Nucleic Acids Res.29(1), 308–311 (2001).
- Navarro Gonzalez J , ZweigAS , SpeirMLet al. The UCSC genome browser database: 2021 update. Nucleic Acids Res.49(D1), D1046–D1057 (2021).
- Blake LE , RouxJ , Hernando-HerraezIet al. A comparison of gene expression and DNA methylation patterns across tissues and species. Genome Res.30(2), 250–262 (2020).
- Akalin A , FrankeV , VlahovičekK , MasonSE , SchübelerD. Genomation: a toolkit to summarize, annotate and visualize genomic intervals. Bioinformatics31(7), 1127–1129 (2015).
- Chen H , BoutrosP. VennDiagram: a package for the generation of highly customizable Venn and Euler diagrams in R. BMC Bioinform.12(1), 35 (2011).
- Bowman AW , AzzaliniA. ‘sm’: nonparametric smoothing methods. R package version 2.2-5.7 (2018). https://cran.r-project.org/web/packages/sm/sm.pdf
- Wang X , HaoD , KadarmideenHN. GeneDMRs: an R package for gene-based differentially methylated regions analysis. J. Comput. Biol.28(3), 304–316 (2021).
- Benjamini Y , HochbergY. Controlling the false discovery rate: a practical and powerful approach to multiple testing. J. R. Stat. Soc. Ser. B Methodol.57(1), 289–300 (1995).
- Bindea G , MlecnikB , HacklHet al. ClueGO: a Cytoscape plug-in to decipher functionally grouped gene ontology and pathway annotation networks. Bioinformatics25(8), 1091–1093 (2009).
- Sherman BT , HaoM , QiuJet al. DAVID: a web server for functional enrichment analysis and functional annotation of gene lists (2021 update). Nucleic Acids Res.50(W1), W216–W221 (2022).
- Allaire JJ , GandrudC , RussellK , YetmanCJ. Package networkD3. D3 JavaScript network graphs from R. R package version 0.4 (2017). https://cran.r-project.org/web/packages/networkD3/networkD3.pdf
- Walter W , Sánchez-CaboF , RicoteM. GOplot: an R package for visually combining expression data with functional analysis. Bioinformatics31(17), 2912–2914 (2015).
- Fang F , HodgesE , MolaroA , DeanM , HannonGJ , SmithAD. Genomic landscape of human allele-specific DNA methylation. Proc. Natl Acad. Sci. USA109(19), 7332–7337 (2012).
- Song Q , DecatoB , HongEEet al. A reference methylome database and analysis pipeline to facilitate integrative and comparative epigenomics. PLOS ONE8(12), e81148 (2013).
- Bouniol C , NguyenE , DebeyP. Endogenous transcription occurs at the 1-cell stage in the mouse embryo. Exp. Cell Res.218(1), 57–62 (1995).
- Madissoon E , TohonenV , VesterlundLet al. Differences in gene expression between mouse and human for dynamically regulated genes in early embryo. PLOS ONE9(8), e102949 (2014).
- Braude P , BoltonV , MooreS. Human gene expression first occurs between the four- and eight-cell stages of preimplantation development. Nature332(6163), 459–461 (1988).
- Zhang P , ZucchelliM , BruceSet al. Transcriptome profiling of human pre-implantation development. PLOS ONE4(11), e7844 (2009).
- Xue Z , HuangK , CaiCet al. Genetic programs in human and mouse early embryos revealed by single-cell RNA sequencing. Nature500(7464), 593–597 (2013).
- Dobin A , DavisCA , SchlesingerFet al. STAR: ultrafast universal RNA-seq aligner. Bioinformatics29(1), 15–21 (2013).
- Liao Y , SmythGK , ShiW. featureCounts: an efficient general purpose program for assigning sequence reads to genomic features. Bioinformatics30(7), 923–930 (2014).
- Robinson MD , McCarthyDJ , SmythGK. edgeR: a Bioconductor package for differential expression analysis of digital gene expression data. Bioinformatics26(1), 139–140 (2010).
- Emms DM , KellyS. OrthoFinder: solving fundamental biases in whole genome comparisons dramatically improves orthogroup inference accuracy. Genome Biol.16(1), 157 (2015).
- Kuja-Panula J , KiiltomäKiM , YamashiroT , RouhiainenA , RauvalaH. AMIGO, a transmembrane protein implicated in axon tract development, defines a novel protein family with leucine-rich repeats. J. Cell Biol.160(6), 963–973 (2003).
- Levine M , TjianR. Transcription regulation and animal diversity. Nature424(6945), 147–151 (2003).
- Cedar H , BergmanY. Programming of DNA methylation patterns. Annu. Rev. Biochem.81(1), 97–117 (2012).
- Wang X , KadarmideenHN. Characterization of global DNA methylation in different gene regions reveals candidate biomarkers in pigs with high and low levels of boar taint. Vet. Sci.7(2), 77 (2020).
- Anastasiadi D , Esteve-CodinaA , PiferrerF. Consistent inverse correlation between DNA methylation of the first intron and gene expression across tissues and species. Epigenetics Chromatin11(1), 37 (2018).
- Chuang T-J , ChenF-C , ChenY-Z. Position-dependent correlations between DNA methylation and the evolutionary rates of mammalian coding exons. Proc. Natl Acad. Sci. USA109(39), 15841–15846 (2012).
- Molaro A , HodgesE , FangFet al. Sperm methylation profiles reveal features of epigenetic inheritance and evolution in primates. Cell146(6), 1029–1041 (2011).
- Donkin I , VersteyheS , IngerslevLRet al. Obesity and bariatric surgery drive epigenetic variation of spermatozoa in humans. Cell Metab.23(2), 369–378 (2016).
- Atsem S , ReichenbachJ , PotabattulaRet al. Paternal age effects on sperm FOXK1 and KCNA7 methylation and transmission into the next generation. Hum. Mol. Genet.25(22), 4996–5005 (2016).
- Jenkins TG , AstonKI , PfluegerC , CairnsBR , CarrellDT. Age-associated sperm DNA methylation alterations: possible implications in offspring disease susceptibility. PLoS Genet.10(7), e1004458 (2014).
- Malnic B , GodfreyPA , BuckLB. The human olfactory receptor gene family. Proc. Natl Acad. Sci. USA101(8), 2584–2589 (2004).
- Young JM , TraskBJ. The sense of smell: Genomics of vertebrate odorant receptors. Hum. Mol. Genet.11(10), 1153–1160 (2002).
- Gilad Y , WiebeV , PrzeworskiM , LancetD , PääboS. Loss of olfactory receptor genes coincides with the acquisition of full trichromatic vision in primates. PLOS Biol.2(1), e5 (2004).
- Wang X , ThomasSD , ZhangJ. Relaxation of selective constraint and loss of function in the evolution of human bitter taste receptor genes. Hum. Mol. Genet.13(21), 2671–2678 (2004).
- Go Y , SattaY , TakenakaO , TakahataN. Lineage-specific loss of function of bitter taste receptor genes in humans and nonhuman primates. Genetics170(1), 313–326 (2005).
- Naro C , CesariE , SetteC. Splicing regulation in brain and testis: common themes for highly specialized organs. Cell Cycle20(5), 480–489 (2021).
- Tuğrul M , PaixãoT , BartonNH , TkačikG. Dynamics of transcription factor binding site evolution. PLOS Genet.11(11), e1005639 (2015).
- Smith ZD , ChanMM , MikkelsenTSet al. A unique regulatory phase of DNA methylation in the early mammalian embryo. Nature484(7394), 339–344 (2012).
- Sun Z , CunninghamJ , SlagerS , KocherJ-P. Base resolution methylome profiling: considerations in platform selection, data preprocessing and analysis. Epigenomics7(5), 813–828 (2015).
- Bird A . DNA methylation patterns and epigenetic memory. Genes Dev.16(1), 6–21 (2002).
- Doherty R , CouldreyC. Exploring genome wide bisulfite sequencing for DNA methylation analysis in livestock: a technical assessment. Front. Genet.5(8), 126 (2014).