
Abstract
Background: Seminoma is a testicular tumor type, routinely diagnosed after orchidectomy. As cfDNA represents a source of minimally invasive seminoma patient management, this study aimed to investigate whether cfDNA methylation of six genes from liquid biopsies, have potential as novel seminoma biomarkers. Materials & methods: cfDNA methylation from liquid biopsies was assessed by pyrosequencing and compared with healthy volunteers’ samples. Results: Detailed analysis revealed specific CpGs as possible seminoma biomarkers, but receiver operating characteristic curve analysis showed modest diagnostic performance. In an analysis of panels of statistically significant CpGs, two DNA methylation panels emerged as potential seminoma screening panels, one in blood CpG8/CpG9/CpG10 (KITLG) and the other in seminal plasma CpG1(MAGEC2)/CpG1(OCT3/4). Conclusion: The presented data promote the development of liquid biopsy epigenetic biomarkers in the screening of seminoma patients.
Plain language summary
Seminoma belongs to testicular cancer, which represents a common malignancy among men of reproductive age. Diagnosis of seminoma is a multistep process that also includes checking tumor biomarkers from blood. However, these biomarkers are not specific for seminoma and to conclude a definite diagnosis of seminoma immunohistochemical analysis is needed, which requires the removal of a whole or partial testicle. Therefore, there is a need for novel, noninvasive biomarkers. cfDNA is the most extensively investigated source of minimally invasive tumor markers. Therefore, this study investigated cfDNA methylation of six genes as potential noninvasive biomarkers for the management of seminoma patients. By examining CpG sites of selected genes by pyrosequencing, the authors detected significant differences. However, receiver operating characteristic curve analysis showed modest results. Therefore, the authors tested possible panels of significantly different CpGs and detected two possible DNA methylation panels for seminoma screening. These findings suggest the further investigation of possible epigenetic biomarkers for seminoma patient management from liquid biopsies.
Tweetable abstract
Novel research of potential epigenetic biomarkers for the management of seminoma patients from liquid biopsies.
Graphical abstract
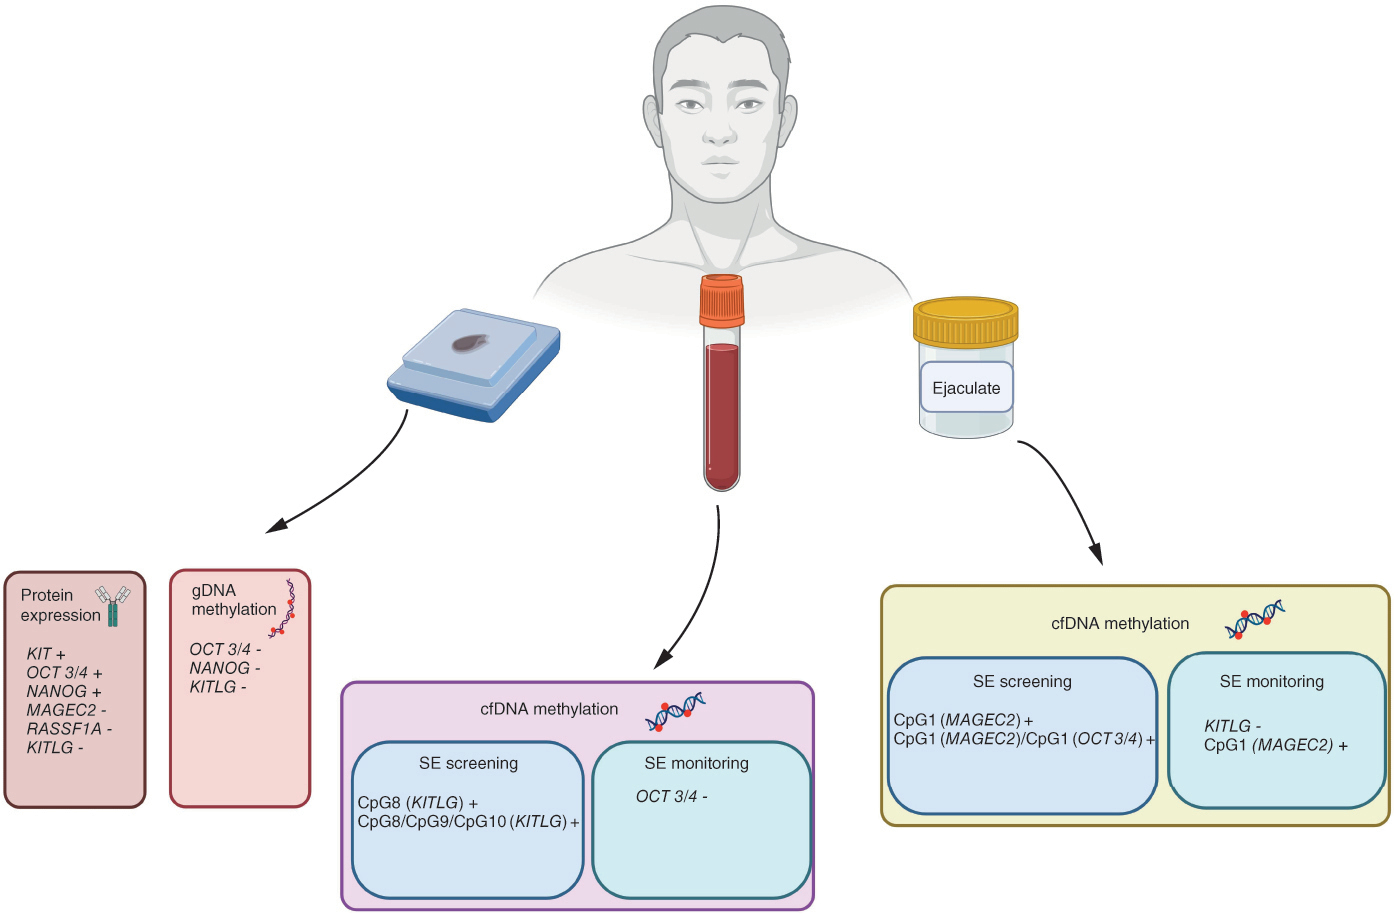
DNA methylation was analyzed in gDNA from tissue and cfDNA from liquid biopsies of seminoma patients. Possible panels for seminoma screening emerged. Created with BioRender.com.
Testicular germ cell tumors (TGCTs) represent the most common malignancy among men of reproductive age [Citation1]. TGCTs are a very heterogenous group divided into seminoma (SE) as the most frequent type and nonseminoma [Citation2]. Along with classical histopathology, immunohistochemistry is the main diagnostic tool in SE patient management [Citation3]. OCT3/4 and KIT are routine biomarkers for identification of the cancer stem cell population [Citation4], with NANOG as an alternative [Citation5]. Normally, OCT3/4 and NANOG are expressed during embryonal development, after which their expression decreases and disappears [Citation6]. KIT interacts with KITLG and they are very important for the cell migration process [Citation7]. MAGEC2 is a part of the MAGEC family and it enables good discrimination between SE and embryonal carcinoma [Citation8]. RASSF1A is a tumor suppressor gene, which aberrant DNA methylation is associated with various tumors [Citation9], as well as with TGCTs, and whose high expression was detected in a premalignant lesion [Citation10]. Aberrant DNA methylation is recognized as a mechanism underlying disrupted gene expression in many tumor tissues, including SE [Citation11]. Indeed, OCT3/4, NANOG, KIT, KITLG, RASSF1A and MAGEC2 are reported as hypomethylated in SE tissue [Citation12]. The connectivity network of selected genes is shown in .
NANOG is a transcription regulator involved in the self-renewal and proliferation of inner cell mass and embryonic stem cells. OCT3/4 encodes for the POUF1 transcription factor, crucial for embryonic stem cell pluripotency and early embryogenesis. Disrupted expression of these two genes is used in the identification of the cancer stem cell population in TGCTs. KIT and KITLG code for the cell-surface receptor and its ligand, respectively. This association is essential for the regulation of cell survival and proliferation, stem cell maintenance, gametogenesis, cell migration and cell function. In response to the binding of KITLG, KIT activates several signaling pathways. These four genes present significant functional connections, unlike MAGEC2 and RASSF1A. Still, MAGEC2 is a cancer/testis antigen (i.e., expression is restricted to male germ cells in the healthy testis and is highly expressed during the early phases of spermatogenesis). Finally, tumor suppressor gene RASSF1A is related to seminoma as well, with disrupted DNA methylation serving as a trigger/driver for tumor development. Each node represents proteins produced by a single protein-coding gene locus. Different-colored lines represent the types of evidence used to identify protein–protein interactions. Yellow: text mining; purple: experimentally determined; black: coexpression; turquoise: from curated databases.
![Figure 1. Predicted network of interactions between proteins encoded by selected genes, by the Search Tool for Retrieval of Interacting Gene/Proteins database (version 11.5) [Citation52]. NANOG is a transcription regulator involved in the self-renewal and proliferation of inner cell mass and embryonic stem cells. OCT3/4 encodes for the POUF1 transcription factor, crucial for embryonic stem cell pluripotency and early embryogenesis. Disrupted expression of these two genes is used in the identification of the cancer stem cell population in TGCTs. KIT and KITLG code for the cell-surface receptor and its ligand, respectively. This association is essential for the regulation of cell survival and proliferation, stem cell maintenance, gametogenesis, cell migration and cell function. In response to the binding of KITLG, KIT activates several signaling pathways. These four genes present significant functional connections, unlike MAGEC2 and RASSF1A. Still, MAGEC2 is a cancer/testis antigen (i.e., expression is restricted to male germ cells in the healthy testis and is highly expressed during the early phases of spermatogenesis). Finally, tumor suppressor gene RASSF1A is related to seminoma as well, with disrupted DNA methylation serving as a trigger/driver for tumor development. Each node represents proteins produced by a single protein-coding gene locus. Different-colored lines represent the types of evidence used to identify protein–protein interactions. Yellow: text mining; purple: experimentally determined; black: coexpression; turquoise: from curated databases.](/cms/asset/87dc03a4-08c1-461b-8da8-4060549e525e/iepi_a_12324395_f0002.jpg)
The majority of reported DNA methylation data were obtained on gDNA from SE tissue, requiring orchidectomy as an invasive procedure. However, analysis of circulating cfDNA from liquid biopsies represents a minimally invasive approach that enables a real-time assessment of a molecular tumor landscape [Citation13]. Blood (plasma and serum) is the most investigated body fluid. It can be used to detect a broad range of molecular changes reflecting tumor presence [Citation14]. Serum markers α-fetoprotein, β-human chorionic gonadotropin and lactate dehydrogenase represent important tools in TGCT patient management. However, in patients with pure SE, these are either slightly elevated or not elevated at all [Citation15,Citation16], making them less valuable in managing SE compared with nonseminoma. Therefore, this investigation was focused on SE with the aim to identify better distinguishing biomarkers with a less invasive liquid biopsy approach. Seminal plasma should, for purely anatomical reasons, reveal information related exclusively to the testis and prostate. Indeed, cfDNA has been demonstrated to be helpful for prostate cancer diagnosis [Citation17]. Accordingly, seminal plasma could represent a valuable source of readily available cfDNA for early screening and monitoring of SE [Citation18].
It has already been reported that gDNA methylation of genes of interest discriminates healthy from SE tissue [Citation19]. This study aimed to investigate whether detected aberrant DNA methylation in SE tissue is reflected in cfDNA methylation in blood and seminal plasma, and if it could be translated to a liquid biopsy SE patient management approach.
Materials & methods
Study population
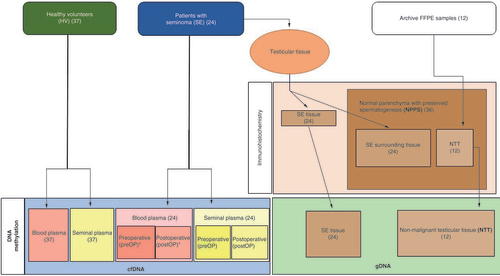
24 SE patients were recruited at two urological centers in Zagreb, the University Hospital Centre Sestre Milosrdnice and the University Hospital Centre Zagreb, after a surgical pathologist concluded the diagnosis of a pure SE. 37 healthy volunteers (HVs) represented the control group for the cfDNA analysis, while for gDNA analysis, nonmalignant (nonmalignant testicular tissue [NTT]) tissue samples from 12 patients were collected from the University Hospital Centre Sestre Milosrdnice paraffin tissue archive.
Ethical statement
Before patients’ admission into the study, information about the study was given to all participants and they signed written consent. The study was conducted according to the Declaration of Helsinki. The Ethics Committee of the School of Medicine University of Zagreb (protocol code 380-59-10106-17-100/187, 641-01/17-02/01), University Hospital Centre Sestre Milosrdnice (protocol code, number: EP-7259/17-9) and University Hospital Centre Zagreb (protocol code 8.1-17/107-2, number: 02/21 AG) approved the collection and manipulation of all tissue samples.
Sample collection
SE tissue samples were collected after radical orchidectomy, performed as a part of routine patient management. Histopathological review of paraffin-embedded archive NTT and SE tissue samples was done by two pathologists. Defined areas were determined for subsequent immunohistochemical analysis and gDNA isolation.
Liquid biopsy samples were organized as shown in . Preoperative samples were taken up to 2 days before the orchidectomy and any chemo- or radio-therapy, while postoperative samples were collected up to 8 days after surgical excision.
DNA methylation of the selected genes was analyzed for cfDNA and gDNA. The expression of the selected genes at the protein level was analyzed on tissue samples. The number of analyzed samples of blood plasma for each gene marked with * is represented in Supplementary Table 1.
12 ml of peripheral venous blood was collected in two 6 ml tubes containing ethylenediaminetetraacetic acid (Greiner Bio-One, NC, USA). To prevent contamination of plasma with other cells, peripheral venous blood was processed by dual centrifugation (1400× g for 10 min and then 4500× g for 10 min). Obtained blood plasma was stored in a vacutainer (Greiner Bio-One, NC, USA) at -80°C.
Ejaculate samples were collected by masturbation after sexual abstinence of 3–5 days. The ejaculate was liquified at room temperature for 30 min. The protocol for ejaculate processing to seminal plasma was obtained from Li et al. [Citation20] with slight modifications: the ejaculate was centrifuged in three steps (400× g for 10 min, 12,000× g for 10 min and 20,000× g for 10 min. Obtained seminal plasma was stored in 1.5 m tubes (Eppendorf, Hamburg, Germany) at -80°C.
Tissue biomarker analysis
Tissue biomarker analysis was performed by immunohistochemistry followed by morphometric analysis. Additional information is shown in Supplementary Table 2. Both were performed as previously reported [Citation10]. All slides were analyzed by two pathologists and any doubt was resolved with the joint committee. During further statistical analysis, normal cells from testicular parenchyma and spermatogenesis were joined into one group called normal parenchyma with preserved spermatogenesis (NPPS).
Isolation of gDNA & cfDNA
After isolating gDNA from SE tissue [Citation21], the authors measured the concentration with a NanoDrop 2000c spectrophotometer. NucleoSnap cfDNA kit for cfDNA from plasma (Machery-Nagel, Düren, Germany) was used for the isolation of cfDNA from liquid biopsies, as well as a vacuum pump (Qiagen, Hilden, Germany) [Citation17]. Elution of cfDNA was done by 100 μl of elution buffer into 1.5 m DNA low bind tubes (Eppendorf, Hamburg, Germany). Quant-iT™ PicoGreen® dsDNA detection kit (Thermo Fisher Scientific, MA, USA) was used to quantify cfDNA. The intensity of fluorescence was measured on a spectrofluorometer (Tecan, Männedorf, Switzerland).
DNA methylation analysis
DNA was subjected to bisulfite conversion by EpiTect Bisulfite Kit (Qiagen, Hilden,Germany). Bisulfite-converted DNA was further amplified by PyroMark PCR Kit (200; Qiagen, Hilden, Germany) using previously reported or newly designed primers (PyroMark assay design software; Supplementary Table 3). Sequencing was performed by the PyroMark Q24 system using PyroMark Q24 advanced CpG reagents (4 × 24; Qiagen, Hilden, Germany).
Statistical analysis
Immunohistochemistry results were analyzed using the Mann–Whitney test with Bonferroni correction and Kruska–Wallis with Dunn’s multiple comparisons statistical tests with two-tailed p-value reported. Raw CpG methylation levels were normalized by performing log2 transformation of the ratio of methylated and unmethylated probes [Citation17]. Before assessing differences in DNA methylation between CpG groups of six preselected genes, the Fligner–Killeen test was used to test the homogeneity of variances between the samples as one of the assumptions of nonparametric tests. Comparison of DNA methylation levels between unpaired and paired data was performed by Wilcoxon rank-sum (Mann–Whitney U) test and Wilcoxon signed-rank test. Receiver operating characteristic (ROC) curves on raw data for individual genes and combinations of multiple genes were evaluated. The optimal balance of sensitivity and specificity for each ROC curve per gene or gene panel was obtained by calculating Youden index (J). Logistic regression was performed to investigate the impact of combinations of individual CpGs on the discriminatory power of methylation levels between control/preOP and preOP/postOP samples. Evaluation measurements, such as the area under the curve (AUC), sensitivity and specificity, were computed for each significant CpG site. Spearman’s rank correlation coefficient was used to evaluate the association between DNA methylation levels in SE tissue, preoperative and postoperative blood and ejaculative samples with a two-tailed p-value reported. All statistical analyses were performed in R, except the Kruskal–Wallis test, which was performed in GraphPad Prism 9 (GraphPad Software). All p-values were considered significant if <0.05. To analyze the difference between healthy volunteers’ and patients’ ages, the Mann–Whitney test was used. The stratification method was used to analyze confounding effects.
Results
Clinicopathological data
Clinicopathological and demographic data are shown in Supplementary Table 4. The cohort considered 24 SE patients, the majority being stage I (71%). Between SE patients (median age: 35) and healthy volunteers (median age: 26), a significant age difference was detected (p < 0.001). Furthermore, the correlation detected between the patient’s age and methylation level was low (Supplementary Table 5). Regarding demographic data, associations between smoking and alcohol consumption were found for certain CpGs of selected genes (Supplementary Table 5).
Tissue biomarker expression
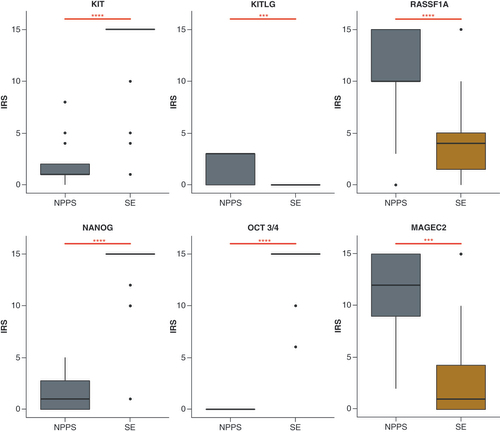
KIT, NANOG and OCT3/4 were highly expressed in SE, while MAGEC2, RASSF1A and KITLG showed higher expression in NPPS ().
Statistically significant differences between groups are indicated as *p < 0.05; **p < 0.01; ***p < 0.001 and ****p < 0.0001.
DNA methylation analysis in tissue & liquid biopsies
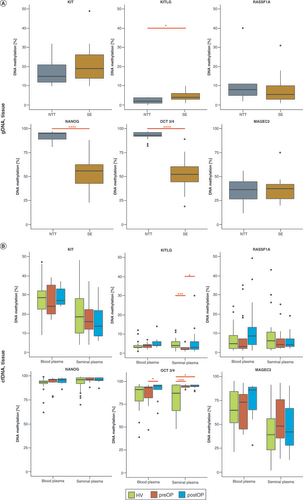
Considering gDNA methylation data, OCT3/4 and NANOG were significantly hypermethylated in NTT and KITLG in SE. Other genes showed similar gDNA methylation levels in NTT and SE tissue (). Regarding blood, cfDNA methylation of OCT3/4 differed significantly between preoperative and postoperative samples. cfDNA methylation of other selected genes did not differ significantly (). In seminal plasma, cfDNA methylation of OCT3/4 and KITLG significantly differed between HV and preoperative samples. cfDNA methylation of OCT3/4 was statistically different between HV and postoperative samples. The cfDNA methylation level of KITLG significantly differed between preoperative and postoperative samples ().
(A) gDNA methylation analysis. (B) Methylation analysis of cfDNA from blood and seminal plasma. Black horizontal lines represent the median of a group. A statistically significant difference is indicated as *p < 0.05; **p < 0.0; ***p < 0.001 and ****p < 0.0001.
SE: Seminoma.
DNA methylation level was considered for each CpG site. In blood, KITLG CpG8 significantly differed between HV and preoperative samples, while for OCT3/4 CpG1 significally differed between preoperative and postoperative samples (). In seminal plasma, a significant difference was found between HV and preoperative samples in KITLG CpG1, CpG2, CpG3 and CpG6, as well as in OCT3/4 CpG1 and MAGEC2 CpG1. MAGEC2 CpG1 methylation frequency differed between preoperative and postoperative samples ().
The methylation level of selected genes in (A) blood and (B) seminal plasma are shown. Statistically significant differences between groups are indicated as *p < 0.05; **p < 0.01; ***p < 0.001 and ****p < 0.0001.
Relation of gDNA & cfDNA methylation
A significant (p = 0.036) positive correlation was detected for NANOG () in preoperative versus postoperative blood samples. No significant correlations were detected in the seminal plasma. However, a strong positive correlation trend for KIT and MAGEC2, while negative for OCT3/4 and KITLG, was observed in preoperative versus postoperative seminal plasma samples (). Analyzing the correlation between blood and seminal plasma samples, the authors found a significant (p = 0.015) negative correlation for MAGEC2, while just a trend for KIT and NANOG, all in preoperative blood versus postoperative seminal plasma ().
ROC curve analysis of cfDNA data
Three KITLG CpG sites significantly or indicatively distinguished HV from preoperative samples in blood: CpG8 (75% sensitivity; 79% specificity; AUC: 0.72), CpG9 (62% sensitivity; 79% specificity; AUC: 0.71) and CpG10 (75% sensitivity; 76% specificity; AUC: 0.75; ). In seminal plasma, CpG sites of selected genes showed significance in discriminating HV from preoperative samples. ROC curve analysis of MAGEC2 CpG1 methylation level showed 73% sensitivity and 63% specificity (AUC: 0.7), while for OCT3/4 CpG1 sensitivity was 100% and specificity 55% (AUC: 0.7; ). ROC curve analysis revealed that not all significant CpG sites have good biomarker potential; for example, CpG1–CpG4 and CpG6 of KITLG had either high sensitivity and low specificity or vice versa (AUC < 0.41; data not shown).
Receiver operating characteristic curve with corresponding area under the curve, sensitivity and specificity. In blood plasma, KITLG CpG8, CpG9 and CpG10 discriminate between healthy volunteer and preoperative samples. J(CpG8) = 0.54, J(CpG9) = 0.42 and J(Cpg10) = 0.541. In seminal plasma, MAGEC2 CpG1 and OCT3/4 CpG1 discriminate between healthy volunteer and preoperative samples. For MAGEC2 J(CpG1) = 0.37 and for OCT3/4 J(CpG1) = 0.5.
Possible screening & monitoring cfDNA methylation panels
In blood, a combination of all three significant KITLG CpGs emerged as a putative panel for SE screening, displaying 71% sensitivity with 79% specificity (AUC: 0.72; ). In seminal plasma, a panel comprising MAGEC2 CpG1 and OCT3/4 CpG1 displayed significant sensitivity (87%) with notable specificity (60%; AUC: 0.65), marking them a possible panel for SE screening ().
(A) ROC curve for CpG8/CpG9/CpG10 of KITLG panel across healthy volunteer and preoperative blood samples. (B) ROC curve for CpG1 MAGEC2/CpG1 OCT3/4 panel for discriminating between healthy volunteer and preoperative seminal plasma samples (dark line: ROC curve for CpG8/CpG9/ CpG10 KITLG and CpG1 MAGEC2/CpG1 OCT3/4 panel; light grey dashed line: reference line).
AUC: Area under the curve; ROC: Receiver operating characteristic.
Discussion
In current TGCT patient management, a highly invasive orchidectomy is required promptly after the detection of most testicular pathology [Citation22,Citation23]. The cancer-related serum biomarkers are valuable but limited in their sensitivity and specificity, especially for SE [Citation24], arguing for the development of high-quality, noninvasive SE biomarkers. Cancer cell DNA fragments are present in cfDNA fraction of a liquid biopsy, retaining all features specific for SE. Still, only a few studies are focused on investigating the potential clinical value of liquid biopsy in SE, especially those related to cfDNA methylation [Citation25,Citation26]. Therefore, this study aimed to determine the potential of cfDNA methylation in seminal and blood plasma as a SE liquid biopsy biomarker.
Clinicopathological data
The number of SE samples analyzed in this study could cause possible concern (i.e., could be viewed as low), especially after Medvedev et al. [Citation27] detected the two subtypes of SE. However, the mentioned research did not find any statistically significant difference in DNA methylation on the level of methylation of specific probes (despite the overall, genomewide trend). Furthermore, the Medvedev et al. study was bioinformatic research that performed a statistical analysis of the data from different databases. While presented results are valuable for tumor biology, differences in clinical representations were beyond the scope of the Medvedev et al. study. Also, SE is well known to be a rare tumor, and the included samples represented almost all cases collected over the span of 2 years, in the two largest Croatian urological centers. Similar investigations of novel SE biomarkers have a comparable or even lower number of SE samples [Citation28–30], with only a few containing a greater number of samples collected during a greater period of time or samples collected in several institutions in at least two countries [Citation31,Citation32]. Therefore, the authors are sure that this sample size is both comparable to current, state-of-the-art publications and sufficiently broad-based to include sample profiles with respect to subtypes. The statistically significant difference found between the age of healthy controls and patients could present a possible limitation of the study, since DNA methylation changes are age-related. There was an age-related confounding effect for CpG1 in the MAGEC2 gene in the ejaculate, as well as two other seemingly high effects for CpG8 and CpG4 in the KITLG gene in blood and ejaculate tissues, respectively. However, keep in mind that the authors were unable to compute the risk ratio for each selected stratum of data due to a lack of representative samples (Supplementary File 5). Therefore, there is a reasonable level of certainty that the detected differences in DNA methylation between the two observed groups are SE-specific [Citation33,Citation34]. Furthermore, associations between smoking and alcohol consumption with significant aberrant methylation of KITLG CpGs and MAGEC2 CpGs in liquid biopsies were found, which is in line with already reported investigations [Citation35,Citation36].
Relation of protein expression & gDNA methylation levels in SE
OCT3/4 and NANOG showed high protein expression in combination with gDNA hypomethylation in SE, which was expected, according to previous reports [Citation37,Citation38]. Detection of hypomethylated RASSF1A in SE is in line with other reports as well [Citation39]. The KIT-KITLG pathway is central to TGCT molecular pathology, and KIT is an SE biomarker on the protein level [Citation1]. KITLG was found to be hypermethylated in SE, which is congruent to the absence of its expression in SE. However, no difference in KIT gDNA methylation was found in NTT and SE, despite the significantly higher protein expression in SE. It suggests that the activation of the KIT-KITLG pathway is more influenced by KIT mutations [Citation40] and KITLG SNPs [Citation6]. MAGEC2 was found to be highly expressed in NPPS, again in line with other reports [Citation8]. Still, differential DNA methylation was not detected. This suggests the involvement of other molecular mechanisms in the regulation of MAGEC2 expression.
Reflection of SE gDNA methylation in cfDNA as a potential screening biomarker
Hypomethylated OCT3/4 and NANOG detected in SE tissue were not observed in blood cfDNA. This could be explained by the fact that gDNA methylation data were obtained exclusively from SE tissue, while cfDNA data were obtained by analyzing cfDNA in blood plasma, encompassing cfDNA from healthy cells and not only from SE [Citation23]. OCT3/4 and NANOG are strongly hypermethylated in differentiated cells [Citation41], being embryonal biomarkers; it is plausible that cfDNA from healthy tissue completely overshadowed cfDNA from SE [Citation42]. KITLG gDNA methylation in SE tissue was reflected in blood cfDNA. Still, a statistically significant difference was not detected between HV and preoperative samples. The reduced reflection of KITLG gDNA methylation in cfDNA could be caused by the blood–testis barrier [Citation43], which limits the release of SE cfDNA into the blood. Indeed, the smaller amount of tumor cfDNA released into the bloodstream was detected for various cancers associated with the presence of either a blood–tissue barrier or an organ capsule [Citation42]. Seminal cfDNA methylation of OCT3/4 and KITLG was similar to that found in NTT, which could be due to the larger release of cfDNA from healthy testicular tissue into ejaculate, rather than from SE. However, they could be considered possible SE biomarkers, since they discriminate HV from preoperative samples. Regarding RASSF1A, the obtained results are in accordance with a previous study [Citation26], but a statistically significant difference was not detected, possibly owing to the small sample size here. MAGEC2 and KIT cfDNA methylation did not differ between HV and preoperative blood or ejaculate, meaning they seem not to have strong potential as SE epigenetic biomarkers. DNA methylation analysis of each CpG site revealed three differentially methylated KITLG CpGs in blood as potential SE screening biomarkers. Their characteristic hypermethylation in SE tissue [Citation44] seems to be detectably retained in cfDNA. Analysis of seminal plasma revealed CpG1 in MAGEC2 and four CpGs in KITLG as possible screening biomarkers. These findings confirm that cancer-specific gDNA methylation could remain, at least partially, detectably reflected in cfDNA and consequently studied in epigenetic noninvasive biomarker development.
cfDNA methylation as a surgery follow-up biomarker
For all selected genes, the cfDNA methylation in postoperative samples reached the cfDNA methylation of HV samples. Indeed, after orchidectomy, OCT3/4 in postoperative blood reached the DNA methylation of HV samples. The same was observed for KITLG and MAGEC2 (CpG1) in the postoperative seminal plasma. Based on correlation analysis, after orchidectomy, their methylation pattern was completely contrary to that detected before. This is because cfDNA originates from only healthy cells after orchidectomy, confirming treatment success [Citation44]. Therefore, these genes could be considered potential biomarkers for SE monitoring.
Evaluation of possible screening & monitoring panels
ROC curve analysis of statistically significant or indicative CpGs disclosed varied AUC values (0.4–0.75), limiting their potential as SE biomarkers. To improve diagnostic performance, a panel of CpGs for SE screening and monitoring was designed. The panel of three CpGs, CpG8/CpG9/CpG10 in KITLG, detected in blood showed 79% specificity and 71% sensitivity, while the panel of CpG1 (MAGEC2)/CpG1 (OCT3/4) detected in seminal plasma showed 87% sensitivity and 60% specificity. Due to higher specificity, the panel from blood was considered superior for SE screening. Furthermore, a recent study reported a TGCT diagnostic panel from the blood that displayed a sensitivity of 100% [Citation30]. However, even though in this study the sensitivity was 100%, the usage of serum for cfDNA analyses represents a limitation. During the clotting process of white blood cells in the collection tube, a high concentration of nonspecific gDNA is released and it could camouflage the tumor-specific cfDNA [Citation45]. In the present study, the authors overcame this limitation by using plasma instead. The reported panel combined hypermethylated RASSF1A with the quantification of miR-371a-3p. Indeed, miR-371a-3p alone represents a novel TGCT biomarker that is on the way to being translated into clinical practice. However, it is important to emphasize that miRNA is very sensitive to preanalytical variables [Citation46], which influence the analysis results of the miRNA amount [Citation47]. The levels of miRNAs could be influenced by blood sampling and preparation [Citation48], hemolysis [Citation49], the time in which the samples are processed [Citation31], the number of freeze–thaw cycles [Citation48], the type of sample (serum or plasma) and the isolation technique [Citation50]. Even though the cfDNA also requires careful sampling, processing and analysis [Citation17], DNA methylation represents the most stable and easily detectable chemical change on cfDNA, which is not so sensitive to preanalytical variables [Citation51]. The authors of the present study believe that the detection of aberrant DNA methylation of genes playing a crucial role in TGCT could complement the detection of miR-372-3p and improve their diagnostic performance, as Lobo et al. [Citation30] already implicated.
Study limitations
The results presented in this study should be further tested on a larger cohort. Still, even with a larger sample size, cancer-specific cfDNA methylation could remain camouflaged by cfDNA methylation from healthy cells, as indicated in this study.
Conclusion
The obtained data promote the cfDNA methylation of OCT3/4, KITLG and MAGEC2 as potential noninvasive epigenetic biomarkers in liquid biopsy valuable for SE patient management. Newly designed CpG panels are presented as promising in SE patient screening. Furthermore, blood seems to be a better source of SE biomarkers than ejaculate, based on epigenetic changes detected in cfDNA. The presented data strongly promote the further development of liquid biopsy epigenetic biomarkers in SE patient management. However, TGCTs are a heterogenous group, divided into SE and nonseminoma, the latter consisting of four different histological subtypes. Therefore, to draw conclusions about potential epigenetic biomarkers for SE, cfDNA methylation in nonseminoma patients has to be investigated and compared with the presented data. Regarding confounding variables, despite the fact that some CpG loci showed changes in methylation confounded with the effects of alcohol consumption, smoking and age, we detected a few CpGs (in bld_KITLG and ej_OCT3/4) with high clinical biomarker potential, irrespective of standard confounding variables. This trend is yet to be confirmed in a larger cohort.
Testicular germ cell tumor (TGCT) represents the most prevalent malignancy among the young population of men and seminoma accounts for 60% of TGCTs.
Routine serum biomarkers are used as a help in TGCT diagnosis but they are limited in their sensitivity and specificity, especially for seminoma.
cfDNA represents a molecular biology platform for minimally invasive seminoma diagnosis and monitoring.
This study aimed to investigate the cfDNA methylation of six genes from liquid biopses of seminoma patients and healthy volunteers as potential seminoma biomarkers.
Different DNA methylation was detected in blood as well as in seminal plasma for OCT3/4, KITLG and MAGEC2.
After receiver operating characteristic curve analysis, two potential screening panels emerged, in blood and seminal plasma.
The diagnostic performance of potential panels was better than serum biomarkers.
There is a need to determine clinical value, but the presented data promote the development of liquid biopsy epigenetic biomarkers in the screening of seminoma patients.
Author contributions
N Sincic and AK Bojanac contributed to the conception and design of the study. D Oršolić and A Barešić organized the database and performed the statistical analysis. M Tomić, NN Gabaj, N Gelo and T Kuliš contributed to the methodology. D Raos performed the investigation and formal analysis. D Oršolić, M Ulamec and S Mašić participated in the visualization of the results. M Ulamec, N Sincic, I Tomašković and Ž Kaštelan supervised and administrated the project. D Ježek and N Sincic provided funds and resources for the investigation. D Raos prepared the first draft. D Raos, AK Bojanac, J Krasić, N Sincic and A Barešić reviewed and edited the manuscript. All authors contributed to the manuscript revision and read and approved the submitted version.
Ethical conduct of research
The authors state that they have obtained institutional approval from the Ethics Committee of the School of Medicine, University of Zagreb (protocol code 380-59-10106-17-100/187, 641-01/17-02/01), University Hospital Centre Sestre Milosrdnice (protocol code, number: EP-7259/17-9) and University Hospital Centre Zagreb (protocol code 8.1-17/107-2, number: 02/21 AG). Also, the authors followed the principles outlined in the Declaration of Helsinki for all human or animal experimental investigations. In addition, for investigations involving human subjects, informed consent was obtained from the participants involved.
Supplemental Table 1
Download MS Word (12.7 KB)Supplemental Table 2
Download MS Word (13.9 KB)Supplemental Table 3
Download MS Word (18 KB)Supplemental Table 4
Download MS Word (14.3 KB)Supplemental Table 5
Download PDF (47.3 KB)Acknowledgments
The authors wish to acknowledge and thank Floriana Bulić-Jakuš and Irena Abramović for the great support in laboratory activities and in the process of shaping the manuscript.
Supplementary data
To view the supplementary data that accompany this paper please visit the journal website at: www.tandfonline.com/doi/suppl/10.2217/epi-2022-0331
Financial & competing interests disclosure
This work was financed by the Croatian Science Foundation under the project “Epigenetic biomarkers in the blood and ejaculate of patients with testicular seminoma” (epiSem, IP-2016-06-3692). This publication was supported by the European Union Commission through the European Regional Development Fund, Operational Programme Competitiveness and Cohesion, under grant agreement no. KK.01.1.1.01.0008, and Regenerative and Reproductive Medicine – Exploring New Platforms and Potentials. The authors have no other relevant affiliations or financial involvement with any organization or entity with a financial interest in or financial conflict with the subject matter or materials discussed in the manuscript apart from those disclosed.
No writing assistance was utilized in the production of this manuscript.
Data sharing statement
The raw data supporting the conclusions of this manuscript will be made available by the corresponding author, N Sincic ([email protected]), without undue reservation, to any qualified researcher.
Additional information
Funding
References
- Baroni T , AratoI , MancusoF , CalafioreR , LucaG. On the origin of testicular germ cell tumors: from gonocytes to testicular cancer. Front. Endocrinol.10(6), 1–8 (2019).
- Leão R , AhmadAE , HamiltonRJ. Testicular cancer biomarkers: a role for precision medicine in testicular cancer. Clin. Genitourin. Cancer17(1), 176–183 (2019).
- Van Casteren NJ , DeJong J , StoopHet al. Evaluation of testicular biopsies for carcinoma in situ: immunohistochemistry is mandatory. Int. J Androl.32(6), 666–674 (2009).
- Looijenga LHJ , StoopH , BiermannK. Testicular cancer: biology and biomarkers. Virchows. Arch.464(3), 301–313 (2014).
- Boccellino M , VanacoreD , ZappavignaSet al. Testicular cancer from diagnosis to epigenetic factors. Oncotarget8(61), 104654–104663 (2017).
- Shen H , ShihJ , HollernDPet al. Integrated molecular characterization of testicular germ cell tumors. Cell. Rep.23(11), 3392–3406 (2018).
- Das MK , KleppaL , HaugenTB. Functions of genes related to testicular germ cell tumour development. Andrology7(4), 527–535 (2019).
- Bode PK , BarghornA , FritzscheFRet al. MAGEC2 is a sensitive and novel marker for seminoma: a tissue microarray analysis of 325 testicular germ cell tumors. Mod. Pathol.24(6), 829–835 (2011).
- Raos D , UlamecM , KatusicBojanac A , Bulic-JakusF , JezekD , SincicN. Epigenetically inactivated RASSF1A as a tumor biomarker. Bosn. J. Basic Med. Sci.21(4), 386–397 (2020).
- Raos D , KrasicJ , MasicSet al. In search of TGCT biomarkers: a comprehensive in silico and histopathological analysis. Dis. Markers2020(8841880), 1–18 (2020).
- Lobo J , GillisAJM , JerónimoC , HenriqueR , LooijengaLHJ. Human germ cell tumors are developmental cancers: impact of epigenetics on pathobiology and clinic. Int. J. Mol. Sci.20(2), 1–28 (2019).
- Koul S , MansukhaniM , MurtyVVet al. Characteristic promoter hypermethylation signatures in male germ cell tumors. Mol. Cancer1, 1–9 (2002).
- Poulet G , MassiasJ , TalyV. Liquid biopsy: general concepts. Acta Cytol.63(6), 449–455 (2019).
- Locke WJ , GuanzonD , MaCet al. DNA methylation cancer biomarkers: translation to the clinic. Front. Genet.10(11), 1–22 (2019).
- Dieckmann KP , Simonsen-RichterH , KulejewskiMet al. Serum tumour markers in testicular germ cell tumours: frequencies of elevated levels and extents of marker elevation are significantly associated with clinical parameters and with response to treatment. Biomed. Res. Int.2019(5030349), 1–22 (2019).
- Wei J , YinY , ZhouJet al. METTL3 potentiates resistance to cisplatin through m6A modification of TFAP2C in seminoma. J. Cell. Mol. Med.24(19), 11366–11380 (2020).
- Krasic J , AbramovicI , VrtaricAet al. Impact of preanalytical and analytical methods on cell-free DNA diagnostics. Front. Cell. Dev. Biol.9(686149), 1–17 (2021).
- Abramovic I , VrhovecB , SkaraLet al. mir-182-5p and mir-375-3p have higher performance than PSA in discriminating prostate cancer from benign prostate hyperplasia. Cancers (Basel)13(9), 2068 (2021).
- De la Rosa AH , ManoharanM , GoolamAS. Current concepts of epigenetics in testicular cancer. Indian J. Surg. Oncol.8(2), 169–174 (2017).
- Li HG , HuangSY , ZhouH , LiaoAH , XiongCL. Quick recovery and characterization of cell-free DNA in seminal plasma of normozoospermia and azoospermia: implications for non-invasive genetic utilities. Asian J. Androl.11(6), 703–709 (2009).
- Talukdar FR , AbramovićI , CueninCet al. A protocol for good quality genomic DNA isolation from formalin-fixed paraffin-embedded tissues without using commercial kits. Mol. Biol. Rep.49(5), 4115–4121 (2021).
- Dahl AA , MykletunA , FossåSD. Quality of life in survivors of testicular cancer. Urol. Oncol.23(3), 193–200 (2005).
- Kustanovich A , SchwartzR , PeretzT , GrinshpunA. Life and death of circulating cell-free DNA. Cancer Biol. Ther.20(8), 1057–1067 (2019).
- Ehrlich Y , BeckSDW , FosterRS , BihrleR , EinhornLH. Serum tumor markers in testicular cancer. Urol. Oncol.31(1), 17–23 (2013).
- Kawakami T , OkamotoK , OgawaO , OkadaY. XIST unmethylated DNA fragments in male-derived plasma as a tumour marker for testicular cancer. Lancet363(9402), 40–42 (2004).
- Ellinger J , AlbersP , PeraboFG , MüllerSC , Von RueckerA , BastianPJ. CpG island hypermethylation of cell-free circulating serum DNA in patients with testicular cancer. J. Urol.182(1), 324–329 (2009).
- Medvedev KE , SavelyevaAV , ChenKS , BagrodiaA , JiaL , GrishinNV. Integrated molecular analysis reveals 2 distinct subtypes of pure seminoma of the testis. Cancer Inform.21, 1–15 (2022).
- Hacioglu BM , KodazH , ErdoganBet al. K-RAS and N-RAS mutations in testicular germ cell tumors. Bosn. J. Basic Med. Sci.17(2), 159–163 (2017).
- da Silva Martinelli CM , vanHelvoort Lengert A , CárcanoFMet al. MGMT and CALCA promoter methylation are associated with poor prognosis in testicular germ cell tumor patients. Oncotarget8(31), 50608–50617 (2017).
- Lobo J , Van ZogchelLMJ , NuruMGet al. Combining hypermethylated RASSF1A detection using ddPCR with miR-371a-3p testing: an improved panel of liquid biopsy biomarkers for testicular germ cell tumor patients. Cancers (Basel)13(20), 1–15 (2021).
- Myklebust MP , ThorA , RosenlundBet al. Serum miR371 in testicular germ cell cancer before and after orchiectomy, assessed by digital-droplet PCR in a prospective study. Sci. Rep.11(1), 1–12 (2021).
- Dieckmann KP , RadtkeA , GecziLet al. Serum levels of microRNA-371a-3p (M371 test) as a new biomarker of testicular germ cell tumors: results of a prospective multicentric study. J. Clin. Oncol.37(16), 1412–1423 (2019).
- Galow AM , PelegS. How to slow down the ticking clock: age-associated epigenetic alterations and related interventions to extend life span. Cells11(3), 468 (2022).
- Lin Q , WeidnerCI , CostaIGet al. DNA methylation levels at individual age-associated CpG sites can be indicative for life expectancy. Aging (Albany NY)8(2), 394–401 (2016).
- Biggs ML , DoodyDR , TrabertB , StarrJR , ChenCSS. Consumption of alcoholic beverages in adolescence and adulthood and risk of testicular germ cell tumor. Int. J. Cancer11(139), 2405–2414 (2016).
- Srivastava A , KreigerN. Cigarette smoking and testicular cancer. Cancer Epidemiol. Biomarkers Prev.13(1), 49–54 (2004).
- Nettersheim D , BiermannK , GillisAJM , StegerK , LooijengaLHJ , SchorleH. NANOG promoter methylation and expression correlation during normal and malignant human germ cell development. Epigenetics6(1), 114–122 (2011).
- De Jong J , WeedaS , GillisAJM , OosterhuisJW , LooijengaLHJ. Differential methylation of the OCT3/4 upstream region in primary human testicular germ cell tumors. Oncol. Rep.18(1), 127–132 (2007).
- Costa AL , Moreira-BarbosaC , LoboJet al. DNA methylation profiling as a tool for testicular germ cell tumors subtyping. Epigenomics10(12), 1511–1523 (2018).
- Kemmer K , CorlessCL , FletcherJAet al. KIT mutations are common in testicular seminomas. Am. J. Pathol.164(1), 305–313 (2004).
- Rodda DJ , ChewJL , LimLHet al. Transcriptional regulation of NANOG by OCT4 and SOX2. J. Biol. Chem.280(26), 24731–24737 (2005).
- Corbetta M , ChiereghinC , DeSimone Iet al. Post-biopsy cell-free DNA from blood: an open window on primary prostate cancer genetics and biology. Front. Oncol.11(5), 1–10 (2021).
- Bart J , GroenHJM , VanDer Graaf WTAet al. An oncological view on the blood–testis barrier. Lancet Oncol.3(6), 357–363 (2002).
- Lind GE , SkotheimRI , LotheRA. The epigenome of testicular germ cell tumors. APMIS115(10), 1147–1160 (2007).
- El Messaoudi S , RoletF , MouliereF , ThierryAR. Circulating cell free DNA: preanalytical considerations. Clin. Chim. Acta424, 222–230 (2013).
- Murray MJ , WatsonHL , WardDet al. “Future-proofing” blood processing for measurement of circulating miRNAs in samples from biobanks and prospective clinical trials. Cancer Epidemiol. Biomarkers Prev.27(2), 208–218 (2018).
- Constâncio V , TavaresNT , HenriqueR , JerónimoC , LoboJ. miRNA biomarkers in cancers of the male reproductive system: are we approaching clinical application?Andrology1–17doi:10.1111/andr.13258 (2022).
- Glinge C , ClaussS , BoddumKet al. Stability of circulating blood-based microRNAs – pre-analytic methodological considerations. PLOS ONE12(2), 1–16 (2017).
- Myklebust MP , RosenlundB , GjengstøPet al. Quantitative PCR measurement of miR-371a-3p and miR-372-p is influenced by hemolysis. Front. Genet.10(5), 1–9 (2019).
- Timmerman DM , GillisAJM , MegoM , LooijengaLHJ. Comparative analyses of liquid-biopsy microRNA371a-3p isolation protocols for serum and plasma. Cancers (Basel)13(17), 1–15 (2021).
- Gosselt HR , GriffioenPH , Van ZelstBD , OosteromN , DeJonge R , HeilSG. Global DNA (hydroxy)methylation is stable over time under several storage conditions and temperatures. Epigenetics16(1), 1–9 (2020).
- Szklarczyk D , GableAL , NastouKCet al. The STRING database in 2021: customizable protein–protein networks, and functional characterization of user-uploaded gene/measurement sets. Nucleic Acids Res.49(D1), D605–D612 (2021).