
Abstract
Aim: To evaluate the regulatory landscape underlying the active enhancer marked by H3K27ac in high-fat diet (HFD)-induced nonalcoholic fatty liver disease (NAFLD) in rats. Materials & methods: H3K27ac chromatin immunoprecipitation and high-throughput RNA sequencing to construct regulatory profiles and transcriptome of liver from NAFLD rat model induced by HFD. De novo motif analysis for differential H3K27ac peaks. Functional enrichment, Kyoto Encyclopedia of Genes and Genomes pathway and protein–protein interaction network were examined for differential peak–genes. The mechanism was further verified by western blot, chromatin immunoprecipitation-quantitative PCR and real-time PCR. Results: A total of 1831 differential H3K27ac peaks were identified significantly correlating with transcription factors and target genes (CYP8B1, PLA2G12B, SLC27A5, CYP7A1 and APOC3) involved in lipid and energy homeostasis. Conclusion: Altered acetylation induced by HFD leads to the dysregulation of gene expression, further elucidating the epigenetic mechanism in the etiology of NAFLD.
Plain language summary
What is this summary about? Nonalcoholic fatty liver disease (NAFLD) is a typical metabolic disease, which is becoming the most common liver disease in the world. Despite its high prevalence and morbidity, there is currently no effective diagnostic or approved therapy, and the molecular mechanisms for NAFLD have not been fully clarified, especially for epigenetics. Herein, we focused on histone modification and investigated the impact of active enhancer to explore the epigenetic regulation of NAFLD, seeking new targets for the prevention and treatment of the disease.
What were the results? We identified the alteration of H3K27 acetylation and differential gene expression, enriched potential transcription-factor binding motifs and highlighted the hub risk genes of CYP8B1, PLA2G12B, SLC27A5, CYP7A1 and APOC3 in a NAFLD rat model.
What do the results mean? This work emphasized the vital roles of histone modification of H3K27ac in a high-fat-diet-induced NAFLD model, which could regulate the expression of key genes and transcription factor binding motifs, and H3K27ac induced the formation of NAFLD. Targeting the H3K27ac modification, dysregulated target genes and enriched pathways may be of great importance for NAFLD prediction and prevention, and serve as a valuable resource for genome-wide studies of epigenomic regulation in lipid metabolic disease.
Nonalcoholic fatty liver disease (NAFLD) includes a variety of diseases ranging from simple steatosis to steatohepatitis, fibrosis and cirrhosis, which is distinguished by excessive lipid accumulation in the liver and associated with increased risk of developing hepatic carcinoma, finally leading to liver transplantation and death [Citation1,Citation2]. However, there is no effective diagnostic methods or therapeutic drugs for NAFLD so far. The potential mechanism for the etiology and progression of NAFLD is complex and multifactorial. Two-hit theory suggested that hepatic steatosis acts as the first hit, sensitizing the liver to a second hit that triggers a cascade of tissue damage resulting in fibrosis [Citation3]. Nonetheless, it has been substituted by multiple-hit hypothesis, which revealed that multiple insults including dietary habits, environment, gut flora and genetic and epigenetic factors acting synergistically on genetically predisposed subjects to promote the progression of NAFLD [Citation4]. Among that, current understanding of the roles of epigenetic mechanisms in the etiology of NAFLD remains fairly rudimentary.
Epigenetics is defined as an inheritable but reversible phenotype change which can affect gene expression without alteration of DNA sequence, mainly including DNA methylation, histone modification, chromatin remodeling and ncRNAs [Citation5,Citation6]. Among them, histone modification, as a research hotspot in recent years, has been reported to play important roles in nutritional metabolic diseases such as Type 2 diabetes and obesity [Citation7–10]. For example, Malmgren et al. demonstrated the alteration of histone modification in β cells exposed to high levels of palmitate, leading to lipotoxicity of Type 2 diabetes [Citation8]. Nammo et al. revealed that high-fat diet (HFD) induced the genome-wide H3K27ac histone modification alterations, which correlated with differentially expressed genes (DEGs) involved in fatty acid metabolism, and contributed to obesity and glucose intolerance [Citation9]. Zhu et al. suggested that differential H3K27ac peaks were enriched for disease-associated genes and pathways with the genomic and transcriptomic analysis of fatty liver hemorrhagic syndrome in chickens [Citation10]. However, rare study has examined the exact roles of histone modification underlying pathogenesis and development of NAFLD.
H3K27ac, the acetylation of the lysine residue at N-terminal position 27 of the histone H3 protein, determines the chromatin compactness and accessibility, acting as an important epigenetic marker of active enhancers [Citation11,Citation12]. Herein, we investigated genome-wide patterns of lysine H3K27ac in liver tissues from HFD-induced NAFLD rat models and matched controls via the integrated analysis of chromatin immunoprecipitation (ChIP-seq) and high-throughput RNA sequencing (RNA-seq), aiming to explore the transcription-factor (TF) binding motifs, risk genes and pathways associated with NAFLD, providing potential novel targets for the prevention and treatment of NAFLD.
Materials & methods
Ethics & consent
All the animals were raised in compliance with the care and use guidelines of experimental animals according to the Animal Welfare Legislation of China. This study was approved by the Ethics Committee of Anhui Medical University.
Experimental animals & tissue collection
20 male Sprague Dawley rats (body weight 230 ± 20 g) purchased from the Vital River Laboratory Animal Technology Co. Ltd (Beijing, China) were applied in this study. To establish a NAFLD model, a total of 20 rats of 6 weeks old were randomly assigned to two groups: the standard-diet (20.6 kcal% protein, 12 kcal% fat and 67.4 kcal% carbohydrate) feeding group and HFD (20.2 kcal% protein, 45.4 kcal% fat and 34.5 kcal% carbohydrate) group. After 8 weeks of treatment, we randomly picked three rats from each of the two groups. The liver tissues and plasma samples were collected for the further use after the rats were sacrificed humanely.
Phenotype values including body weight, liver weight and serum levels of total cholesterol, triglyceride (TG), aspartate aminotransferase, alanine aminotransferase, high-density lipoprotein cholesterol and low-density lipoprotein cholesterol were measured respectively, demonstrated as mean ± standard deviation. Statistical comparisons of phenotypic values between the HFD and control (CTR) groups were carried out by Student t-test.
Histopathological examination
All histological analyses were administered by Servicebio Technology Co. Ltd (Wuhan, China). Briefly, fresh liver tissues were dissected and fixed in 10% neutral buffered formation, then paraffin sections were stained with an Oil Red O Staining Kit (Solarbio, Beijing, China) and a Hematoxylin and Eosin Staining Kit (Beyotime, Beijing, China).
Differential ChIP-seq analysis of H3K27ac peaks
We performed ChIP-seq by applying the SimpleChIP® Plus Enzymatic Chromatin IP Kit (Magnetic Beads, 9005) as detailed in protocols from www.encodeproject.org/about/experimentguidelines/. First, the liver tissues were fixed with 1% formaldehyde and terminated with 0.125 M glycine for the crosslink process. After cell disruption and micrococcal nuclease digestion, the crosslink lysates were sonicated to shear the chromatin with fragments of a target size ranging from 100 to 500 bp. Next, all samples were immunoprecipitated with 500 μg chromatin and 5 μg anti-H3K27ac antibody (Active Motif, no. 39133). Additionally, we immunoprecipitated with Histone H3 (rabbit, no. 4620) and IgG (rabbit, no. 2729) as positive and negative controls, respectively. Agarose electrophoresis and real-time quantitative PCR (RT-PCR) were also conducted to guarantee the success of ChIP (Supplementary Figure 1). Then Illumina sequencing libraries were prepared with ChIP and input DNA according to the manufacturer’s protocol.
Sequence tags were aligned to rat reference genome Rattus_norvegicus_6.0 using Burrows-Wheeler Aligner [Citation13]. Next, we ran Model-based Analysis for ChIP-seq version 2.1.0 (MACS 2.1.0) to obtain H3K27ac output peak files by setting the q-value threshold at 1e-5 [Citation14]. Then bedtools version 2.27.0 [Citation15] was used to merge all peaks files into one group file, with the merge criteria of more than 1 kb distance, since the H3K27ac enriched regions with the distance of ≥1 kb from a transcript start site were considered as putative active enhancers, according to the steps set by published report [Citation16]. The analysis pipeline and tools we adopted for ChIP-seq can be found online (https://github.com/crazyhottommy/ChIP-seq-analysis).
Next, we first used deepTools (https://deeptools.readthedocs.io/en/develop/) to identify the quality of ChIP-seq data obtained above. Then PeakAnalyzer tool (www.bioinformatics.org/peakanalyzer/) was applied to annotate H3K27ac enrichment across genomic features [Citation17]. Subsequently, Hypergeometric Optimization of Motif Enrichment (HOMER) [Citation18] was conducted for identifying TF binding motifs enriched by differential peaks with the command of findMotifsGenome.pl using the random sequences of rat whole genome Rattus_Novegicus_6.0 as the background.
To quantify NAFLD-related differentially acetylated peaks between CTR and NAFLD rats, all BAM files were sorted and analyzed using the samtools (version 1.2) ‘bedcov’ utility [Citation19]. Then we estimated empirical coverage by comparing the coverage within 20 bp bins across one megabase of mappable rat reference genome sequence. ChIP and input sample coverage were normalized by total mapped read count and peak length, with the subtraction of input coverage from ChIP coverage to limit the influence of fragmentation bias. Finally, DESeq2 R package [Citation20] was adopted to perform differential H3K27ac analysis with a p-value < 0.05 and |log2foldchange| ≥1. The analyses were conducted in R version 3.5.1.
RNA-seq & differential gene expression analyses
We firstly extracted total RNA from liver tissues using the TRIzol reagent (Invitrogen, CA, USA). Next, the total RNA was used for library construction with a NERNext® Ultra™ Directional RNA Library Prep Kit for Illumina® (NEB, MA, USA). Then the libraries were sequenced on HiSeq 4000 platform (Illumina) by Novogene (CA, USA) to generate 150 bp reads (paired-end) at a depth of approximately 46.2 million reads.
The analysis process of RNA-seq was performed according to online protocols (https://bioinformaticsdotca.github.io/RNA_2021). The reads were firstly mapped to the rat reference genome Rattus_norvegicus_6.0 by STAR-2.5.3a [Citation21]. Then mapped reads for genomic features were counted by featureCount software [Citation22]. Fragments per kilobase of exon model per million mapped fragments value of each identified gene was calculated by DESeq2 R package [Citation20] to normalize the gene expression. DEGs were also obtained by DESeq2 [Citation20] with the standards of |log2 (fold change)| ≥1 and p-value < 0.05.
Identification of the different peak target genes
By integrative of ChIP-seq and RNA-seq, we calculated the correlation between each different H3K27ac peak and gene expression level (normalized as fragments per kilobase of exon model per million mapped fragments) to explore target genes regulated by differential H3K27ac peaks [Citation23]. We defined correlated peak–gene pair with Pearson correlation coefficient ≥ 0.8 and p-value < 0.01. The top ten hypo- and hyper-acetylated peak target genes were screened out for further study. Additionally, we adopted genome-wide ‘four-way’ to demonstrate whether the differential peaks regulated target genes in a positive or negative direction using threshold of peak–gene correlation (Cor) |Cor (peak–gene correlation)| ≥0.5 and |log2(FoldChange)| ≥5. Among this, PP (upregulated peak–genes positively regulated by H3K27ac) was represented as the upregulated peak–genes positively regulated by H3K27ac (log2foldchange [ChIP ≥ 0 & RNA ≥0]) and PN (Downregulated peak–genes positively regulated by H3K27ac) was shown in the downregulated peak–genes positively regulated by H3K27ac (log2foldchange [ChIP ≤ 0 & RNA ≤0]). Additionally, we also identified the upregulated peak–genes negatively regulated by H3K27ac (NP) (log2foldchange [ChIP ≤ 0 & RNA ≥0]) and the downregulated peak–genes negatively regulated by H3K27ac (NN) (log2foldchange [ChIP ≥ 0 & RNA ≤0]).
Gene ontology & pathway enrichment analysis
Protein analysis through evolutionary relationships (PANTHER) (www.pantherdb.org/), Database for Annotation, Visualization and Integrated Discovery (DAVID) (http://david-d.ncifcrf.gov/) and Kyoto Encyclopedia of Genes and Genomes (KEGG) (http://www.genome.jp/kegg/) were used for understanding of overrepresented Gene Ontology (GO) terms and pathways of these DEGs, which were regulated by the alteration of H3K27ac. p-value < 0.05 and false discovery rate ≤ 0.05 were set as the cut-off criteria.
Protein–protein interaction network construction & module analyses
We applied the Search Tool for the Retrieval of Interacting Genes version 11.5 database (http://string-db.org/) to construct protein–protein interactions (PPIs) [Citation24] of differential PP genes. The combined score of interactions higher than 0.4 were considered as significant. Next, cytoscape 3.9.1 software was used to explore the hub nodes with a high score based on the scale-free property of the network [Citation25]. Moreover, CytoHubba plugin in cytoscape was conducted with the degree method to identify the top ten hub genes among the interactions. We also used the Molecular Complex Detection plugin to investigate the core module in the network.
ChIP-quantitative PCR & RT-PCR validation
For ChIP-quantitative PCR (ChIP-qPCR) assay, we firstly prepared ChIP DNA samples using the SimpleChIP® Plus Enzymatic Chromatin IP Kit (Magnetic Beads, 9005) as mentioned before. Then we quantified ChIP DNA concentrations by analyzing fluorescent signal densities that were proportional to the amplicon after the ChIP assay. Next, data were plotted as % input DNA, which was calculated using the cycle threshold (Ct) following formula: %input = 2(- △Ct [normalized ChIP]). Moreover, we normalized the △ Ct values with the subtraction of △ Ct value obtained for the positive locus from the △ Ct value for negative locus: (△△ Ct = △Ctpositive - △Ctnegative). Therefore, the fold enrichment of sequence were computed as 2△ △Ct.
To validate the mRNA expression level of CYP8B1, PLA2G12B, SLC27A5, CYP7A1 and APOC3, total RNA was extracted with RNA isolator Total RNA Extraction Reagent (Vazyme Biotech, Nanjing, China) and reverse-transcribed into cDNA with a reverse transcription kit (Vazyme Biotech, Nanjing, China). Then SYBR green Premix kit (Vazyme Biotech) was used for RT-PCR amplification, predenaturing cDNA at 95°C for 10 min, followed by 40 cycles of 95°C for 30 seconds and 60°C for 30 seconds in each cycle. The relative mRNA expression levels of the target genes were normalized to the expression of β-actin by 2△ △Ct method. The primers used for RT-PCR analysis are listed in Supplementary Table 1.
Western blot analysis
The fresh liver tissues were washed with Phosphate Buffer Saline and lysed in Radio Immunoprecipitation Assay protein lysis buffer. Then, we removed the insoluble material by centrifugation (12,000 × g) for 20 min at 4°C, and the supernatants were collected and stored at -80°C. The total proteins were extracted and quantified following BCA Protein Assay Kit (Beyotime, Beijing, China). Next, we separated the proteins by 15% SDS-PAGE and transferred them to Polyvinylidene Fluoride membranes (ISEQ00010; Millipore, MA, USA). The blotted membranes were blocked with 5% skim milk in Tris Buffered Saline with Tween® 20, then incubated with the primary antibodies against H3K27ac (81049, activemotif), β-actin (66009-1-Ig, proteinteh) at 4°C overnight, finally coated with appropriate Horseradish Peroxidase-coupled secondary antibodies. The expressions of proteins were detected by Tanon 5200 Series Fully Automated Chemiluminescence/Fluorescence Image Analysis System (Tanon, Shanghai, China).
Results
Histopathological & pathological differences between the liver tissues from the normal & NAFLD groups
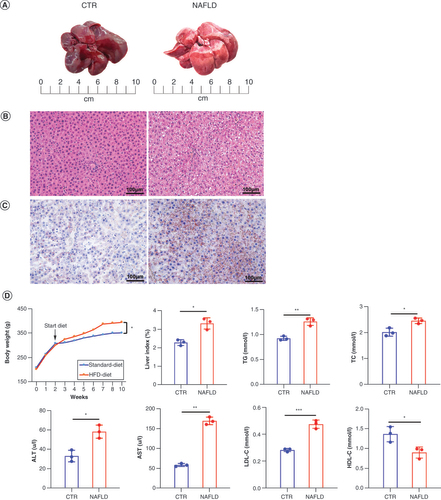
As shown in A, the liver in the standard-diet group was bright red of a smooth surface, with sharp edges and nongreasy sections, while the livers of HFD-induced NAFLD rats were becoming light yellow with blunt edges, rough surfaces and greasy sections. In addition, hematoxylin–eosin staining showed the normal histological structure in the CTR group, with no lipid deposition or inflammatory cell infiltration in hepatocytes. In contrast, the hepatocytes of NAFLD model rats were swollen, with more lipid droplets of different sizes inside, accompanied by inflammatory cells infiltrated in the portal area (B). The amount of lipids in liver tissues was also increased in the NAFLD model groups as demonstrated by Oil Red O staining (C). Besides this, we found that the body weight of the HFD-induced NAFLD group was higher than the CTR group, with a significant difference (p < 0.05). The liver index was also remarkably higher than that in CTR group (D) (p < 0.05). Similarly, the serum levels of TG (p < 0.01), total cholesterol (p < 0.05), aspartate aminotransferase (p < 0.05), alanine aminotransferase (p < 0.01) and low-density lipoprotein cholesterol (p < 0.001) were significantly upregulated, but high-density lipoprotein cholesterol was downregulated in experimental rats compared with CTR groups (D), suggestive of the lipid accumulation and liver injury in HFD-induced NAFLD rats. Taken together, these results further validated that the NAFLD models were constructed successfully in this study.
(A) Comparison of liver tissue between CTR and HFD-induced NAFLD groups. (B) Histopathological section of liver tissue by hematoxylin and eosin staining is shown (scale bar: 20 μm; magnification of the microphotograph: 200×). (C) The Oil Red O staining shows the lipid accumulation in livers from the two groups (scale bar: 20 μm; magnification of the microphotograph: 200×). (D) The changes of body weight during the experiment stage, liver index (liver wet weight/body weight), and the serum levels of TG, TC, ALT and AST in two groups were examined respectively. Data are represented as the mean ± standard deviation.
*p < 0.05; **p < 0.01.
ALT: Alanine aminotransferase; AST: Aspartate aminotransferase; CTR: Control group; HDL-C: High-density lipoprotein cholesterol; HFD: High-fat diet; LDL-C: Low-density lipoprotein cholesterol; NAFLD: Nonalcoholic fatty liver disease; TC: Triglycerides; TG: Total cholesterol.
Genome-wide maps of histone acetylome signal in CTR group & HFD-induced NAFLD rats
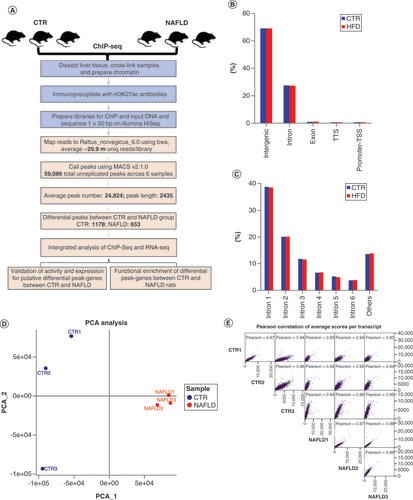
To reveal the genome-wide active enhancer profile of healthy and NAFLD groups, we adopted the representative epigenetic mark of H3K27ac. We generated high-quality H3K27ac ChIP-seq data by dissecting liver tissues from CTR and NAFLD groups respectively, following a workflow of ChIP analysis (A). In total, ∼33.8 M reads ranging from 28.1 M to 37.1 M were obtained for each ChIP or input sample. On average, ∼28.0 M reads per sample ranging from 23.5 M to 32.1 M were uniquely mapped to the rat reference genome Rattus_Novegicus_6.0 using Burrows-Wheeler Aligner [Citation13]. Afterward, H3K27ac peaks were identified to determine H3K27ac enrichment loci throughout the genome via MACS2 v2.1.0 [Citation14]. The H3K27ac-enriched regions were considered as putative active enhancers if the region distance were more than 1 kb from a transcript start site [Citation16]. Overall, 59,086 unreplicated H3K27ac peaks were identified across six samples, with an average peak number of 24,824 and peak length of 2435. Meanwhile, we conducted HOMER [Citation18,Citation20] to compare the genome distribution of the peaks between CTR and NAFLD groups. Interestingly, little discrepancy was demonstrated between the two groups (B & C). A larger proportion of H3K27ac peaks fell into intergenic (67.8% in CTR and 67.0% in NAFLD) and introchromosomal regions (29.4% in CTR and 29.6% in NAFLD) both in CTR and NAFLD groups, while other regions, including exon, transcript termination site and promoter-transcript start site, only occupied a small part (B), further validating the feature of enhancer marked by H3K27ac with the no-coding occupation in the whole genome. Additionally, H3K27ac peaks were mostly overlapped with the first intron of corresponding genes (37.6% of the CTR and 36.5% of the NAFLD) (C), suggesting the important regulatory role of sequences positioned nearby the intron of genes. In conclusion, these results revealed the profile of H3K27ac modification and the distribution of the H3K27ac peaks among the rat genome. Finally, we identified that the samples were clearly separated into two clusters as shown in D and Supplementary Figure 2, indicating the significant difference between CTR and NAFLD groups. Moreover, Pearson correlation of average scores per transcript in E also showed that the quality of ChIP-seq data between samples was in good control.
(A) The ChIP-seq analysis with experimental (light blue) steps, computational steps (pink) and summary numbers. (B) Breakdown on H3K27ac enrichment across the genome in the CTR and HFD-induced NAFLD rats. (C) The distribution of the H3K27ac peaks among each intron. (D) PCA of ChIP-seq data for liver tissues in CTR (blue) and NAFLD (red) groups (n = 3/group). (E) Pearson correlation of average scores per transcript of CTR and NAFLD rats.
ChIP-seq: Chromatin immunoprecipitation coupled with high-throughput sequencing; CTR: Control group; HFD: High-fat diet; NAFLD: Nonalcoholic fatty liver disease; PCA: Principal component analysis; RNA-seq: High-throughput RNA sequencing; TSS: Transcript start site; TTS: Transcript termination site.
The analysis of NAFLD-associated differential H3K27ac peaks & the enrichment of TF binding motifs
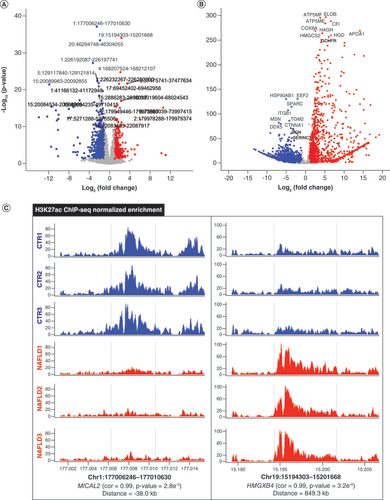
A total of 1831 (5.3%) of 34,424 peaks were characterized as NAFLD-associated differential acetylation with a |log2 (fold change)| ≥1 and a p-value < 0.05, among which the hypoacetylated peaks occupied for 1178 (3.4%) rather the hyperacetylated regions for 653 (1.9%) (A). As shown in Supplementary Table 2, the top ten hypoacetylated and hyperacetylated peaks were indicated.
(A) Volcano plot of remarkable differential H3K27ac regions between CTR (n = 1178) and NAFLD (n = 653) samples. (B) Significant differentially expressed genes between CTR (n = 2715) and NAFLD (n = 1041) groups. (C) Differential peak–genes correlated with the representative H3K27ac regions in both CTR and NAFLD groups. The red and blue dots indicate upregulation and downregulation, respectively.
ChIP-seq: Chromatin immunoprecipitation coupled with high-throughput sequencing; Cor: Peak–gene correlation; CTR: Control group; NAFLD: Nonalcoholic fatty liver disease.
Additionally, transcription-factor binding motifs are certified as target sequences in triggering epigenetic reprogramming, which may be enriched in regulatory regions associated with epigenetic changes in response to environmental stimuli [Citation9]. In this study, we tried to discover the sequence motifs for DNA-binding proteins with significant enrichment in differential H3K27ac peaks of NAFLD samples by using HOMER [Citation18]. In total, seven TF binding motifs (p < 0.01) were significantly overrepresented (Supplementary Table 3), which were predicted to bind with the transcription factors of GFI1B, PAX6, ZFP57, TWIST, GATA, TBX20 and GRE, respectively. Interestingly, we observed that TWIST1 was reported as a negative feedback regulation of brown fat metabolism, playing a vital role in treating obesity and metabolic disease [Citation26]. These results further suggested that DNA-binding proteins enriched by NAFLD-related differential H3K27ac peaks mainly focus on the process of metabolic balance, which in conformity to the fact that transcription factors can act as direct activators of transcriptional and epigenetic changes under external stimuli.
Distinct transcriptome profiles comparing NAFLD to CTR rats
To further identify NAFLD-associated peak–genes, we integrated the data of ChIP-seq and RNA-seq. In total, 3756 (10.9%) of 34,424 genes which were characterized as DEGs between CTR and NAFLD rats with a |log2 (fold change)| ≥1 and a p-value < 0.05 were identified. There were 2715 (7.9%) downregulated and 1041 (3.0%) upregulated genes among these DEGs (B). The top ten significantly upregulated and downregulated DEGs were labeled (Supplementary Table 4), including ELOB [Citation27], CFI [Citation28], EEF2 [Citation29], HSP90AB1 [Citation30] and ITGBI [Citation31] related with the immune response, and the genes APOA1 [Citation32] and HMGCS2 [Citation33], which have been reported to be involved in the process of lipid metabolism.
Then, to further certificate differential H3K27ac peaks between NAFLD and normal groups, we established the distinct activity of the H3K27ac signal (C) and exhibited top ten hypo- and hyperacetylated peaks and putative target genes in Supplementary Table 5. Among them, was an enhancer (Chr1:177006246-177010630) with higher acetylation in the control located close to MICAL2 (p = 2.8e-5; Cor: 0.99), a gene associated with cytoskeleton organization, autophagy and phagocytosis [Citation34]. On the contrary, a region (Chr19:15194303-15201668) with more enrichment of H3K27ac in NAFLD groups was identified to have connection with HMGXB4 (p = 3.2e-4; Cor: 0.99), a gene playing an important role in the immune process according to the previous research (C) [Citation35]. Collectively, the findings above revealed that alteration of H3K27ac has a regulatory effect on target genes in the liver tissues of NAFLD rats induced by HFD. Moreover, we observed that the distances between the differential peaks and targeted genes were 38.0 kb and 849.3 kb, respectively, further confirming that the enhancers are distal regulatory elements which can regulate the expression of genes in disregard of distance restrictions.
Integrating acetylome & transcriptome changes in NAFLD with peak–gene correlation
To better understand the relevance between epigenetic alterations and transcriptional levels, the integrated ChIP-seq and RNA-seq data were used for further analyzing. Meanwhile, we calculated the correlation between the enrichment of differential peaks and the activation of proximal transcripts within 1-Mb region [Citation23]. A total of 5991 peak–gene correlations with a Cor ≥ 0.8 and p < 0.01 were identified, including 4090 and 1901 correlations in the CTR and NAFLD groups, respectively (A). Next, we observed that the targeted genes correlated with each H3K27ac peak showed a larger positive peak–gene correlation in CTR peaks, while more negative correlations were presented in NAFLD groups (A). Moreover, as demonstrated in B & C, the frequency of peak–gene correlations within a region of 100 kb of the hypo- and hyper-acetylated peaks was more condense than outside the region, suggesting that the frequency of both negative and positive correlations declined with distance.
(A) The number of positive and negative peak–gene interaction in CTR and NAFLD groups. (B) Distribution of peak–gene correlations against peak–gene distance in CTR groups. (C) Distribution of peak–gene correlations against peak–gene distance in NAFLD groups. The frequency in the middle within 100 kb was more condense than outside with far distance. (D) Genome-wide ‘four-way’ plot showed the genes with a |Cor (peak–gene correlation)| >0.5 and a |log2(FoldChange)| >5 generated by integrated analysis of ChIP-seq and RNA-seq between CTR and NAFLD groups. PP peak–genes with upregulation and positive correlation are colored red, NN peak–genes with downregulation and negative correlation are colored green, PN peak–genes with downregulation but positive correlation are colored blue, and NP peak–genes with upregulation but negative correlation are colored yellow. (E) Overrepresented biological processes of putative target genes associated with differentially hypo- and hyperacetylated peaks by Protein Analysis through Evolutionary Relationships (www.pantherdb.org/). (F) Regulation terms of putative target-genes of differentially hypoacetylated peaks (blue) and hyperacetylated peaks (red) by Database for Annotation, Visualization and Integrated Discovery (https://david-d.ncifcrf.gov/).
ChIP-seq: Chromatin immunoprecipitation coupled with high-throughput sequencing; CTR: Control group; NAFLD: Nonalcoholic fatty liver disease; NN: downregulated peak–genes negatively regulated by H3K27ac; NP: Upregulated peak–genes negatively regulated by H3K27ac; PN: Downregulated peak–genes positively regulated by H3K27ac; PP: Upregulated peak–genes positively regulated by H3K27ac; RNA-seq: High-throughput RNA sequencing.
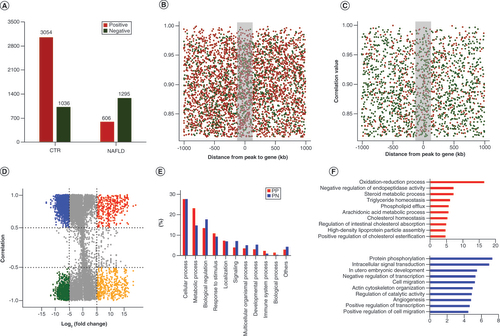
Subsequently, we conducted functional enrichment analysis of differentially regulated peak–genes to better evaluate the altered functions induced by HFD. Firstly, we adopted genome-wide ‘four-way’ to demonstrate the upregulated peak–genes positively regulated by H3K27ac (PP; log2foldchange [ChIP ≥ 0; & RNA ≥0]) and downregulated peak–genes positively regulated by H3K27ac (PN; log2foldchange [ChIP ≤ 0; & RNA ≤0]) (D), which consist of 159 and 711 peak–genes, respectively. Then, PANTHER was adopted for the analysis of the relevant biological processes of these putative target-genes correlated with PP and PN peak–genes. We found that the target genes associated with differential H3K27ac peaks were primarily overrepresented in diverse biological processes, containing ‘cellular process (GO:0009987)’, ‘metabolic process (GO:0008152)’, ‘response to stimulus (GO:0050896)’, ‘biological regulation (GO:0065007)’ and ‘development process (GO:0032502)’, which implied that these target genes may be regulated by differential acetylation to further influence these biological processes to promote the development of NAFLD (E). Moreover, we adopted DAVID to further investigate the significantly overrepresented gene ontology terms associated with these differentially acetylated peak–genes. Intriguingly, lipid metabolism processes including ‘oxidation-reduction process’, ‘steroid metabolic process’, ‘triglyceride homeostasis’, etc. were significantly enriched (p < 0.01) in PP peak–genes of NAFLD groups with higher acetylation (F), while PN peak–genes tended to be involved in basic developmental processes of ‘protein phosphorylation’ and ‘intracellular signal transduction’, which is in accordance with the results performed by PANTHER. Together, the results above revealed that the upregulated target genes correlated with hyperacetylated peaks in NAFLD rats may be more involved in lipid metabolic processes, while the hypoacetylated peak–genes were more related to basic development regulations.
Identification of key genes enriched in the overrepresented pathways
Next, we sought to investigate the key pathways overrepresented by all PP genes between CTR and NAFLD rats based on the DAVID and KEGG databases. Among these, signaling pathways (of steroid hormone biosynthesis, PPAR, etc.) were identified as top canonical ones (p < 0.05) (Supplementary Table 6), which are known as strongly associating with lipid metabolism and energy homeostasis [Citation36,Citation37]. To screen out the key genes enriched in these overrepresented pathways, we firstly sorted the PP genes by both p-value and Cor, then identified top genes with the high enrichment in multiple pathways associated with lipid metabolism and immune response. Interestingly, we discovered four overlapped genes multiply-enriched in pathways, namely CYP8B1 [Citation38], PLA2G12B [Citation39], SLC27A5 [Citation40] and CYP7A1 () [Citation41], playing important roles in bile acid, cholesterol metabolism and fatty acid transport, which may be potential therapeutic targets for NAFLD. Above all, these results indicated that differentially acetylated associated genes may lead to activation of the pathway involved in steroid hormone biosynthesis and PPAR signaling, contributing to lipid accumulation and metabolic disorders in the development of NAFLD.
Table 1. The interested peak–genes enriched in the pathways were associated with lipid metabolic and energy homeostasis, etc.
To further identify the core gene among NAFLD-related differential peak–genes, we also constructed the PPI network of 159 differential PP genes through the Search Tool for the Retrieval of Interacting Genes database, including 107 nodes and 649 edges, involved in the lipid metabolic process and oxidation-reduction process (Supplementary Figure 3A). Then we used the Cytoscape software to further investigate the interaction results. Firstly, the top ten genes were identified by order with the CytoHubba plugin according to the degree method, containing ALB, HRG, GC, APOA1, APOA4, NRLI2, F9, APOA2, APOC3 and UGT2B15 (Supplementary Figure 3B & Supplementary Table 7). Then we adopted the Molecular Complex Detection plugin to explore the most significant module in the network (Supplementary Figure 3C). As a result, five among the top ten genes were obtained from the module (Supplementary Figure 3D), namely APOA2, APOC3, HRG, GC and APOA1. Intriguingly, the upregulation of APOC3 has been identified to increase hepatic TG accumulation and participate in inflammatory response and insulin resistance, acting as a key regulator to promote the pathogenesis of NAFLD [Citation42], which is consistent with our enriched pathway results (Supplementary Table 6).
In conclusion, the results above indicated that CYP8B1, PLA2G12B, SLC27A5, CYP7A1 and APOC3 () are risk genes of NAFLD, which may be potential targets in the etiology and progression of the disease.
Validation of interested peak related target genes
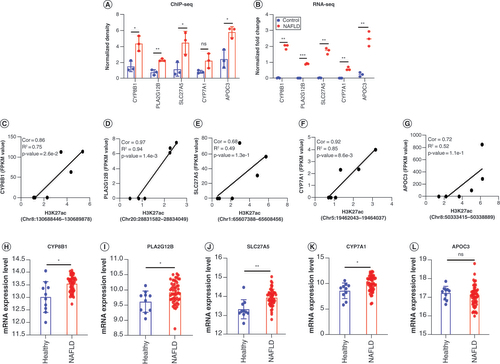
In order to certificate the H3K27ac enrichment and expression of the interested genes in , we firstly obtained the ChIP-seq and RNA-seq data of these genes in CTR and NAFLD groups (A & B). As mentioned before, the ChIP-seq fold enrichment and the mRNA levels of these five key genes were all higher in the NAFLD group, while among the same group, CYP7A1 was in no significant difference following the result of ChIP-seq (p = 0.11). As illustrated in C–G, there was a positive correlation between the density of H3K27ac and transcriptional levels of CYP8B1, PLA2G12B, SLC27A5, CYP7A1 and APOC3. Additionally, we assessed the previously published RNA-seq dataset from Gene Expression Omnibus (Gene Expression Omnibus DataSets: GSE135251) [Citation43] to further identify the gene expression in human liver tissues between healthy and NAFLD individuals. The results showed that the four interested genes (CYP8B1, PLA2G12B, SLC27A5 and CYP7A1) were dramatically upregulated in human NAFLD livers, which is consistent with our RNA-seq result of rat livers (B). However, the expression of APOC3 in GSE135251 was in no statistical difference (p = 0.24), which may be due to the differences between human and rat.
(A) The H3K27ac enrichment of CYP8B1, PLA2G12B, SLC27A5 and CYP7A1 genes in NAFLD rats relative to control groups used by ChIP-seq data. (B) The mRNA expression levels of five genes in the result of RNA-seq. The data of RNA-seq was normalized by lg (initial data +1). (C–G) Correlation plots showed the relationship between the fold enrichment of H3K27ac and expression of these genes: (C) CYP8B1, (D) PLA2G12B, (E) SLC27A5, (F)CYP7A1 and (G) APOC3. (H–L) The transcriptional levels of genes (H)CYP8B1, (I) PLA2G12B, (J) SLC27A5, (K) CYP7A1 and (L) APOC3 in patients with NAFLD relative to healthy individuals in GSE135251. Healthy (n = 10), NAFLD (n = 51) in GSE135251. The data are represented as the mean ± standard deviation. Significance was assessed by t-test.
*p < 0.05; ** p < 0.01; ***p < 0.001.
ChIP-seq: Chromatin immunoprecipitation coupled with high-throughput sequencing; Cor: Peak–gene correlation; NAFLD: Nonalcoholic fatty liver disease; RNA-seq: High-throughput RNA sequencing.
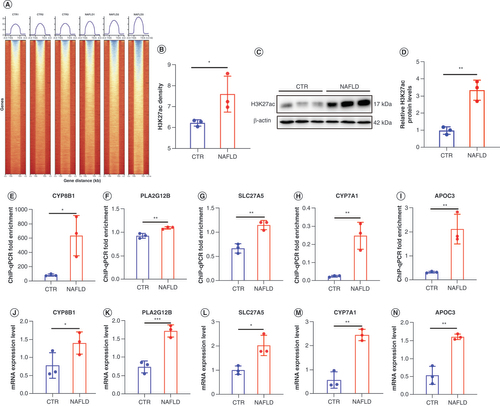
In A & B, we found that H3K27ac ChIP-seq reads have a significantly higher enrichment in NAFLD versus those in the CTR group (p < 0.05). This was further corroborated by western blot analysis demonstrated in C & D. Furthermore, ChIP-qPCR (E–I) and RT-PCR (J–N) were also conducted to further validate the previous findings of CYP8B1, PLA2G12B, SLC27A5, CYP7A1 and APOC3. In consequence, the ChIP-qPCR fold enrichment and the level of these genes’ expression were all remarkably elevated in NAFLD groups compared with CTR (p < 0.05), in line with our previous ChIP-seq and RNA-seq results. Combined, the results above indicated that hyperacetylation induced by HFD positively regulated the expression of CYP8B1, PLA2G12B, SLC27A5, CYP7A1 and APOC3 in liver tissue to enhance the formation of NAFLD, and may be novel potential biomarkers for NAFLD.
(A & B) Heatmaps show H3K27ac signal at 3 kb near TSS and TES in normal and NAFLD samples. (C & D) Western blot analysis of H3K27ac levels in CTR and NAFLD groups. (E–I) ChIP-qPCR fold enrichment of CYP8B1, PLA2G12B, SLC27A5, CYP7A1 and APOC3 in between CTR and NAFLD rats. (J–N) The mRNA expression level of CYP8B1, PLA2G12B, SLC27A5, CYP7A1 and APOC3 in two groups were detected by real-time PCR. We present the individual data as the mean ± standard deviation. Significance was assessed by t-test
* p < 0.05; ** p < 0.01; ***p < 0.001.
ChIP-qPCR: Chromatin immunoprecipitation coupled with high-throughput sequencing quantitative PCR; CTR: Control group; NAFLD: Nonalcoholic fatty liver disease; TSS: Transcription start site; TES: Transcription end sites.
Discussion
In this study, we depict the alterations of histone acetylome and transcriptome profiles derived from liver tissues between HFD-induced NAFLD and CTR groups. Integrating these ChIP-seq and RNA-seq data, our study revealed a bunch of differentially acetylated peak–associated genes enriched for lipid metabolism and immune process, containing CYP8B1, PLA2G12B, SLC27A5, CYP7A1 and APOC3, which may act as major contributors in the pathogenesis and development of NAFLD. In addition to identifying these key genes and pathways, we also investigate the upstream TFs enriched by differential peaks, further elucidating the epigenetic mechanism in HFD-induced NAFLD. Overall, the variation of H3K27ac marks in NAFLD rats was investigated with the analysis of differential genes and enriched TF binding motifs in our study, providing a framework for further studies on this modification for other metabolic diseases.
The transcription factors can activate gene expression directly, and participate in the alteration of epigenetics. In our study, the upstream TFs linked with the changes of genome-wide acetylome have been identified, including GFI1B, PAX6, ZFP57, TWIST, GATA, TBX20 and GRE, which may play vital regulatory roles in NAFLD. It is noteworthy that PAX6, ZFP57, GATA, TWIST and GRE have been demonstrated to be involved in some metabolic diseases, such as Type 2 diabetes, transient neonatal diabetes and nonalcoholic steatohepatitis [Citation44–49], which is broadly consistent with our results. For instance, Swisa et al. showed that PAX6 expression is reduced in β cells of hyperglycemic and insulin-resistant mice, which maintains β cell identity and glucose homeostasis [Citation48]. Besides this, Zhang et al. demonstrated that TWIST2 plays important roles in steatosis, involved in the development of NAFLD [Citation49], and Chen et al. discovered the downregulation of GATA-3 and lower percentage of iNKT cells in HFD-induced NAFLD mice, which may contribute to the inflammation in the liver tissue of NAFLD [Citation44]. Although the biological relevance of GFI1B has not been well described for NAFLD, it is reported [Citation50] to be involved in the immune system, playing important roles in the dysfunction and malignant transformation of immune cells, which may contribute to the development of NAFLD. These observations further revealed that TFs played an integral role in regulating the progression of NAFLD, highlighting possible targets for the prevention and treatment of NAFLD.
Considering H3K27ac regions are closely related to highly transcriptional activation, we further analyzed target genes of differential H3K27ac peaks between CTR and NAFLD groups. Differential PP and PN peak–genes were identified using genome-wide ‘four-way’, which were related to lipid metabolic processes and basic biological regulation, respectively. Moreover, we observed that the PP peak–genes were most remarkably enriched in steroid hormone biosynthesis and PPAR signaling pathway through DAVID and KEGG databases, which is in accordance with prior studies [Citation51]. Among these, steroid hormones, containing glucocorticoids and androgens, potentially regulating metabolic phenotype, have been investigated to drive hepatic lipid accumulation. Thus, the disorder of steroid hormone biosynthesis may have a crucial role in the pathogenesis and progression of NAFLD [Citation36]. In addition, the PPAR signaling pathway consists of three subtypes: PPARα, PPARβ/δ and PPARγ, participating in the regulation of peroxisome proliferation, lipid and glucose metabolism, inflammation response and insulin sensitivity, which is also associated with the processes of NAFLD [Citation10,Citation37].
Interestingly, we identified five hub peak-genes (CYP8B1, PLA2G12B, SLC27A5, CYP7A1 and APOC3) listed in based on the analysis of enriched pathways and PPI network. CYP8B1 encodes sterol 12a-hydroxylase, known as a major regulator of the balance between cholic acid and chenodeoxycholic acid, which plays a vital role in regulation of lipid metabolism and fatty liver development. It was reported that the decreased expression of CYP8B1 contributed to the remodeling of the bile acid pool and may be a novel target to prevent and treat NAFLD [Citation38] (Supplementary Figure 4A). Gene PLA2G12B, a novel mediator of TG metabolism, promotes the release of very-low-density lipoprotein particles into the circulation and reduces accumulation of TG in the liver. Thus, the absence of PLA2G12B contributes to the development of acute hepatosteatosis [Citation39,Citation52]. Overall, the increased transcription of PLA2G12B in the liver may be a protective target against NAFLD (Supplementary Figure 4B). SLC27A5 encodes FATP5, characterized as mediating bile acid recycling, and uptake and transport of fatty acid in liver. Previous study revealed that SLC27A5 is exclusively expressed in the basal plasma membrane of hepatocytes, involved in long-chain fatty acid uptake from the circulation. Furthermore, it was also demonstrated that the SLC27A5 knockout mice had less accumulation of lipid in the liver compared with a CTR group [Citation40,Citation53] (Supplementary Figure 4C). CYP7A1 encodes the rate-limiting enzyme in the classic bile acid biosynthetic pathway. Li et al. [Citation54] have observed that glucose stimulates CYP7A1 expression in hepatocytes via increasing acetylation of H3 and H4 on the chromatin, which helps us to better understand that the high expression of CYP7A1 in our study may be the result rather than cause of NAFLD induced by HFD [Citation51]. APOC3 has been confirmed to be upregulated in the occurrence and development of NAFLD in published research [Citation42]. High levels of APOC3 promote very-low-density lipoprotein-TG production and inflammatory response, contributing to diet-induced NAFLD and hepatic insulin resistance. (Supplementary Figure 4D). Altogether, better understanding of these dysregulated genes in NAFLD may facilitate the novel biomarker discovery of lipid disorders in the future.
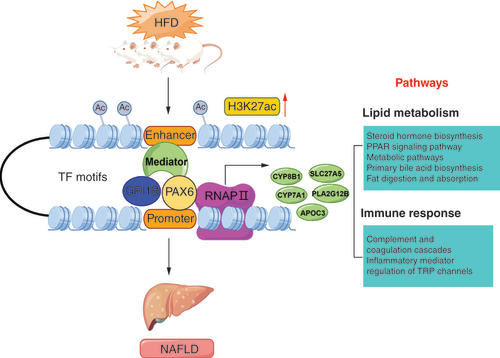
According to the dysregulated acetylation and peak–genes, with current knowledge of enriched TF binding motifs and pathways above, we proposed a potential epigenetic regulation mechanism of NAFLD induced by HFD in rats (). In this model, the HFD may trigger histone modification of H3K27ac with the alteration of TF binding motifs, contributing to the differential expression of candidate genes including CYP8B1, PLA2G12B, SLC27A5, CYP7A1 and APOC3, which results in the lipid metabolism disorders and excessive fat accumulation in liver, inducing the formation of NAFLD, in line with the notion that changes of epigenetic modifications and transcriptional regulation are imperative for phenotypic adaptation in response to environmental stimuli like dietary intervention and physical exercise [Citation55]. The whole epigenetic regulatory processes further enhance our understanding of epigenetic mechanisms of NAFLD, which also provide promising insights on developing therapy strategy and biomarkers for lipid metabolic diseases.
The proposal model demonstrated that HFD could alter the histone H3K27 acetylation, resulting in the remodeling of chromatin structure. Thus, the enhancer recruits more transcription factors including GFI1B and PAX6, promoting the expression of genes (CYP8B1, PLA2G12B, SLC27A5, CYP7A1 and APOC3) enriched in lipid metabolism and immune response related pathways, which contribute to the lipid deposition in liver tissue, involved in the occurrence and development of NAFLD.
This figure was created by Figdraw.
HFD: High-fat diet; NAFLD: Nonalcoholic fatty liver disease; TF: Transcription factor.
To the best of our knowledge, this is the first study to present the genome-wide profiling of acetylation signals and transcripts signals discriminating HFD-induced NAFLD by integrating ChIP-seq and RNA-seq in a rat model, which contributes to the further understanding of epigenetic and genetic dysregulation in the etiology of NAFLD. However, it is notable that numerous limitations still exist in our current study. More molecular biological processes are still required to be further confirmed in the proposal model. Besides this, given that the size of tested samples is relatively small, it is possible to lead to coincidence in our study; thus a larger number of liver samples from CTR and NAFLD is necessary for additional functional studies.
Conclusion
Our study integrated the profiles of histone acetylome and transcriptome to identify the dysregulated acetylation and genes that drive the pathological alteration in NAFLD induced by HFD, which may promote our understanding of the epigenetic regulation of dietary habit on lipid metabolic disorders. We emphasized the vital roles of histone modification of H3K27ac in HFD-induced NAFLD model, which could regulate the expression of key genes and transcription-factor binding motifs, involved in the absorption, transport and excretion of lipids and the excessive accumulation of fatty acid in the liver. Thus, targeting the histone modification of H3K27ac, TFs, dysregulated target genes and enriched pathways – including steroid hormone biosynthesis and the PPAR signaling pathway – may assist the identification of novel and specific biomarkers for NAFLD prediction and prevention, and serve as a valuable resource for genome-wide studies of epigenomic regulation in lipid metabolic diseases. Additionally, we also provided detailed information on the genome-wide variation of histone modification in metabolic diseases under the influence of high-fat dietary habit.
The change of dietary habits leads to the alteration of epigenetic modification, closely related to the progression of nonalcoholic fatty liver disease (NAFLD).
H3K27ac peaks are mostly positioned in intergenic regions and overlapped with the first intron in the whole genome, validating the feature of active enhancer marked by H3K27ac with the no-coding occupation and role of regulation.
The sequence motifs enriched by differential acetylation are related to the transcription factor acting as key upstream regulator in lipid metabolism, such as GFI1B and PAX6.
NAFLD-associated hyperacetylated peak–genes tend to link with the lipid metabolic process, and are remarkably enriched in pathways of steroid hormone biosynthesis and PPAR signaling, which contributed to the accumulation of fatty acid and inflammation response in liver.
CYP8B1, PLA2G12B, SLC27A5, CYP7A1 and APOC3 are key genes significantly associated with differential peaks, playing important roles in the etiology of NAFLD.
The acetylomic dysregulation and gene alteration identified in our study further advance the important roles of epigenetic regulation in NAFLD and provide possible therapeutic implication for lipid metabolic disorders.
Y Zhu, J Huang and X Wei conceived and designed the experiments. J Ma, S Chen, N Fang, X Yi, X Lu and X Li performed the experiments. D You, Y Wang and M Zhu analyzed the data. D You and J Ma wrote and revised the manuscript. Y Zhu and Y Tang revised the manuscript. All authors read and approved the final manuscript.
Ethical conduct of research
The authors state that they have obtained appropriate institutional review board approval for all animal experimental investigations.
Supplemental Figure 1
Download MS Word (1.4 MB)Acknowledgments
We are grateful to colleagues in College of Animal Science and Technology, Jiangxi Agricultural University for data collection and experiments.
Supplementary data
To view the supplementary data that accompany this paper please visit the journal website at: www.tandfonline.com/doi/suppl/10.2217/epi-2022-0362
Financial & competing interests disclosure
This work was supported by the National Natural Science Foundation of China (grant no. 31960690), Natural Science Foundation of the Anhui Higher Education Institutions (grant no. KJ2021A0205) and Basic and Clinical cooperative research program of Anhui Medical University (grant no. 2022xkjT013). The authors have no other relevant affiliations or financial involvement with any organization or entity with a financial interest in or financial conflict with the subject matter or materials discussed in the manuscript apart from those disclosed.
No writing assistance was utilized in the production of this manuscript.
Data sharing statement
All the sequencing data of high-throughput RNA sequencing and chromatin immunoprecipitation will be deposited at the Genome Sequence Archive (https://ngdc.cncb.ac.cn/gsa/) upon acceptance. Three sets of control data of RNA-seq have been deposited at the Genome Sequence Archive repository (https://bigd.big.ac.cn/gsa/browse/ CRA002638). The Gene Expression Omnibus dataset used for this study can be found at https://www.ncbi.nlm.nih.gov/, GSE135251.
Additional information
Funding
References
- Lee J , KimY , FrisoS , ChoiS-W. Epigenetics in non-alcoholic fatty liver disease. Mol. Aspects Med.54, 78–88 (2017).
- Younossi Z , TackeF , ArreseMet al. Global perspectives on nonalcoholic fatty liver disease and nonalcoholic steatohepatitis. Hepatology69(6), 2672–2682 (2019).
- Peverill W , PowellLW , SkoienR. Evolving concepts in the pathogenesis of NASH: beyond steatosis and inflammation. Int. J. Mol. Sci.15(5), 8591–8638 (2014).
- Buzzetti E , PinzaniM , TsochatzisEA. The multiple-hit pathogenesis of non-alcoholic fatty liver disease (NAFLD). Metabolism65(8), 1038–1048 (2016).
- Li Y-Y . Genetic and epigenetic variants influencing the development of nonalcoholic fatty liver disease. World J. Gastroenterol.18(45), 6546–6551 (2012).
- Ashraf NU , AltarM. Epigenetics: an emerging field in the pathogenesis of nonalcoholic fatty liver disease. Mutat. Res. Rev. Mutat. Res.778, 1–12 (2018).
- Ling C , RonnT. Epigenetics in human obesity and Type 2 diabetes. Cell Metab.29(5), 1028–1044 (2019).
- Malmgren S , SpegelP , DanielssonAPet al. Coordinate changes in histone modifications, mRNA levels, and metabolite profiles in clonal INS-1 832/13 beta-cells accompany functional adaptations to lipotoxicity. J. Biol. Chem.288(17), 11973–11987 (2013).
- Nammo T , UdagawaH , FunahashiNet al. Genome-wide profiling of histone H3K27 acetylation featured fatty acid signalling in pancreatic beta cells in diet-induced obesity in mice. Diabetologia61(12), 2608–2620 (2018).
- Zhu Y , ZengQ , LiFet al. Dysregulated H3K27 acetylation is implicated in fatty liver hemorrhagic syndrome in chickens. Front. Genet.11, 574167 (2020).
- Zhang T , ZhangZ , DongQ , XiongJ , ZhuB. Histone H3K27 acetylation is dispensable for enhancer activity in mouse embryonic stem cells. Genome Biol.21(1), 45 (2020).
- Kimura H . Histone modifications for human epigenome analysis. J. Hum. Genet.58(7), 439–445 (2013).
- Abuin JM , PichelJC , PenaTF , AmigoJ. BigBWA: approaching the Burrows-Wheeler aligner to big data technologies. Bioinformatics31(24), 4003–4005 (2015).
- Zhang Y , LiuT , MeyerCAet al. Model-based analysis of ChIP-seq (MACS). Genome Biol.9(9), R137 (2008).
- Quinlan AR , HallIM. BEDTools: a flexible suite of utilities for comparing genomic features. Bioinformatics26(6), 841–842 (2010).
- Villar D , BerthelotC , AldridgeSet al. Enhancer evolution across 20 mammalian species. Cell160(3), 554–566 (2015).
- Salmon-Divon M , DvingeH , TammojaK , BertoneP. PeakAnalyzer: genome-wide annotation of chromatin binding and modification loci. BMC Bioinformatics11, 415 (2010).
- Heinz S , BennerC , SpannNet al. Simple combinations of lineage-determining transcription factors prime cis-regulatory elements required for macrophage and B cell identities. Mol. Cell38(4), 576–589 (2010).
- Li H , HandsakerB , WysokerAet al. The Sequence Alignment/Map format and SAMtools. Bioinformatics25(16), 2078–2079 (2009).
- Love MI , HuberW , AndersS. Moderated estimation of fold change and dispersion for RNA-seq data with DESeq2. Genome Biol.15(12), 550 (2014).
- Dobin A , DavisCA , SchlesingerFet al. STAR: ultrafast universal RNA-seq aligner. Bioinformatics29(1), 15–21 (2013).
- Liao Y , SmythGK , ShiW. featureCounts: an efficient general purpose program for assigning sequence reads to genomic features. Bioinformatics30(7), 923–930 (2014).
- Takahashi JS , KumarV , NakashePet al. ChIP-seq and RNA-seq methods to study circadian control of transcription in mammals. Methods Enzymol.551, 285–321 (2015).
- Szklarczyk D , MorrisJH , CookHet al. The STRING database in 2017: quality-controlled protein–protein association networks, made broadly accessible. Nucleic Acids Res.45(D1), D362–D368 (2017).
- Shannon P , MarkielA , OzierOet al. Cytoscape: a software environment for integrated models of biomolecular interaction networks. Genome Res.13(11), 2498–2504 (2003).
- Vonhogen IGC , ElAzzouzi H , OlieslagersSet al. MiR-337-3p promotes adipocyte browning by inhibiting TWIST1. Cells9(4), 1056 (2020).
- Da Costa KS . Structural analysis of viral infectivity factor of HIV type 1 and its interaction with A3G, EloC and EloB. PLOS ONE9(6), e89116 (2014).
- Ahmad A , MandwieM , DreismannAKet al. Adeno-associated virus vector gene delivery elevates factor I levels and downregulates the complement alternative pathway in vivo. Hum. Gene Ther.32(21-22), 1370–1381 (2021).
- Nakajima H , MurakamiY , MoriiEet al. Induction of eEF2-specific antitumor CTL responses in vivo by vaccination with eEF2-derived 9mer-peptides. Oncol. Rep.35(4), 1959–1966 (2016).
- Ambrocio-Ortiz E , Perez-RubioG , Ramirez-VenegasAet al. Protective role of genetic variants in HSP90 genes-complex in COPD secondary to biomass-burning smoke exposure and non-severe COPD forms in tobacco smoking subjects. Curr. Issues Mol. Biol.43(2), 887–899 (2021).
- Castruccio Castracani C , LonghitanoL , DistefanoAet al. Heme oxygenase-1 and carbon monoxide regulate growth and progression in glioblastoma cells. Mol. Neurobiol.57(5), 2436–2446 (2020).
- Lai CQ , ParnellLD , OrdovasJM. The APOA1/C3/A4/A5 gene cluster, lipid metabolism and cardiovascular disease risk. Curr. Opin. Lipidol.16(2), 153–166 (2005).
- Lee H , ChoiJY , JoungJG , JohJW , KimJM , HyunSH. Metabolism-associated gene signatures for FDG avidity on PET/CT and prognostic validation in hepatocellular carcinoma. Front. Oncol.12, 845900 (2022).
- Barravecchia I , BarresiE , RussoCet al. Enriching the arsenal of pharmacological tools against MICAL2. Molecules26(24),7519 (2021).
- He XQ , DongKZ , ShenJet al. Deficiency of the novel high mobility group protein HMGXB4 protects against systemic inflammation-induced endotoxemia in mice. Proc. Natl Acad. Sci. USA118(7),e2021862118 (2021).
- Nikolaou N , GathercoleLL , MarchandLet al. AKR1D1 is a novel regulator of metabolic phenotype in human hepatocytes and is dysregulated in non-alcoholic fatty liver disease. Metabolism99, 67–80 (2019).
- Karavia EA , PapachristouDJ , LiopetaK , TriantaphyllidouIE , DimitrakopoulosO , KypreosKE. Apolipoprotein A-I modulates processes associated with diet-induced nonalcoholic fatty liver disease in mice. Mol. Med.18, 901–912 (2012).
- Chevre R , Trigueros-MotosL , CastanoDet al. Therapeutic modulation of the bile acid pool by Cyp8b1 knockdown protects against nonalcoholic fatty liver disease in mice. FASEB J.32(7), 3792–3802 (2018).
- Chen LH , WuM , ZhangSNet al. Estrogen-related receptor gamma regulates hepatic triglyceride metabolism through phospholipase A2 G12B. FASEB J.33(7), 7942–7952 (2019).
- Park D , KimE , LeeH , ShinEA , LeeH , LeeJW. Tetraspanin TM4SF5 in hepatocytes negatively modulates SLC27A transporters during acute fatty acid supply. Arch. Biochem. Biophys.710, 109004 (2021).
- Chambers KF , DayPE , AboufarragHT , KroonPA. Polyphenol effects on cholesterol metabolism via bile acid biosynthesis, CYP7A1: a review. Nutrients11(11), 2588 (2019).
- Lee HY , BirkenfeldAL , JornayvazFRet al. Apolipoprotein CIII overexpressing mice are predisposed to diet-induced hepatic steatosis and hepatic insulin resistance. Hepatology54(5), 1650–1660 (2011).
- Govaere O , CockellS , TiniakosDet al. Transcriptomic profiling across the nonalcoholic fatty liver disease spectrum reveals gene signatures for steatohepatitis and fibrosis. Sci. Transl. Med.12(572), eaba4448 (2020).
- Chen D , GaoX , WangJet al. Activation of hepatic iNKT2 cells by α-GalCer ameliorates hepatic steatosis induced by high-fat diet in C57BL/6J mice. Int. Immunopharmacol.74, 105727 (2019).
- Hedjazifar S , KhatibShahidi R , HammarstedtAet al. The novel adipokine Gremlin 1 antagonizes insulin action and is increased in Type 2 diabetes and NAFLD/NASH. Diabetes69(3), 331–341 (2020).
- Mackay DJG , CallawayJLA , MarksSMet al. Hypomethylation of multiple imprinted loci in individuals with transient neonatal diabetes is associated with mutations in ZFP57. Nat. Genet.40(8), 949–951 (2008).
- Sheng X , WangM , LuM , XiB , ShengH , ZangYQ. Rhein ameliorates fatty liver disease through negative energy balance, hepatic lipogenic regulation, and immunomodulation in diet-induced obese mice. Am. J. Physiol. Endocrinol. Metab.300(5), e886–e893 (2011).
- Swisa A , AvrahamiD , EdenNet al. PAX6 maintains β cell identity by repressing genes of alternative islet cell types. J. Clin. Invest.127(1), 230–243 (2017).
- Zhang Y , GeX , LiYet al. TWIST2 and the PPAR signaling pathway are important in the progression of nonalcoholic steatohepatitis. Lipids Health Dis.20(1), 39 (2021).
- Fraszczak J , MoroyT. The transcription factors GFI1 and GFI1B as modulators of the innate and acquired immune response. Adv. Immunol.149, 35–94 (2021).
- Jia X , ZhaiT. Integrated analysis of multiple microarray studies to identify novel gene signatures in non-alcoholic fatty liver disease. Front. Endocrinol. (Lausanne)10, 599 (2019).
- Liu QL , YangM , FuXKet al. Activation of farnesoid X receptor promotes triglycerides lowering by suppressing phospholipase A2 G12B expression. Mol. Cell. Endocrinol.436(C), 93–101 (2016).
- Zhou W , MadridP , FluittA , StahlA , XieXS. Development and validation of a high-throughput screening assay for human long-chain fatty acid transport proteins 4 and 5. J. Biomol. Screen.15(5), 488–497 (2010).
- Li T , ChandaD , ZhangY , ChoiHS , ChiangJY. Glucose stimulates cholesterol 7alpha-hydroxylase gene transcription in human hepatocytes. J. Lipid Res.51(4), 832–842 (2010).
- Stevanović J , BelezaJ , CoxitoP , AscensãoA , MagalhãesJ. Physical exercise and liver ‘fitness’: role of mitochondrial function and epigenetics-related mechanisms in non-alcoholic fatty liver disease. Mol. Metab.32, 1–142020).