
 ?Mathematical formulae have been encoded as MathML and are displayed in this HTML version using MathJax in order to improve their display. Uncheck the box to turn MathJax off. This feature requires Javascript. Click on a formula to zoom.
Abstract
DNA methylation (DNAm)-based cell mixture deconvolution (CMD) has become a quintessential part of epigenome-wide association studies where DNAm is profiled in heterogeneous tissue types. Despite being introduced over a decade ago, detection limits, which represent the smallest fraction of a cell type in a mixed biospecimen that can be reliably detected, have yet to be determined in the context of DNAm-based CMD. Moreover, there has been little attention given to approaches for quantifying the uncertainty associated with DNAm-based CMD. Here, analytical frameworks for determining both cell-specific limits of detection and quantification of uncertainty associated with DNAm-based CMD are described. This work may contribute to improved rigor, reproducibility and replicability of epigenome-wide association studies involving CMD.
Epigenome-wide association studies (EWAS) involve the study of epigenetic variation, specifically DNA methylation (DNAm), and its relationship to environmental risk factors, pathogenesis, disease progression and response to treatment [Citation1–3]. A well-established challenge in the analysis of data arising from EWAS where DNAm is profiled in heterogeneous tissue types (e.g., whole blood) is the potential for confounding, which stems from the cell specificity of DNAm [Citation4]. Along with the potential for confounding, DNAm analyses of heterogeneous tissue types have the additional challenge of reduced statistical power for detecting differential methylation and are often more difficult to interpret compared with DNAm analyses conducted on purified, homogenous cell populations [Citation5–8]. When measurements of cell composition are available, the potential for confounding due to cellular heterogeneity can be mitigated by adjusting statistical models with terms that reflect the proportion of each cell type within the heterogeneous sample [Citation8]. However, measurements of cell composition are not routinely available as there are both logistical hurdles associated with their collection (e.g., most cytological techniques require fresh samples) and because of additional costs to the researcher. Fortunately, methods have been developed that leverage the cell specificity of DNAm to estimate or deconvolve the fraction/proportion of specific cell types in a biospecimen that represents a heterogenous mixture of such cell types. So-called cell mixture deconvolution (CMD) is based on the premise that the methylation signature of a heterogeneous sample is a weighted mixture of the unique methylation signature associated with each of the cells present in that sample [Citation9–16]. While DNAm-based CMD can be reference-free [Citation11,Citation15,Citation16], where heterogeneous mixtures are deconvolved in the absence of reference DNAm signatures on the specific cell types believed to be present in such mixtures, or reference-based deconvolution [Citation9,Citation10,Citation12,Citation13], where the DNAm signature of specific cell types is leveraged, only the latter provides deconvolution estimates with known cell identity. Thus, if there is interest in examining the proportion of particular cell types or cell type ratios in relation to the particular phenotype(s) or exposure(s) of interest, as is frequently the case, reference-based methods for CMD are generally preferred as the identity of the specific cell types being deconvoluted is known [Citation13,Citation14].
Whether interest is centered on comparisons of the cell proportions per se, or ratios thereof [Citation17–20], or inclusion of cell proportions as covariates in downstream statistical models [Citation8,Citation12,Citation21], there are several issues associated with reference-based DNAm deconvolution that should be considered. First, CMD may result in estimates of zero (or very close to zero) for one or more cell types in a mixed or heterogeneous biospecimen when they are present in the sample [Citation22]. While deconvolution estimates approaching zero or exactly equal to zero may, on the surface, seem benign, they can lead to extreme values when calculating cell type ratios (e.g., neutrophil to lymphocyte ratio, CD4/CD8), adversely impacting downstream statistical comparisons of such ratios, and can be problematic when applying statistical models for compositional data, some of which involve modeling log-ratios of the cell type proportions [Citation23]. Consequently, many researchers will either remove/exclude samples with deconvolution estimates that approach or are equal to zero, winsorize deconvolution estimates [Citation24,Citation25] or will impute problematic cell types with an arbitrarily chosen, nominal value, a practice that lacks adequate justification and undermines reproducibility. In such situations, it would be valuable to know the limit detection of DNAm-based deconvolution as the limit of detection (LoD) is a reflection of how precise a specific instrument, technology or procedure is, and because it often influences how values equal to or approaching zero, are handled [Citation26,Citation27].
A second consideration of reference-based DNAm deconvolution concerns the use of deconvolution estimates as covariates in downstream statistical models to adjust for the potential confounding effects of cellular heterogeneity. Regression models, which are commonly used in EWAS, assume that covariates are measured precisely, or observed without error. Regardless of the specific statistical framework used for reference-based DNAm deconvolution, deconvolution estimates are subject to uncertainty, uncertainty that is often ignored when such estimates are treated as covariates in downstream regression models. For example, it is common to include the cell proportion estimates obtained from CMD as covariates without considering the uncertainty or error associated with their estimation. Depending on the degree of uncertainty and relationship to other variables in the model, failing to incorporate the mistake in deconvolution estimates could contribute to bias in parameter estimation or loss of statistical power [Citation28,Citation29].
While DNAm-based CMD was introduced over a decade ago, there remains very little guidance on how one should handle DNAm-based deconvolution estimates that approach or equal zero, nor has there been sufficient attention on how to quantify the uncertainty associated with DNAm-based CMD. Motivated by these gaps and the challenges they present, the current authors sought to create systematic analytical frameworks for determining both cell-specific LoDs and for the quantification of uncertainty associated with DNAm-based CMD. As described by Arbruster and Pry in the context of clinical laboratory work, the LoD is the lowest analyte concentration at which detection of that analyte is possible [Citation30]. In the context of DNAm-based CMD, the LoD is the smallest percentage of a cell type in a mixed biospecimen (e.g., whole blood) that can be reliably detected via CMD. The current approach to estimating the LoD for DNAm-based CMD builds off this definition and involves the generation of in silico mixtures where the proportion of select cell types are manipulated in a mixture to determine the point at which it can be reliably detected via CMD. In addition to being useful for handling cell proportion estimates that approach or are equal to zero, analytical frameworks for calculating cell-specific LoDs would allow one to assess the viability of adding new cell types to existing reference libraries for the purpose of reference-based CMD. To quantify the uncertainty associated with deconvolution estimates, utilizing nonparametric bootstrap-based (1-α)*100% CIs is proposed.
What follows begins with an overview of CMD. Next, the steps involved in the proposed analytical framework for calculating cell-specific LoD values for DNAm-based deconvolution of whole-blood DNAm data carried out using the Houseman method are described [Citation9]. The steps involved in obtaining cell-specific (1-α)*100% bootstrap CIs for the deconvolution of whole blood DNAm data are described next, followed by a description of the datasets and assessments that were performed to evaluate the proposed frameworks. Finally, an illustration of the proposed framework and a discussion of the results are provided.
Methods & materials
Reference-based CMD
For this work, DNAm is assumed to have been profiled in whole blood; however, in principle, the following descriptions apply to DNAm data collected from any heterogeneous tissue type that is believed to be a complex mixture of different cell types. Let be a vector of CpG-specific methylation beta-values such that
,
and
. Here,
and
is the total number of CpGs profiled on an array and
is the number of CpGs that make up the reference library. Additionally, i is an index representing subject/sample and j is an index for a particular CpG site. Assuming that sample i is comprised of K underlying cell types whose corresponding proportions in the mixture are denoted as
the whole-blood methylation signature
can be expressed as a weighted mixture of the DNAm signature of the K cell types contained within the sample, i. In particular,
where is a
x K matrix of cell-specific methylation beta-values for sample i and
represents a random error term. Cell type proportions for this research were estimated using the Houseman approach [Citation9]. Estimating
via the Houseman approach involves finding the set of weights that minimize the squared error loss function subject to the previously described constraints on
. Specifically,
is minimized utilizing constrained projection/quadradic programming. In practice, is frequently unknown so a general matrix, M, whose elements are the mean cell-specific methylation beta-values calculated from a reference dataset of cell-specific methylation data, is used in place of
[Citation5,Citation9].
Regardless of the specific statistical framework used for DNAm-based cellular deconvolution, the accuracy of cell proportion estimates, , strongly depends on the
specific CpGs used as the basis for deconvolution [Citation12]. The
-specific CpGs used as the basis for deconvolution are often referred to as the reference library. Reference libraries are ideally comprised of a set of CpGs that exhibit a unique methylation signature across the K cell types as this strongly correlates with deconvolution accuracy [Citation5,Citation12,Citation21,Citation31]. In what follows, the reference library described in [Citation31] was used. This library is comprised of 1200 CpGs and is hereafter referred to as the Extended Reference Library. The Extended Reference Library was constructed using the IDOL algorithm (Koestler et al.) and facilitates the estimation of the proportions of 12 leukocyte subtypes: neutrophils, eosinophils, basophils, B naive cells, B memory cells, monocytes, natural killer (NK) cells, CD4 naive cells, CD4 memory cells, CD8 naive cells and CD8 memory cells, based on whole-blood DNAm data assayed using the Illumina HumanMethylationEPIC array (Illumina, CA, USA) [Citation12]. The Extended Reference Library was shown to be highly accurate in deconvoluting these 12 leukocyte subtypes [Citation31].
Limit of blank
Calculating the deconvolution-based LoD for each of the previously mentioned 12 leukocyte subtypes requires one to first determine the limit of blank (LoB) for each cell type. The LoB is the highest apparent analyte concentration expected to be found when replicates of a sample containing no analyte are tested [Citation30]. In cellular deconvolution, the LoB can be thought of as the highest apparent deconvolution estimate of a cell type in a mixture (e.g., whole blood) that is expected to be reported when that cell type is not present in the mixture. Arbruster and Pry estimate the LoB by first measuring the concentration of the analyte based on replicates of a blank sample, then by calculating , where
is the sample mean of the analyte concentration and
is the sample standard deviation. Based on this formulation and assuming a Gaussian distribution of the raw analytical signals from blank samples, 95% of the measurements of the analyte of interest assessed in samples not containing the analyte would be expected to be less than the LoB. Arbruster and Pry likely assumed a Gaussian distribution for the raw analytical signals of blank samples in their calculation because calculating the mean and standard deviation can be accomplished with a relatively modest number of replicate blank samples. Such modest sample sizes are not uncommon for clinical laboratory testing due to the time and cost of the associated instruments used to measure the concentration of the analyte(s) of interest and because such instruments may require specialized personnel. However, if a large number of blank samples could be performed, an alternative strategy for determining the LoB would involve simply calculating the 95th percentile of the measured analyte concentrations across the blank samples. This approach is nonparametric with respect to the distribution of the analyte concentration in blank samples. It, therefore, does not require one to assume normality, an assumption that is unlikely to be reasonable given the non-negativity of concentration measurements, expected zero inflation and positive skew characteristic of concentration measurements of blank samples [Citation32,Citation33]. To determine the LoB in the context of DNAm-based deconvolution of whole blood, an approach that is nonparametric concerning the distribution of deconvolution estimates of blank samples but is parametric with respect to the generation of simulated mixtures that are used for determining the LoB is used here. To summarize, the proposed framework first involves generating in silico mixtures of the 12 previously mentioned cell types with the constraint that the proportion of one cell type at a time is equal to zero. Following the nomenclature used in Arbruster and Pry [Citation30], cell types whose proportion is exactly equal to zero in the in silico mixtures are referred to as the blank cell type. Next, the in silico mixtures are deconvolved using the Houseman method with the Extended Reference Library [Citation31] and the
percentile (e.g., 95th percentile) of the deconvolution estimates for the blank cell type is calculated. This process is repeated for each of the 12 cell types. Next, the specific details of the procedure are presented in a general format that can be applied to any reference set.
Step 0: Identify methylation datasets needed for the calculation:
| a. | Identify a cell-specific methylation reference dataset in which DNAm has been profiled in the individual cell types that make up a heterogeneous tissue sample (e.g., whole blood). | ||||
| b. | Identify a mixture methylation dataset in which DNAm has been profiled in a heterogeneous tissue sample (e.g., whole blood) and where “gold standard” measurements of the proportions (e.g., flow cytometry, complete blood cell count with differential, etc.) of the | ||||
Step 1: Estimate necessary parameters used to create in silico mixtures:
| a. | Using the cell-specific reference data from Step 0a, estimate the beta-distribution shape parameters | ||||
| b. | Using the mixture data from Step 0b, fit an extended beta regression model [Citation34–36] to each CpG independently, treating methylation beta-values as the response and controlling for the “true” mixing proportions of | ||||
,
where and
are link functions,
and
are vectors of covariates for the ith sample and
and
are parameter vectors that describe the relationship between the elements of
and
and the mean and precision parameters, respectively. In the current application,
and represented “true,” reconstructed mixing proportions of 11 out of the 12 cell types,
was assumed to be logit link function and
was assumed to be the log-link. The purpose of fitting such models was to estimate the precision parameter,
,
. The precision parameter is inversely proportional to the variance and is used later in the procedure for simulating ‘realistic’ whole-blood DNAm data from which LoB estimates are obtained. Extended beta-regression models were fit using the betareg R package [Citation37]. See A(iv) for a further explanation of this calculation.
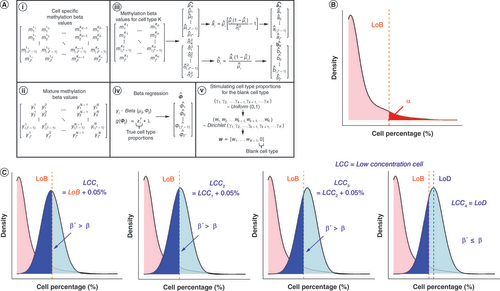
(A) (i) Visualization of cell-specific reference methylation matrix. Rows of this matrix are CpGs that make up the Extended Reference Library and columns are leukocyte subtypes for different samples. Subscript denotes the CpG while the superscript denotes the cell type as well as the specific sample within each cell type. (ii) Visualization of reconstructed mixture methylation matrix. Rows of this matrix are CpGs that make up the Extended Reference Library and columns are the different reconstructed mixture samples. Subscript denotes the specific CpG while superscript reflects the specific reconstructed mixture sample. (iii) How beta distribution shape parameters are estimated using cell-specific reference data. (iv) How beta distribution precision parameters are estimated for CpGs in the Extended Reference Library. (v) How cell-type proportions are simulated when one cell type is set as the blank cell type. (B) Visualization of calculation of limit of blank. The y-axis shows the density of deconvolution estimates while the x-axis shows the deconvolution estimates as percentages for the blank cell type. (C) Visualization of the calculation of the limit of detection. The y-axis of the plots shows the density of deconvolution estimates while the x-axis shows the deconvolution estimates at percentages for the cell type that the limit of detection is being calculated for.
LoB: Limit of blank; LoD: Limit of detection.
Step 2: Create in silico mixtures in which to estimate the LoB:
| a. | Let cell type | ||||
| b. | Randomly generate cell proportions for the (K - 1) remaining cell types ( | ||||
where is a
dimensional vector of Dirichlet parameter values. The concentration parameter for a Dirichlet distribution is defined as
and is inversely proportional to the variance. Thus, a higher concentration parameter means lower variance in the Dirichlet-distribution simulated values. Concentration parameters equal to 18, 73 and 128 were chosen based on the recommendation from Meier et al., which represent the range (e.g., 18 and 128) and median (e.g., 73) Dirichlet concentration parameter estimated from DNAm-based deconvolution estimates of several publicly available whole-blood DNAm datasets. Since
is generated from a Uniform(0,1) distribution,
was further scaled to sum to the desired concentration values [Citation38]. See A(v) for a further explanation of this calculation.
| c. | Generate cell-specific methylation data | ||||
where , and
.
| d. | Generate in silico mixture samples | ||||
where and
.
Note, an alternative parameterization of the beta distribution that is based on the mean and precision parameters is used. In general, if where
and
are the shape parameters, then
, where
and
.
Step 3: Deconvolute the in silico mixtures using the desired reference library:
Each in silico mixture sample generated in Step 2d, , is subjected to deconvolution resulting in
for
.
Step 4: Calculate the LoB using the distribution of deconvolution estimates for the blank cell.
The LoB for the blank cell type (e.g., cell type k) is the value for which of the distribution is less than or equal to that value. In other words, if
is the empirical cumulative distribution function of the deconvolution estimates for the blank cell type, then the LoB is
. Here,
can be thought of as the probability of detecting a cell type as present in a sample given that it is truly not present (type 1 error). B shows a visual representation of the calculation of the LoB for the blank cell type.
Step 5: Repeat Steps 1–4 for the remaining leukocyte subtypes. This results in estimates of the LoB for each of the K cell types,
Limit of detection
As Arbruster and Pry described, the LoD is the lowest analyte concentration expected to be reliably distinguished from the LoB and at which detection is possible [Citation30]. In the current framework, the LoD is the smallest proportion of a given cell type in a mixed biospecimen (e.g., whole blood) that can reliably be distinguished from the LoB. Similar to the approach described for estimating the LoB, the LoD was estimated by generating in silico mixtures, leveraging the previously calculated cell-specific LoB values. In silico mixtures are developed such that the proportion of a given cell type, hereafter referred to as the low-concentration cell type, is initially set to its LoB and sequentially increased until the distribution of deconvolution estimates for that cell type is statistically distinguishable from the LoB value for that cell type. Next, the steps involved in calculating the LoD are described. Note that many of the steps are identical to those described in the estimation of the LoB.
Step 1: Create in silico mixtures in which to estimate the LoD:
| a. | Let cell type | ||||
| b. | Randomly generate cell proportions for the (K - 1) remaining cell types ( | ||||
Where is a
dimensional vector of Dirichlet parameter values. As previously described, Dirichlet concentration parameters equal to 18, 73 and 128 were used and
was scaled to sum to the appropriate concentration.
| c. | Generate cell-specific methylation data | ||||
| d. | Generate in silico mixture samples | ||||
Step 2: Deconvolute the in silico mixtures using the desired reference library:
Each in silico mixture sample generated in Step 2d, , is subjected to deconvolution resulting in
for
.
Step 3: Calculate :
| a. | Calculate the proportion of deconvolution estimates of the low-concentration cell type that are less than the LoB for that cell type. | ||||
where is the indicator function.
Step 4: Check :
| a. | If | ||||
| b. | If | ||||
In the previous expression, is a user-supplied parameter that reflects the probability of declaring a cell type to be absent in a sample given that it is truly present (type 2 error). C shows a visual representation of the calculation of the LoD for the cell type of interest.
Step 5: Repeat Steps 1–4 for the remaining leukocyte subtypes. This results in estimates of the LoD for each of the K cell types,
Quantifying uncertainty in deconvolution estimates
Uncertainty in DNAm-based CMD stems from the way in which cell-specific reference methylation data are used to arrive at deconvolution estimates. Recall that to minimize the squared error loss function, a matrix M, whose elements are the mean cell-specific methylation beta-values calculated from a reference dataset of cell-specific methylation data, is used [Citation5,Citation9]. Because M is a matrix of mean cell-specific methylation beta-values, whose rows represent CpGs and whose columns represent cell types, any CpG-specific variability across samples of a shared cell type (e.g., neutrophils) is lost when M is used as the reference matrix for DNAm-based CMD. As it is such variability that contributes to the variability of DNAm-based deconvolution estimates and because the sampling distribution of M is difficult to justify, a nonparametric bootstrap procedure to calculate cell-specific CIs as a means of quantifying the uncertainty associated with DNAm-based deconvolution is proposed. Bootstrapping is a statistical resampling method that allows statistical inference or the calculation of CIs when one does not know the sampling distribution of the data [Citation39]. What follows are the steps taken to estimate CIs for the proportion of a given cell type in a mixed, heterogeneous biospecimen.
Step 1: Select a random matrix from the cell-specific methylation reference matrix to use for deconvolution:
| a. | Recall the cell-specific methylation reference matrix has | ||||
| b. | Select a random number, r, between 1 and | ||||
| c. | Repeat Steps a and b for the remaining cell types. | ||||
| d. | Combine randomly selected columns to form a random matrix, | ||||
Note, for the reference data, the number of samples for each cell type need not be the same.
Step 2: Deconvolute the mixed, heterogeneous samples (e.g., whole blood) via the randomly selected matrix from Step 1. Record the cell proportion estimates.
Step 3: Repeat Steps 1–2 for B bootstrap samples.
Step 4: Calculate the bootstrap estimated CIs:
| a. | Order the cell proportion estimates from CMD for each cell type and sample. | ||||
| b. | Calculate the confidence limits for each as the | ||||
A visualization of this process can be found in .
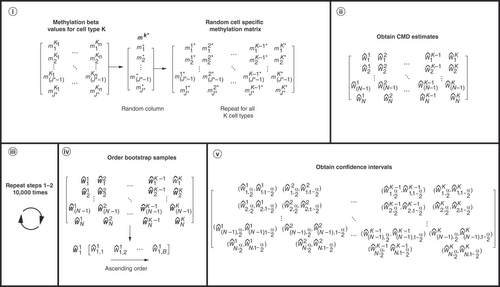
(i) Selection of a random sample from cell-specific reference data. One random column for each cell type is selected to use as the library for deconvolution. (ii) Deconvolution estimates, which correspond to one bootstrap sample. (iii) 10,000 bootstrap samples are generated. (iv) 10,000 bootstrap samples and how the deconvolution estimates are ordered for each cell type and sample. (v) Calculation of confidence limits using the ordered bootstrap samples. The lower limit of the CIs corresponds to the 2.5 percentile and the upper limit to the 97.5 percentile.
Datasets
See Salas et al. for further details on the datasets used in this work.
Cell-specific reference methylation data
Cell-specific DNAm was profiled using the Illumina HumanMethylationEPIC array technology. Specifically, DNAm was assessed in cytometric and magnetic-sorted, flow-confirmed values, spanning 12 distinct leukocyte cell subtypes: neutrophils (n = 6), eosinophils (n = 4), basophils (n = 6), B naive cells (n = 4), B memory cells (n = 6), monocytes (n = 5), NK cells (n = 4), CD4 naive cells (n = 5), CD4 memory cells (n = 4), CD8 naive cells (n = 5), CD8 memory cells (n = 4) and Treg cells (n = 3) [Citation31]. Cells were isolated from 41 males and 15 females, all anonymous healthy donors. A description of the preprocessing and quality control procedures implemented on cell-specific reference methylation datasets has been previously described [Citation31].
Reconstructed mixture methylation data
Reconstructed mixtures (n = 12) were generated by mixing DNA extracted from purified isolated cell types based on predetermined mixing proportions for each cell type. The cell types used to create the reconstructed mixture samples included the same twelve previously mentioned leukocyte cell types. Cells used to isolate the DNA to create the mixtures were purchased from AllCells corporation (CA, USA), StemExpress (CA, USA), and STEMCELL Technologies (Vancouver, Canada) [Citation31]. For each of the 12 reconstructed mixtures, DNAm was profiled using the Illumina HumanMethylationEPIC array technology. Additionally, of these 12 reconstructed samples, some were intentionally constructed to be absent of either basophils, CD4 memory, or Treg cells. Two of the mixtures were absent of only basophils, four were absent of both basophils and CD4 memory cells, two were absent of both basophils and Treg cells, and two were absent of only Treg cells [Citation31]. Of the 144 cell proportions for this dataset (144 = 12 samples × 12 cell types), 16 of them were truly zero. A visualization of the cell proportions for the 12 reconstructed samples can be found in Supplementary Figure 1. A description of the preprocessing and quality control steps applied to the reconstructed mixture methylation can be found elsewhere [Citation31].
Assessment of LoB, LoD & uncertainty in deconvolution estimates
To apply and assess the developed method, the cell-specific methylation reference matrix was first subset to only the CpGs contained in the Extended Reference Library, described previously [Citation31]. The methylation data profiled in whole blood (reconstructed mixtures) was also subset to only the CpGs contained in the Extended Reference Library. This results in matrices with CpGs. These datasets were subset to only those CpGs in the Extended Reference Library as these are the CpGs that will be used for deconvoluting the in silico mixtures. Next, N = 100 replicate in silico mixtures were generated to calculate the LoB and LoD using the datasets [Citation31]. For the purpose of these analyses,
and
because this a common choice when controlling for type 1 and 2 errors. As proof of principle of the LoB and LoD, CMD was also performed on the reconstructed mixtures using the Extended Reference Library. For the reconstructed mixtures that were truly missing a cell type, the deconvolution estimates for those samples were expected to be less than the LoB (and LoD) for that cell type. The sensitivity of the approach for estimating the LoB and LoD when the k-1 cell types are simulated was additionally examined using reference ranges for the 12 leukocyte subtypes in the Extended Reference Libraries [Citation40]. Specifically, the median of the reference ranges for each of the cell types was used to specify the concentration parameters for the Dirichlet distribution.
To illustrate the proposed bootstrap approach for quantifying uncertainty in deconvolution estimates, the reconstructed mixture samples described in Salas et al. were used Confidence limits were estimated for the mixtures using , B = 10,000 bootstrap samples and the
CpGs that make up the Extended Reference Library. Since there were 12 reconstructed mixtures that were deconvoluted, this yielded 144 bootstrap-estimated CIs. The 95% CIs were assessed by using the true cell proportions in the reconstructed mixtures to calculate coverage. As the true mixing proportions of each cell type were known for the reconstructed mixture dataset, coverage was calculated as the proportion of CIs that contained the true cell proportion. Since 95% bootstrap CIs were computed, coverage was expected to be around 95%.
Results
Limit of blank
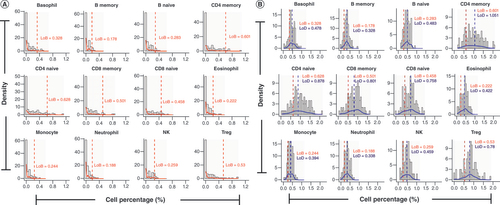
The LoB for DNAm-based deconvolution of whole blood was calculated for each of the 12 leukocyte cell types by generating N = 100 replicate in silico mixtures for each instance where a particular cell type was treated as the blank cell type. Results for the LoB are summarized in . Since estimates for the LoB did not appear to differ significantly across the various assumed Dirichlet concentration parameters (), we only discuss the results that were obtained using a concentration parameter of 73. Readers are referred to Supplementary Figures 2 & 3 for visualizations of the LoB results for Dirichlet concentration parameters equal to 18 and 128. Across all cell types, LoB estimates were less than 1% (). This means that for a given cell type, 95% of mixtures with a blank cell type resulted in deconvolution estimates that were less than 0.01. The smallest LoB across the 12 leukocyte cell types was 0.178% in B memory cells and the largest was 0.628% in CD4 naive cells. A shows the LoB estimates for each cell type as well as the distribution of deconvolution estimates across all the simulated in silico mixtures. Not surprisingly, the distribution of deconvolution estimates for the blank cell type is inflated at zero and heavily positively skewed (A). Similar results for the LoB were obtained when using reference ranges for the 12 leukocyte cell types. Readers are referred to Supplementary Table 1 for these results.
Table 1. Limit of blank results.
(A) Plots of deconvolution estimates for samples when each cell type is considered blank. The y-axis of these plots shows the density of the deconvolution estimates while the x-axis shows the deconvolution cell type percentages. The dashed red line represents the limit of blank for that cell type. (B) Plots of deconvolution estimates for the iteration at which the limit of detection is calculated. The y-axis of these plots shows the density of the deconvolution estimates while the x-axis shows the cell type percentages. The dashed red line represents the limit of blank for that cell type while the blue dashed line represents the limit of detection for that cell type.
Limit of detection
Results for the LoD are summarized in . As with the LoB, we only highlight the results that were obtained when in silico mixtures were created assuming a Dirichlet concentration parameter of 73 as the results were not appreciably different across the various assumed concentration parameters (). The smallest LoD across the 12 cell types was 0.328% in B memory cells and the largest was 1.051% in CD4 memory cells. Across all 12 cell types, LoD estimates were larger than the corresponding LoB estimate for that cell type, and for all but one cell type, CD4 memory cells (LoD = 1.051%), LoD estimates were less than 1%. This means that for mixtures comprised of these 12 leukocyte cell types, a cell type need only represent 1% or more of the mixture (1.051% in the case of CD4 memory cells) in order to be statistically distinguishable from the LoB for that cell type, and thus detectable through DNAm-based deconvolution. B shows the LoB and LoD estimates for each cell type as well as the distribution of deconvolution estimates across all the in silico mixtures for the iteration at which the LoD was determined. A visualization of the LoD estimates and deconvolution distributions for the other Dirichlet concentration parameters can be found in Supplementary Figures 2 & 3. Similar results for the LoD were obtained when using reference ranges for the 12 leukocyte cell types. Readers are referred to Supplementary Table 1 for these results.
Table 2. Limit of detection results.
As previously described, several of the reconstructed mixture samples were purposefully absent of one or two of the 12 leukocyte subtypes. Specifically, 16 out of the 144 cell-type proportions were truly zero. After deconvoluting the 12 reconstructed mixtures using the Extended Reference Library, we observed that, for all 16 such instances, deconvolution estimates were less than both the LoB and the LoD calculated for the respective cell types (results not shown).
Quantifying uncertainty in deconvolution estimates
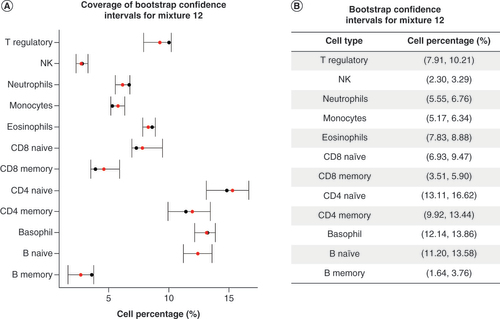
To illustrate the proposed approach for quantifying the uncertainty of DNAm-based deconvolution, we calculated 95% bootstrap CIs for each sample and each cell type in the reconstructed mixture dataset and calculated coverage as the percentage of CIs that included the ‘true’ reconstructed mixing proportion for a given sample and cell type. Of the 144 CIs constructed, 132 contained the ‘true’ reconstructed mixing proportion, meaning that coverage of 95% bootstrap CIs is approximately 92%. Coverage plots for one particular reconstructed mixture sample are given in A and a table with the cell-specific 95% bootstrap CIs for the same sample is shown in B. For this particular reconstructed mixture sample, all cell-specific 95% CIs contained the true cell type proportion. For this sample, the smallest CI width was 0.984% for NK cells, while the CI width for CD4 memory cells was approximately 3.52%. Across all 12 samples and 12 cell types, the average width of the 95% bootstrap CIs was 1.902%. Coverage plots and a table of the cell-specific 95% bootstrap CIs for the remaining 11 reconstructed samples can be found in Supplementary Figures 4–14.
(A) Coverage plot for bootstrap confidence intervals (CIs) estimated for representative reconstructed mixture. The y-axis shows the cell percentages while the x-axis shows the leukocytes the CIs are estimated for. The black point shows the true mixing proportion for each cell type for this sample and the red point shows the deconvolution estimate for each cell type for this sample. (B) A table of the CIs estimated for the same representative reconstructed mixture.
Discussion
This work described frameworks for both the estimation of LoDs and the quantification of uncertainty in the context of DNAm-based deconvolution. There are two primary motivations for this work. First, in the context of CMD, establishing the cell-specific LoD helps to judge the practical value of adding new cell types of low prevalence to existing reference libraries. If a given cell type has an LoD that is greater than the normal abundance found in a mixed biospecimen then it may not be advantageous to add that cell type to the reference library because deconvolution would yield nondetectable levels of that cell type. However, pathological conditions may lead to unanticipated cell distributions in affected individuals so that, ultimately, various factors come into play in designing expanded deconvolution repertoires. Second, as discussed previously, cell type ratios (e.g., neutrophil to lymphocyte ratio, CD4/CD8, etc.) are susceptible to extreme values when the cell type(s) in the denominator have deconvolution estimates that approach or are precisely equal to zero. LoD could help mitigate this issue by removing the need to impute arbitrary small numbers or to exclude the samples altogether. This paper additionally described how we quantified the uncertainty in CMD estimates by using nonparametric bootstrap estimated CIs. The utility of measuring uncertainty lies in DNAm studies in which CMD estimates are used as covariates in downstream statistical analyses. Treating these estimates as fixed and known could have potential implications for the model results.
Recall that the LoD for this research is defined as the smallest percentage of a cell type in whole blood that we can reliably distinguish from the LoB and at which we can detect when doing CMD. We built upon the work presented by Arbruster and Pry and utilized whole-blood methylation data on 12 leukocyte subtypes to simulate samples in which to calculate the deconvolution-based LoD [Citation30]. As shown in & B, the LoD values for all 12 cell types were small, with the largest being just over 1%. This suggests that these cell types only need to be present in whole-blood samples in small amounts to accurately deconvolute them. However, for some mixed biospecimens it is possible to have the proportion for some of these cell types fall below our LoD value. This issue could represent physiological or pathological adaptations of the immune system. Several innate immune cells (e.g., eosinophils and basophils) are normally present in very small proportions making transient physiological fluctuations (due to stress, thyroid and adrenal hormonal adaptations or exogenous steroid hormones) in some cases show cell counts that are undetectable for automated cell counts or flow cytometry [Citation41]. In pathological conditions, changes in other cell populations may affect the proportion of cells recovered and reduce the ability of both flow cytometry and DNAm to capture very small proportions of cell subsets; causes here include migration of lymphocytes to the tissues, infectious diseases and surgery observed in experimental murine and human models. An additional example is chronic lymphopenia, which increases mortality related to cardiovascular diseases and cancer [Citation18,Citation42]. In these cases, we need help to detect that some cell subtypes are present at all, resulting in an estimate of zero or some other extremely small values. If studying the actual cell proportion estimates is of interest, imputation of values may be necessary, or even removing the samples from our analysis. The LoD values we generated will allow samples that give us extreme deconvolution estimates to be retained and used to calculate cell type ratios or even model the deconvolution estimates themselves. One such method for analyzing compositional data, which was initially developed in the context of relative abundance measurements obtained from microbiome data, is called the analysis of the composition of microbiomes (ANCOM) [Citation23]. This method can be used for comparing the relative abundance of microbes across two or more conditions, similar to what we might wish to do with leukocyte deconvolution estimates. However, ANCOM utilizes log ratios in their calculations, so samples with estimates of zero would either need to be imputed or excluded from such analysis [Citation23].
To quantify uncertainty for methylation-based CMD, a nonparametric bootstrap approach was employed to obtain CIs for each sample and each cell type in which cell proportions are estimated. As shown in for one sample, CIs ranged from 1% wide to 3% wide and all the CIs contained the true mixing proportions. The uncertainty in the deconvolution estimates comes from the width of the CIs for each. For this sample, the largest CIs were for CD4 naive, CD4 memory, CD8 naive and CD8 memory cells, suggesting that these deconvolution estimates had the most uncertainty associated with them. Both naive CD4 and CD8 T cells are derived from a common lymphoid progenitor and undergo peripheral priming with antigen and the subsequent generation of memory and effector populations [Citation43]. Thus, CD4 and CD8 T naive and memory cells are closely related in cell lineage and, furthermore, our studies have shown that each cell type shares epigenetic programs that are involved in the naive-to-memory cell transition [Citation44]. Thus, uncertainty is expected to be greatest in discriminating closely related cells that share chromatin modifications in their terminal differentiation. When CMD estimates are used as covariates in downstream statistical analyses, having these measures of uncertainty will give us a better idea of how confident we can be in the results of our models.
While this research provides a framework to improve the field of reference-based DNAm deconvolution, these methods and this study are not without limitations. The datasets used to conduct this research only consisted of 12 leukocyte components, despite there being other cell types present in whole blood. While it would be useful to estimate the LoD for more leukocyte subtypes, this is currently infeasible since, to our knowledge, reliable reference libraries for deconvolution have not been developed for more than the cell types in the Extended Reference Library. Additionally, we only applied this method to methylation profiled in whole blood, however, the general approaches discussed herein can be applied to methylation profiled in any heterogeneous tissue. Also, while this research utilized data only from Illumina HumanMethylationEPIC array technology, our framework for estimating cell-specific detection limits and assessing the uncertainty associated with DNAm-based deconvolution is generalizable to other platforms (whole-genome bisulfite sequencing, Illumina HumanMethylation450 array, etc.). We also only provided explanations and tested the scenarios whereby one of the cell types is considered to be missing or in low proportion when we estimated the LoB and LoD. However, this method can easily be extended to scenarios where more than one cell type is found to be missing when deconvolution is performed. Specifically, one would simply require all cell types of interest to have proportion zero/be in low concentration while maintaining all other operating characteristics of the method. Another limitation of this work is that we only utilized the constrained projection/quadratic programming algorithm (i.e., the Houseman method) when performing CMD [Citation9]. We chose to use this approach for this research since it is one of the most widely used approaches in the field, but again note that the approach/framework described herein can be easily applied to any other reference-based deconvolution method [Citation9,Citation10,Citation12,Citation13]. It is also worth noting that we only applied our proposed method for calculating LoD values using simulated in silico mixtures. While it would have been preferable to also apply this method to a real biological dataset, this would have been cost-prohibitive and time-consuming. Notwithstanding this potential limitation, multiple steps were taken in an attempt to simulate whole-blood methylation data to closely emulate real data. An additional consideration is that the bootstrap estimated CIs represent a fully nonparametric approach. A more sophisticated method for estimating bootstrap CIs, like a semiparametric approach, could have been used. Semiparametric bootstrap methods involve simulating data to create bootstrap samples. In our case, the coverage of the CIs derived from a semiparametric bootstrap approach was worse using a nonparametric approach. While the coverage of our CIs was not quite 95%, we note that we calculated coverage using more stringent criteria. Generally, coverage of CIs is calculated by seeing if the estimated parameter of interest is contained within the limits, not the true parameter value as we did here. We expected our CIs would be lower than 95% and noted that the performance under this criteria was excellent. We additionally calculated the coverage of the CIs using the deconvolution estimates and reached 100% coverage under this framework. Finally, we did not formally assess how the uncertainty in our deconvolution estimates affects the downstream statistical analysis. There are methods to incorporate uncertainty in covariate measurements into such models (e.g., measurement error models) [Citation28,Citation29], however, using these is beyond the scope of this paper.
Conclusion
This research was motivated by the need to address extremely small or zero DNAm-based deconvolution estimates and the uncertainty associated with them. Future work includes applying these methods to larger datasets, and applying the methods to data obtained using different array technology and datasets with information on other cell types. We also plan to formally assess the effect of the uncertainty associated with deconvolution estimates obtained in this work on the analysis in EWAS by utilizing measurement error models. The proposed methods in this paper will remove arbitrary decisions of having to impute or extract samples from analyses, providing researchers with a mechanism for addressing the uncertainty of deconvolution estimates being used in statistical models. Furthermore, estimates of uncertainty for individual cell types can be integrated with other quality measures for deconvolution that focus on sample-level accuracy of derived cellular heterogeneity variables [Citation43,Citation45]. The goal of all these efforts is to improve the quantitative validity of DNAm-based deconvolution and EWAS investigations.
DNA methylation (DNAm)-based cell mixture deconvolution (CMD) has become a quintessential part of epigenome-wide association studies where DNAm is profiled in heterogeneous tissue types.
There are several issues associated with reference-based DNA methylation deconvolution that should be considered, including that CMD may result in estimates of zero (or very close to zero) for one or more cell types in a mixed or heterogeneous biospecimen when they are present in the sample.
Despite being introduced over a decade ago, detection limits, which represent the smallest fraction of a cell type in a mixed biospecimen that can be reliably detected, have yet to be determined in the context of DNAm-based CMD.
Deconvolution estimates are also subject to uncertainty, which is often ignored when such estimates are treated as covariates in downstream regression models that aim to control for confounding.
This work sought to create systematic analytical frameworks for determining both cell-specific limits of detection and for the quantification of uncertainty associated with DNAm-based CMD.
The proposed methods in this paper will remove arbitrary decisions of having to impute or extract samples from analyses, providing researchers with a mechanism for addressing the uncertainty of deconvolution estimates being used in statistical models.
Author contributions
S Bell-Glenn helped conceive the framework for calculating DNA methylation-based deconvolution detection limits and uncertainty, performed the statistical analyses to evaluate and assess the proposed framework and wrote the manuscript. LA Salas, AM Molinaro and BC Christensen helped direct the statistical analyses, contributed to the interpretation of study findings and assisted in manuscript writing and development. RA Butler participated in the processing of the samples used in this research, contributed to the interpretation of study findings and assisted in manuscript writing and development. KT Kelsey, JK Wiencke and DC Koestler provided guidance and direction in the evaluation and assessment of the method and assisted in manuscript writing and development.
Supplemental Figure
Download MS Word (2.2 MB)Acknowledgments
The authors would like to extend their gratitude to: Samuel Boyd, Whitney Shae, Jonah Amponsah, Emily Nissen, Alexander Alsup, Jeffrey Thompson, Nanda Yellapu and Dong Pei for their constructive feedback on this manuscript.
Supplementary data
To view the supplementary data that accompany this paper please visit the journal website at: www.tandfonline.com/doi/suppl/10.2217/epi-2023-0006
Financial & competing interests disclosure
The research reported here was supported by: the National Cancer Institute Cancer Center Support Grant P30 CA168524; the Kansas IDeA Network of Biomedical Research Excellence Bioinformatics Core, supported by the National Institute of General Medical Science award P20 GM103418; and the Kansas Institute for Precision Medicine COBRE, supported by the National Institute of General Medical Science award P20 GM130423. The authors have no other relevant affiliations or financial involvement with any organization or entity with a financial interest in or financial conflict with the subject matter or materials discussed in the manuscript apart from those disclosed.
No writing assistance was utilized in the production of this manuscript.
Data sharing statement
The R scripts for the analyses presented here are available at https://github.com/ShelbyBellGlenn/LoD-Code.
Additional information
Funding
References
- Rakyan VK , DownTA, BaldingDJ, BeckS. Epigenome-wide association studies for common human diseases. Nat. Rev. Genet.12(8), 529–541 (2011).
- Michels KB , BinderAM, DedeurwaerderSet al. Recommendations for the design and analysis of epigenome-wide association studies. Nat. Methods10(10), 949–955 (2013).
- Flanagan JM . Epigenome-wide association studies (EWAS): past, present, and future. Methods Mol. Biol.1238, 51–63 (2015).
- Adalsteinsson BT , GudnasonH, AspelundTet al. Heterogeneity in white blood cells has potential to confound DNA methylation measurements. PLOS ONE7(10), 1–9 (2012).
- Reinius LE , AcevedoN, JoerinkMet al. Differential DNA methylation in purified human blood cells: implications for cell lineage and studies on disease susceptibility. PLOS ONE7(7), e41361 (2012).
- Jaffe AE , IrizarryRA. Accounting for cellular heterogeneity is critical in epigenome-wide association studies. Genome Biol.15(2), R31 (2014).
- Liang L , CooksonWO. Grasping nettles: cellular heterogeneity and other confounders in epigenome-wide association studies. Hum. Mol. Genet.23(R1), R83–R88 (2014).
- Houseman EA , KimS, KelseyKT, WienckeJK. DNA methylation in whole blood: uses and challenges. Curr. Environ. Health Rep.2(2), 145–154 (2015).
- Houseman EA , AccomandoWP, KoestlerDCet al. DNA methylation arrays as surrogate measures of cell mixture distribution. BMC Bioinformatics13, 86 (2012).
- Newman AM , LiuCL, GreenMRet al. Robust enumeration of cell subsets from tissue expression profiles. Nat. Methods12(5), 453–457 (2015).
- Houseman EA , KileML, ChristianiDC, InceTA, KelseyKT, MarsitCJ. Reference-free deconvolution of DNA methylation data and mediation by cell composition effects. BMC Bioinformatics17, 259 (2016).
- Koestler DC , JonesMJ, UssetJet al. Improving cell mixture deconvolution by identifying optimal DNA methylation libraries (IDOL). BMC Bioinformatics17, 120 (2016).
- Teschendorff AE , BreezeCE, ZhengSC, BeckS. A comparison of reference-based algorithms for correcting cell-type heterogeneity in epigenome-wide association studies. BMC Bioinformatics18(1), 105 (2017).
- Titus AJ , GallimoreRM, SalasLA, ChristensenBC. Cell-type deconvolution from DNA methylation: a review of recent applications. Hum. Mol. Genet.26(R2), R216–R224 (2017).
- Decamps C , PriveF, BacherRet al. Guidelines for cell-type heterogeneity quantification based on a comparative analysis of reference-free DNA methylation deconvolution software. BMC Bioinformatics21(1), 16 (2020).
- Scherer M , NazarovPV, TothRet al. Reference-free deconvolution, visualization and interpretation of complex DNA methylation data using DecompPipeline, MeDeCom and FactorViz. Nat. Protoc.15(10), 3240–3263 (2020).
- Koestler DC , UssetJ, ChristensenBCet al. DNA methylation-derived neutrophil-to-lymphocyte ratio: an epigenetic tool to explore cancer inflammation and outcomes. Cancer Epidemiol. Biomarkers Prev.26(3), 328–338 (2017).
- Wiencke JK , KoestlerDC, SalasLAet al. Immunomethylomic approach to explore the blood neutrophil lymphocyte ratio (NLR) in glioma survival. Clin. Epigenetics9, 10 (2017).
- Grieshober L , GrawS, BarnettMJet al. Pre-diagnosis neutrophil-to-lymphocyte ratio and mortality in individuals who develop lung cancer. Cancer Causes Control32(11), 1227–1236 (2021).
- Grieshober L , GrawS, BarnettMJet al. Methylation-derived neutrophil-to-lymphocyte ratio and lung cancer risk in heavy smokers. Cancer Prev. Res.11(11), 727–734 (2018).
- Bell-Glenn S , ThompsonJA, SalasLA, KoestlerDC. A Novel Framework for the Identification of Reference DNA Methylation Libraries for Reference-Based Deconvolution of Cellular Mixtures. Front. Bioinform.2, doi:10.3389/fbinf.2022.835591 (2022).
- Nissen E , ReinerA, LiuSet al. Assessment of immune cell profiles among post-menopausal women in the Women’s Health Initiative using DNA methylation-based methods. Clin. Epigenetics15(1), 1–16 (2023).
- Mandal S , Van TreurenW, WhiteRA, EggesboM, KnightR, PeddadaSD. Analysis of composition of microbiomes: a novel method for studying microbial composition. Microb. Ecol. Health Dis.26, doi:10.3402/mehd.v26.27663 (2015).
- Chen JQ , SalasLA, WienckeJKet al. Immune profiles and DNA methylation alterations related with non-muscle-invasive bladder cancer outcomes. Clin. Epigenetics14(1), 14 (2022).
- Pum J . A practical guide to validation and verification of analytical methods in the clinical laboratory. Adv. Clin. Chem.90, 215–281 (2019).
- Croghan CW , EgeghyPP. Methods of dealing with values below the limit of detection using SAS. In: Presented at Southeastern SAS User Group.Environmental Protection Agency, FL, USA, 1–5 (2003).
- Palarea-Albaladejo J , Martin-FernandezJA. Values below detection limit in compositional chemical data. Anal. Chim. Acta764, 32–43 (2013).
- Nab L , van SmedenM, KeoghRH, GroenwoldRHH. Mecor: an R package for measurement error correction in linear regression models with a continuous outcome. Comput. Methods Programs Biomed.208, doi:10.1016/j.cmpb.2021.106238 (2021).
- Wang XF , WangB. Deconvolution estimation in measurement error models: the R package decon. J. Stat. Softw.39(10), i10 (2011).
- Armbruster DA , PryT. Limit of blank, limit of detection and limit of quantitation. Clin. Biochem. Rev.29(Suppl. 1), S49–S52 (2008).
- Salas LA , ZhangZ, KoestlerDCet al. Enhanced cell deconvolution of peripheral blood using DNA methylation for high-resolution immune profiling. Nat. Commun.13(1), 761 (2022).
- Browne RW , WhitcombBW. Procedures for determination of detection limits: application to high-performance liquid chromatography analysis of fat-soluble vitamins in human serum. Epidemiology21(Suppl. 4), S4–S9 (2010).
- Linnet K , KondratovichM. Partly nonparametric approach for determining the limit of detection. Clin. Chem.50(4), 732–740 (2004).
- Saadati M , BennerA. Statistical challenges of high-dimensional methylation data. Stat. Med.33(30), 5347–5357 (2014).
- Perrier F , NovoloacaA, AmbatipudiSet al. Identifying and correcting epigenetics measurements for systematic sources of variation. Clin. Epigenetics10, 38 (2018).
- Simas AB , Barreto-SouzaW, RochaAV. Improved estimators for a general class of beta regression models. Comput. Stat. Data Anal.54(2), 348–3 (2010).
- Cribari-Neto F , ZeileisA. Beta regression in R. J. Stat. Softw.34(2), 1–24 (2010).
- Meier R , NissenE, KoestlerDC. Low variability in the underlying cellular landscape adversely affects the performance of interaction-based approaches for conducting cell-specific analyses of DNA methylation in bulk samples. Stat. Appl. Genet. Mol. Biol.20(3), 73–84 (2021).
- Efron B , TibshiraniRJ. An Introduction to the Bootstrap.Chapman & Hall/CRC, NY, USA (1993).
- Nissen E , ReinerA, LiuSet al. Assessment of immune cell profiles among post-menopausal women in the Women’s Health Initiative using DNA methylation-based methods. Clin. Epigenetics15(1), 69 (2023).
- Juhlin L . Basophil and eosinophil leukocyted in various internal disorders. Acta Med. Scand.174, 249–254 (1963).
- Vaduganathan M , AmbrosyAP, GreeneSJet al. Predictive value of low relative lymphocyte count in patients hospitalized for heart failure with reduced ejection fraction: insights from the EVEREST trial. Circ. Heart Fail.5(6), 750–758 (2012).
- Kumar BV , ConnorsTJ, FarberDL. Human T cell development, localization, and function throughout life. Immunity48(2), 202–213 (2018).
- Zhang Z , ButlerR, KoestlerDCet al. Comparative analysis of the DNA methylation landscape in CD4, CD8, and B memory lineages. Clin. Epigenetics14(1), 173 (2022).
- Vellame DS , ShirebyG, MaccalmanAet al. Uncertainty quantification of reference-based cellular deconvolution algorithms. Epigenetics18(1), 1–15doi:10.1080/15592294.2022.2137659 (2023).