
Abstract
Aims: To investigate whether TET3 regulates hepatic stellate cell apoptosis and understand the role of demethylation in hepatic fibrosis (HF). Methods: LX-2T cells were infected with TET3 lentivirus. After TET3 adenovirus infection, the degree of HF in each group was analyzed. Chromatin immunoprecipitation was used to verify the targeting relationship between TET3 and CBP, and finally the expression of various proteins was detected. Results:TET3 overexpression activated the CBP/FOXO1–BIM pathway, increased the expression of apoptotic proteins and accelerated the apoptosis of activated LX-2 cells. The degree of HF was improved in the TET3 upregulation group. Conclusion: TET3 can activate the CBP/FOXO1–BIM pathway to accelerate the apoptosis of activated hepatic stellate cells and ultimately alleviate HF.
Hepatic fibrosis (HF) is a condition characterized by the abnormal growth of connective tissue within the liver, resulting from chronic injury caused by various factors [Citation1,Citation2]. Common clinical features of HF include fatigue and loss of appetite [Citation3,Citation4]. As the disease progresses, additional symptoms such as spider nevi, gingival bleeding and jaundice may manifest [Citation5,Citation6]. Prolonged exposure to the underlying damaging factors allows the fibrotic process to continue, eventually leading to the development of liver cirrhosis, which increases the risk of hepatocellular carcinoma [Citation7,Citation8]. Previous research has demonstrated that early-stage HF can be controlled or even reversed by treating the underlying viral infection [Citation9]. However, achieving reversal of advanced fibrosis is often more challenging and occurs less frequently [Citation10,Citation11]. Therefore a comprehensive understanding of the pathogenesis of HF and the development of effective prevention strategies are essential for addressing and potentially reversing chronic liver diseases.
Several studies have reported that the activation of hepatic stellate cells (HSCs) is a central event in the development of HF [Citation12,Citation13]. When the liver is exposed to various damaging factors, it undergoes cellular injury, inflammatory cell infiltration and the release of numerous cytokines [Citation14]. These cytokines can influence static HSCs, leading to their phenotypic transformation and subsequent activation into myofibroblasts [Citation15]. The activated HSCs release a significant amount of α-SMA, which contributes to the accumulation of extracellular matrix in the liver and drives the progression of HF [Citation16,Citation17]. The primary objective of this study was to investigate the regulatory mechanisms involved in HSC apoptosis, aiming to identify new potential interventions for the treatment of HF.
Previous studies have highlighted the association between DNA hypermethylation and the progression of HF [Citation18,Citation19]. DNA methylation can effectively promote the activation of HSCs, leading to their transdifferentiation into myofibroblasts and accelerating the progression of HF [Citation20,Citation21]. It has been reported that the progression of HF is influenced not only by DNA methylation mediated by DNA methyltransferases but also by DNA demethylation mediated by 10-11 translocation (TET) enzymes [Citation22]. Accumulating evidence suggests that the expression of 5-hydroxymethylcytosine (5hmC), an intermediate product of DNA demethylation, is positively correlated with the degree of demethylation in cells and tissues [Citation23,Citation24]. Recent studies have identified the expression of TET3, a demethylase, in the liver and other tissues [Citation25]. However, the biological functions and regulatory mechanisms of TET3 in the context of liver fibrosis are not well understood, and its specific molecular role remains unclear. Therefore our experimental study aimed to elucidate the potential role and mechanism of TET3 in the development and progression of HF.
In this study, the expression of TET3 was examined in human-activated HSCs and in a mouse model of HF. We aimed to explore the downstream target genes regulated by TET3. The primary objective was to investigate the regulatory effect of TET3-mediated DNA demethylation on apoptosis of human-activated HSCs and to understand the changes in DNA demethylation levels during the development of HF in mice. The ultimate goal was to provide new insights and establish a theoretical foundation for understanding the molecular regulatory mechanisms involved in the prevention and control of HF.
Materials & methods
Cell culture & activation
Human HSC line LX-2 cells were cultured at 37°C in 5% CO2 in Dulbecco’s modified Eagle medium (HyClone, UT, USA) supplemented with 10% fetal bovine serum (Gibco, NY, USA), 100 U/ml penicillin and 100 μg/ml streptomycin (HyClone).
LX-2 cells were treated with TGF-β (96100212, PeproTech, NJ, USA) solution at a concentration of 5 ng/ml for 24 h to establish the activated LX-2 cell model (LX-2T). The same volume of double-distilled water was added to the control group.
TET3 lentivirus infection
LX-2T cells were infected with lentivirus carrying TET3 overexpression. Lentivirus constructs with TET3 upregulation and TET3 upregulation negative control (NC) were obtained from GENE (Shanghai, China). The lentivirus was transfected into the cells and allowed to incubate for 72 h following the provided instructions. This process resulted in the generation of stable cell lines for subsequent experiments.
Real-time quantitative PCR
Total RNA was extracted from LX-2, LX-2T, TET3 upregulation and TET3 upregulation NC cells using TRIzol® reagent (TaKaRa, Tokyo, Japan). RNA was reverse-transcribed into cDNA using the Evo M-MLV RT Kit with gDNA Clean for qPCR reverse transcription (AG11705, Accurate Biotechnology, Hunan, China). A reaction system was prepared, and samples were added according to the manufacturer’s instructions for the TB Green Premix Ex Taq II (Tli RNaseH Plus) reagent (TaKaRa). GAPDH was used as the reference gene, and the quantitative primers were synthesized by the Accurate Biotechnology Company. Primer sequences are shown in .
Table 1. List of gene primer sequences.
Kyoto Encyclopedia of Genes & Genomes pathway enrichment analysis
The Kyoto Encyclopedia of Genes and Genomes is a widely used and comprehensive database that provides systematic analysis of gene function, genome information and proteome information. It offers a valuable resource for understanding various biological processes and pathways by integrating information on genes, proteins, pathways and diseases to provide a holistic view of how different molecules and biological processes interact and coordinate within living organisms. The KEGG PATHWAY option in the database was searched for the signaling pathway of interest, and then the target protein or gene was found in the signaling pathway.
Western blot analysis
Protein lysis buffer (Thermo Fisher Scientific, MA, USA) containing protease and phosphatase inhibitors (Roche, Basel, Switzerland) was added to the cells to extract total protein and determine protein concentration. SDS-PAGE gels (NCM, Suzhou, China) were used for protein separation, and polyvinylidene difluoride membranes (Millipore, MA, USA) were used for protein imprinting. The membrane was blocked with rapid blocking solution (NCM) for 10 min, using the following antibodies: TET3 (1:1000; GTX121453, GeneTex, Inc., CA, USA), FOXO1 (1:1000; ET1608-25, Hangzhou HuaAn Biotechnology Company, Hangzhou, China), BIM (1:1000; ET1608-14, Hangzhou HuaAn Biotechnology Company), GAPDH (1:10000; 66009-1-LG, Proteintech, IL, USA), BAX (1:1000; AB32503, Abcam, MA, USA), Bcl2 (1:1000; 3498T, Cell Signaling Technology, MA, USA), α-SMA (1:1000; ET1607-53, Hangzhou HuaAn Biotechnology Company), horseradish peroxidase-conjugated goat anti-rabbit IgG polyclonal antibody (1:10000; HA1001, Hangzhou HuaAn Biotechnology Company). After overnight incubation at 4°C, the secondary antibody was incubated for exposure.
Flow cytometry
Cells were digested using 2.5% pancreatic enzyme, 1 × 10⁶ cells were taken from each dish and suspended into a centrifuge tube, and then 50 μl human AB serum (HAB) reagent was added into each tube and thoroughly mixed. The mixture was left at room temperature for 10 min, then antibody was added to the corresponding tubes of each group for the immunolabeling reaction. After incubation at room temperature for 30 min, phosphate-buffered saline (pH 7.2–7.4) was used to clean each group for two or three times. Finally, each group was resuspended with buffer solution and mixed for machine testing. The degree of apoptosis was analyzed by flow cytometry. The results were further analyzed using flow cytometry (CytoFLEX, CA, USA) and software (Kaluza Analysis, Germany). All the above experiments were repeated at least three times.
Transmission electron microscopy
Ultrastructural changes in mitochondria and endoplasmic reticulum were detected by transmission electron microscopy in both groups of cells. Cells were fixed with 2.5% glutaraldehyde for 4 h after digestion and centrifugation, 1% osmium tetroxide for 30 min, dehydrated in graded ethanol and acetone, transferred to propylene oxide, then gradually embedded in epoxy resin (EPON 812, Beijing, China) for 2 days at 60°C. After embedding, 80-nm sections were collected using a diamond tissue knife (Diatome, Switzerland) on a Leica Ultracut E microtome (Leitz, Wetzlar, Germany), then mounted on copper mesh and stained with uranyl acetate and lead nitrate, double stained with uranyl acetate and lead citrate. The sections were observed with a JEM-1400 Flash electron microscope (JEOL, Tokyo, Japan).
Chromatin immunoprecipitation
The samples were crosslinked using a chromatin immunoprecipitation (ChIP) kit (Millipore) and treated with formaldehyde. Chromatin was cleaved into 400- to 500-bp fragments and then cleaved by ultrasound. The resulting fragments were evenly divided into two parts, one for ChIP using a CBP-specific antibody (Abcam) and the other for total input sample analysis, followed by immunoprecipitation of the target protein and its binding DNA fragments. Finally, DNA purification, protein–DNA complex de-crosslinking and DNA fragment isolation were performed. The immunoprecipitated DNA was quantified using RT-qPCR. PCR products were analyzed by agarose gel electrophoresis and then colored with ethidium bromide under UV light. DNA was purified by RT-qPCR analysis using TB Green Premix Ex Taq II (Tli RNaseH Plus, Takara, Tokyo, Japan). Cycle threshold (Ct) values for each ChIP DNA component were normalized to input DNA component Ct values for the same qPCR assay (ΔCt) to account for differences in chromatin sample preparation. The input percentage for each ChIP section is calculated as Input% = 2 (Ct input − Ct ChIP) × Fd × 100%, where Fd is the input dilution factor (1/20). Cells in the TET3 upregulation NC group were used as a negative control.
Cell 5hmC dot blotting
The DNA of each group was diluted at the same concentration with deionized water, then heated in a metal bath at 95°C for 5 min and centrifuged briefly before sampling, dried at room temperature for 15 min, then crosslinked by UV irradiation for 2 min. Then the nylon membrane was placed in the blocking solution (5% skim milk powder) and gently shaken on a horizontal shaker for 1 h at room temperature. Exposure was performed by incubating the secondary antibody using the 5 hmC antibody (1:10000; lot 23720003, Active Motif Company, CA, USA) overnight at 4°C.
Animal model construction & specimen collection
Modeling
Wild-type C57BL/J6 mice were purchased from the Model Animal Research Center of Guizhou Medical University (Guiyang, China). All animal experiments complied with the ARRIVE guidelines and the study was approved by the Ethics Committee of the Guizhou Medical University. Each cage of mice was provided with 100 g of fresh food and 250 ml of fresh water on a daily basis, ensuring regular changes of diet and water. The temperature in the experimental environment was maintained at 22 ± 2°C; the humidity level was maintained between 40 and 60%; and the light/dark cycle was repeated every 12 h. This experiment included an equal number of male and female mice, with each gender accounting for half of the total number of mice used.
A total of 30 healthy male and female C57 mice weighing approximately 25 g were used in this study. Following 1 week of adaptive feeding, the mice were randomly divided into the control group, HF model group (group M), recovery group, TET3 upregulation group and TET3 upregulation NC group, with six mice in each group.
All mice except for the control group were injected intraperitoneally with fresh 30% CCl4 in vegetable oil at a volume of 50 μl per 100 g of body weight. The mice in the control group were injected subcutaneously with the same volume of vegetable oil solution [Citation26]. After 9 weeks from the injection, C57 mice in both the control and M groups were euthanized. To better control the experiment and consider the liver’s self-healing ability, mice in the recovery group were allowed to recover and were fed for a period of 10–11 weeks. At 10–11 weeks, mice in the TET3 upregulation and TET3 upregulation NC groups, which had been successfully subjected to HF modeling, were injected with 1 × 10⁹/ml adenovirus via the caudal vein. The injection was carried out at a dose of 30 μl per 100 g body weight once every 4 days [Citation27]. After the adenovirus injections, mice from the recovery group, TET3 upregulation group and TET3 upregulation NC group were sacrificed 2 weeks later for further analysis or evaluation of the experimental outcomes.
Specimen collection
At the end of the ninth week, mice in the M and control groups were weighed and subsequently euthanized. At the end of the 11th week, the mice in the recovery, TET3 upregulation and TET3 upregulation NC groups were weighed and then sacrificed. Three small tissue samples of approximately 1 mm3 in size were extracted from the right lobe of the liver of each mouse. These tissue samples were then fixed in a 4% neutral formaldehyde solution, while the remaining liver tissue samples were stored at -80°C in a freezer for subsequent analysis.
Examination of liver tissue structure
After fixing the tissues with 4% neutral formaldehyde for 48 h, the tissues were transferred to 0.1 mol/l phosphate-buffered saline solution for preservation, and the sections were embedded in paraffin for hematoxylin and eosin and Masson staining. The pathological changes in the liver were observed under a light microscope.
Immunofluorescence of mouse liver tissues
The tissue immunofluorescence experiment was performed to localize 5hmC in mouse liver tissue from each group. The immunofluorescence kit was purchased from Lilai Biological Co., Ltd (Chengdu, China). The tissue sections were prepared, and the immunofluorescence staining procedure was conducted according to the kit’s instructions. Finally, the liver tissue sections from mice in each group were observed and photographed under a positive microscope.
Statistical analysis
All data are expressed as mean ± standard deviation. One-way analysis of variance was used for comparison between multiple groups, and Student’s test variance test was used for comparison between two groups. p < 0.05 was considered statistically significant.
Results
Activation of HSCs
Upregulated expression of α-SMA protein in activated LX-2 cells
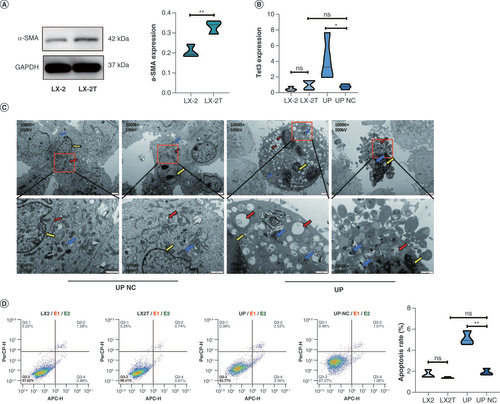
Following a 24-h treatment of quiescent LX-2 cells with a 5 ng/ml TGF-β solution, the cell proteins from both the LX-2 and LX-2T (TGF-β treatment) groups were extracted for western blotting. The results demonstrated a significant upregulation of α-SMA expression in the LX-2T group compared with the control-LX-2 group (A). These findings confirm the successful establishment of an in vitro model of HF through HSC activation, as indicated by the substantial increase in α-SMA expression within the LX-2T group.
(A) Expression of α-SMA protein in LX-2 and LX-2T (TGF-β) cells detected by western blotting. (B) The mRNA expression of TET3 in LX-2 and LX-2T. TET3 upregulation and TET3 upregulation NC groups was detected by RT-qPCR. (C) Transmission electron microscopy was used to observe cell tissue damage and apoptosis in TET3 upregulation and TET3 upregulation NC groups. Red arrow: endoplasmic reticulum; blue arrow: mitochondrial ridge; yellow arrow: perinuclear space. (D) Flow cytometry was used to detect cell apoptosis in each group.
*p < 0.05; **p < 0.01.
NC: Negative control.
Infection of LX-2T cells with TET3-overexpressing lentivirus
To investigate the regulatory role of TET3 in LX-2T cells, an upregulation assay of TET3 was performed on the activated HSCs (LX-2T group cell lines). First, LX-2T cells were infected with TET3 upregulation lentivirus for 72 h, and then subjected to puromycin screening. Next, RT-qPCR was employed to assess the expression levels of TET3 in LX-2, LX-2T, TET3 upregulation and TET3 upregulation NC cells. The results showed that the expression of TET3 in cells of the TET3 upregulation group was significantly higher than that in cells of the TET3 upregulation NC group. There were no significant differences in the expression levels of TET3 among cells of LX-2, LX-2T and TET3 upregulation NC groups (B). These findings from the study provide evidence of a successful infection with TET3 lentivirus.
Electron microscopic results of mitochondria & endoplasmic reticulum damage in TET3 upregulation & TET3 upregulation NC groups
Transmission electron microscopy was employed to examine the cells of both the TET3 upregulation and TET3 upregulation NC groups, revealing varying degrees of damage in the TET3 upregulation group cells. In contrast, the cells in the TET3 upregulation NC group exhibited an abundance of mitochondria and endoplasmic reticulum, with the endoplasmic reticulum showing a neat arrangement and a uniform perinuclear space around the nucleus. Comparatively, the TET3 upregulation group cells displayed noticeable characteristics such as mitochondrial swelling, degeneration of cristae, endoplasmic reticulum swelling, vacuolar structures, expansion of the perinuclear space around the nucleus, and cell lysis to varying extents (C).
Flow cytometry analysis of apoptosis in LX-2T cells after TET3 overexpression
Flow cytometry was employed to analyze the cells from the LX-2, LX-2T, TET3 upregulation and TET3 upregulation NC groups. The findings revealed a significant increase in apoptosis within the TET3 upregulation group compared with the TET3 upregulation NC group. In contrast, the apoptosis rate in the LX-2T group did not exhibit a significant difference when compared with the LX-2 group. Furthermore, no significant difference was observed between the TET3 upregulation NC and LX-2 groups (D). These results suggest that the demethylase TET3 may play a regulatory role in the apoptosis pathway, thereby influencing the apoptosis of activated HSCs (LX-2T).
Pathological results in mouse liver
The results of hematoxylin and eosin staining demonstrated that the control group exhibited a normal hepatic lobule structure, with hepatocytes arranged in a radial pattern around the central vein. The M group displayed inflammatory cell infiltration and hepatocyte steatosis. Similarly, the recovery group exhibited inflammatory cell infiltration and hepatocyte steatosis. In comparison to the TET3 upregulation NC group, mice in the TET3 upregulation group showed significant improvement in liver damage, with localized presence of minimal inflammatory cell infiltration and notable reduction in interlobular fibrosis and connective tissue. Inflammatory cell infiltration and prominent hepatocyte steatosis were observed in the livers of mice in the TET3 upregulation NC group (A).
(A) Hematoxylin and eosin staining: fibrous hyperplasia (green arrow), hepatocyte feathery degeneration (red arrow), hepatocyte necrosis (black arrow). (B) Masson stain: fibrous expression (yellow arrow).
***p < 0.001.
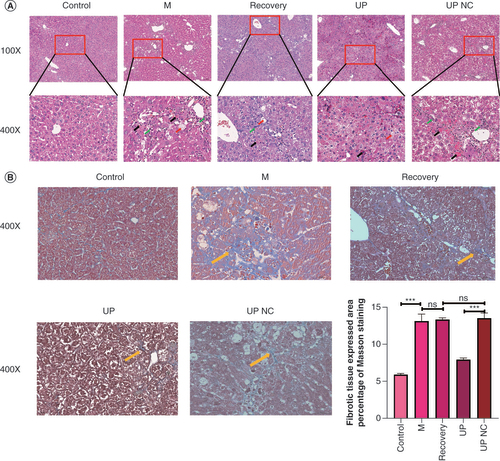
Furthermore, the results of Masson staining revealed that the liver tissue of normal mice displayed no apparent fibrous hyperplasia, while in the M group, a substantial amount of blue-stained collagen connective tissue was observed in the portal area of the liver tissue. Similarly, the recovery group displayed significant accumulation of collagen connective tissue in the portal area of the liver tissue. In the TET3 upregulation group, there was less proliferation of liver tissue fibers. Conversely, the TET3 upregulation NC group showed a significant presence of blue-stained collagen connective tissue in the portal area of the liver. The pathological grading results for HF indicated that the severity of fibrosis in the M group, recovery group and TET3 upregulation NC group was more pronounced, while the TET3 upregulation group exhibited a significant improvement in HF compared with the TET3 upregulation NC group (B).
Immunofluorescence detection of 5hmC protein expression in mouse liver tissues
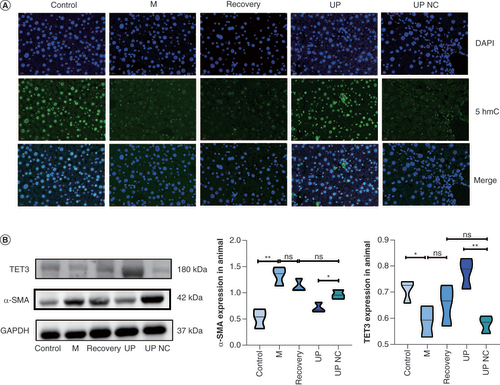
Recent research has provided evidence that TET3 is capable of effectively catalyzing the conversion of 5mC to 5hmC, and the expression of 5hmC is positively associated with the level of demethylation [Citation23]. Based on this knowledge, the present study employed tissue immunofluorescence technology to localize the 5hmC protein within mouse liver tissue, aiming to assess the demethylation level in each group of mice. The findings revealed that 5hmC was expressed in the liver, predominantly within the nuclei of liver cells. In comparison to the control group, the fluorescence expression of 5hmC in the liver tissue of mice in the M group appeared weaker, and the fluorescence expressions in the recovery group and TET3 upregulation NC group exhibited even weaker intensities. Conversely, the liver tissues of the TET3 upregulation group displayed a more robust fluorescence expression of 5hmC. These results strongly indicate the successful overexpression of adenovirus TET3 and demonstrate that the fluorescence expression of 5hmC decreases in the liver tissue of mice when HF occurs, thus providing further evidence for a reduction in demethylation levels in the presence of HF (A).
(A) Localization and expression of 5-hydroxymethylcytosine in the liver tissues of mice in the control, M, recovery, TET3 upregulation and TET3 upregulation negative control groups, as detected by tissue immunofluorescence. (B) Western blot analysis showing the protein levels of TET3 and α-SMA in the liver of mice in each group.
*p < 0.05; **p < 0.01.
Detection of TET3 & α-SMA protein levels in mouse liver tissues
Western blotting analysis revealed that the expression of TET3 protein in the liver of mice in the TET3 upregulation group was significantly higher compared with the TET3 upregulation NC group. Additionally, the expression of TET3 protein in the liver of mice in the control group was higher than that in the M group. However, there were no significant differences in the expression of TET3 protein in the liver among the M, recovery and TET3 upregulation NC groups. Furthermore, the expression of α-SMA protein in the liver of mice in the TET3 upregulation group was significantly lower than that in the TET3 upregulation NC group. Similarly, the expression of α-SMA protein in the liver of mice in the control group was significantly lower than that in the M group. However, no significant differences were observed in the expression of α-SMA protein in the liver among the M, recovery and TET3 upregulation NC groups (B). The findings of this study indicated that the expression of TET3 protein in the liver of mice with HF was reduced compared with that of normal mice. Moreover, the α-SMA index of HF was improved after intervention with TET3 adenovirus, suggesting that the overexpression of TET3 protein may exert a specific protective effect on the progression of HF.
TET3 targets CBP/FOXO1–BIM to mediate apoptosis
In our previous study, hydroxymethylated DNA immunoprecipitation sequencing (hMeDIP-Seq) analysis revealed that differential genes were enriched in apoptosis-related pathways after TET3 overexpression (A). Specifically, the adrenergic signaling pathway indicated that TET3 could regulate CBP (CREBBP) to mediate apoptosis (B). Previous research has demonstrated that CBP can reduce the transcriptional activity of FOXO1 by acetylation, thereby influencing the expression of FOXO1 gene in cells [Citation28]. We further confirmed the targeting relationship between CBP and FOXO1 through biogenic library screening (C) [Citation29]. To investigate the regulatory effect of TET3 on CREBBP transcription, ChIP analysis was performed. The results showed that TET3 could bind to four sites within the CREBBP promoter region (D).
(A) Kyoto Encyclopedia of Genes and Genomes bubble chart: X-axis represents count/numlnt, Y-axis represents term, bubble size represents count value, bubble color represents -log10 (p-value). (B) Adrenergic signaling in cardiomyocytes pathway. (C) The interaction between CBP and FOXO1 was analyzed based on the biological information base [Citation29]. (D) Chromatin immunoprecipitation revealed the targeting relationship between TET3 and CREBBP.
*p < 0.05; **p < 0.01; ****p < 0.0001.
![Figure 4. TET3 targets CBP/FOXO1–BIM to mediate apoptosis. (A) Kyoto Encyclopedia of Genes and Genomes bubble chart: X-axis represents count/numlnt, Y-axis represents term, bubble size represents count value, bubble color represents -log10 (p-value). (B) Adrenergic signaling in cardiomyocytes pathway. (C) The interaction between CBP and FOXO1 was analyzed based on the biological information base [Citation29]. (D) Chromatin immunoprecipitation revealed the targeting relationship between TET3 and CREBBP.*p < 0.05; **p < 0.01; ****p < 0.0001.](/cms/asset/77e55ae0-7c97-4f04-9f82-390df851d465/iepi_a_12324454_f0004.jpg)
Recent research has demonstrated that upregulation of FOXO1 can activate BIM and other apoptotic proteins, thereby promoting the progression of cell apoptosis [Citation30]. This finding has prompted us to delve deeper into the CBP/FOXO1–BIM apoptosis pathway.
Changes in CBP/FOXO1–BIM apoptosis pathway & α-SMA expression in LX-2T cells with TET3 overexpression
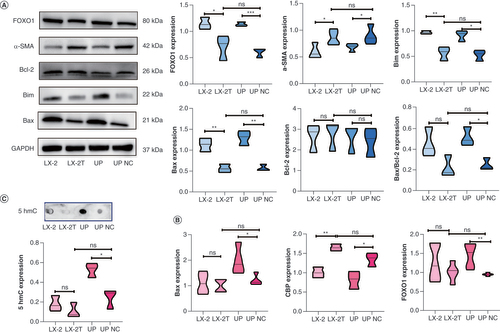
In cell experiments conducted based on the aforementioned experimental results, western blotting analysis revealed that the expressions of FOXO1 and apoptotic proteins BIM and BAX in the TET3 upregulation group were significantly higher compared with the TET3 upregulation NC group. Moreover, the expression of α-SMA protein in the TET3 upregulation group was significantly lower than in the TET3 upregulation NC group. Additionally, the expression of α-SMA protein in the LX-2T group was significantly higher than that in the LX-2 group, while the expressions of FOXO1, BIM and BAX were significantly lower than those in the LX-2 group. However, no significant differences were observed between the LX-2T group and the TET3 upregulation NC group. Furthermore, there were no significant differences in the expression of the antiapoptotic protein BCL2 among the groups (A). RT-qPCR analysis was conducted to assess the expressions of CREBBP, FOXO1 and BAX in the LX-2, LX-2T, TET3 upregulation and TET3 upregulation NC groups. The results demonstrated that the expression of FOXO1 and BAX in the TET3 upregulation group was significantly higher than in the TET3 upregulation NC group. However, no significant difference was observed between the TET3 upregulation NC group and the LX-2T group. Additionally, the expression of CREBBP in the TET3 upregulation group was significantly lower than that in the TET3 upregulation NC group, while there was no significant difference among LX-2, LX-2T and TET3 upregulation NC groups (p < 0.05) (B). The findings from cell 5hmC dot blot hybridization indicated that the expression of 5hmC in the TET3 upregulation group was significantly higher than that in the TET3 upregulation NC group, with no significant difference observed among the LX-2, LX-2T and TET3 upregulation NC groups (C). These results provide evidence that upregulation of TET3 expression in LX-2T cells can promote cell apoptosis. Moreover, it further suggests that TET3 regulates HSC apoptosis by mediating the CBP/FOXO1–BIM pathway.
(A) Expression levels of FOXO1, α-SMA, BCL2, BIM and BAX proteins in LX-2, LX-2T, TET3 upregulation and TET3 upregulation negative control groups, as detected by western blotting. (B) RT-qPCR was used to detect the mRNA expression levels of BAX, FOXO1 and CREBBP in each group. (C) The DNA methylation level of 5hmC in each group was detected by dot blot hybridization.
*p < 0.05; **p < 0.01; ***p < 0.001.
NC: Negative control.
Discussion
HF is a chronic condition characterized by abnormal connective tissue hyperplasia in the liver. Elevated expression of α-SMA protein is a standard diagnostic index in laboratory settings for HF [Citation31,Citation32]. Activated HSCs have been identified as the main source of extracellular matrix and are known to transition into proliferative, fibrogenic and contractile myofibroblasts, playing a central role in the development of HF [Citation33,Citation34]. Consequently, investigating the regulation of HSC apoptosis has emerged as a crucial strategy for preventing and treating HF in recent years [Citation35]. In the present study, we established an activated LX-2 cell model by treating LX-2 cells with TGF-β solution. Consistent with previous reports [Citation36,Citation37], we observed increased expression levels of α-SMA protein in LX-2T cells compared with normal human LX-2 HSCs.
Previous research has shown that DNA demethylation mediated by the demethylase TET3 is associated with the progression of liver diseases [Citation38]. Page et al. found no difference in the expression of TET3 in human liver tissues; however, the expression of TET3 in rat HF tissues was decreased, accompanied by a reduction in 5hmC, suggesting that TET3 may be involved in the occurrence and development of HF [Citation25]. In light of these findings, we conducted experiments where we overexpressed TET3 in LX-2T cells using lentivirus infection. Interestingly, we observed a significant increase in apoptosis in the TET3 upregulation group, suggesting that TET3 overexpression may impact cell survival pathways and contribute to the regulation of HF.
In our animal experiments, mice were randomly assigned to five groups: control group, model group, recovery group, TET3 upregulation group and TET3 upregulation NC group. Following the methods employed by other scholars [Citation39,Citation40], all groups except for the control group received intraperitoneal injections of a 30% CCl4 solution at a dosage of 50 μl/100 g. This injection was repeated until the liver fibrosis model was successfully established. Subsequently, the TET3 upregulation group and TET3 upregulation NC group mouse models were transfected with TET3 overexpressing and empty adenovirus, respectively, via tail vein injection. To account for potential variations resulting from liver self-repair, we also established a recovery group. In this group, normal saline was injected via the tail vein as a control for subsequent observations. Notably, we observed that the HF mice with TET3 overexpression exhibited a certain degree of improvement in the fibrotic condition, which is consistent with the results obtained from our cellular experiments.
To investigate the targeting relationship between TET3 and CBP, we conducted a ChIP experiment based on the previous hMeDIP-seq results from our research group [Unpublished Data]. The ChIP experiment confirmed that TET3 can bind to four specific sites in the CREBBP promoter region, which aligned with the sequencing results. This finding provides valuable insights into the upstream and downstream targeting relationship between TET3 and CBP, further supporting the regulatory role of TET3 in CBP-mediated processes.
CBP, also known as CREBBP, plays a crucial role in gene transcription regulation by integrating chromatin remodeling and transcription factor recognition [Citation41,Citation42]. It possesses histone acetyltransferase activity and interacts with various proteins in the transcription complex [Citation43–45]. As for the identified CBP protein, previous studies have shown that this protein can reduce its transcriptional activity through acetylation of FOXO1, thus affecting the expression of FOXO1 in cells. Matsuzaki et al. found that CBP could reduce the transcriptional activity of FOXO1 through FOXO1 acetylation, and further affect the apoptosis of cells regulated by FOXO1 [Citation46]. The apoptotic proteins, such as BIM and BAX, are recognized as critical proteins in the apoptosis pathway [Citation47,Citation48]. It has been reported that the upregulation of FOXO1 can lead to the activation of the proapoptotic protein BAX within the BCL2 family; this activation subsequently triggers the BAX/BCL2 apoptotic pathway, leading to enhanced apoptosis in human liver cancer cells [Citation49]. Other studies have also found that the autophagy regulator AMBRA1 can regulate the apoptosis of breast cancer cells through the Akt–FOXO1–BIM pathway. Upon Akt activation, AMBRA1 increases the expression of FOXO1, which in turn stimulates the expression of the apoptotic protein BIM, thereby promoting apoptosis in breast cancer cells [Citation50].
In this study, we found that TET3 could target CREBBP and inhibit its promoter activation by downregulating its expression. In contrast, the reduction of CREBBP expression led to the reduction of FOXO1 acetylation and enhanced transcriptional activity. Subsequently, due to the increased expression of FOXO1, the expression of downstream apoptotic proteins BIM and BAX significantly increased, resulting in cell apoptosis.
The above results proved the targeting relationship between CBP and the demethylase TET3. TET3 increased the demethylation level of CREBBP, while decreased the expression of CBP. Subsequently, the decreased expression of CBP led to an increase in the expression of FOXO1 and apoptotic proteins, thus activating the apoptosis of HSCs, which is consistent with our hypothesis. Although our study provides experimental support for the theory that the demethylase TET3 regulates apoptosis of activated HSCs through the CBP–FOXO1–BIM/BAX pathway, it remains unknown whether TET3 regulates and activates apoptosis of HSCs through alternative pathways. Therefore, our findings need to be further verified in liver tissues of patients with HF to better clarify the role and mechanism of TET3 in HF.
Conclusion
In conclusion, our study indicates that the overexpression of TET3 has a positive impact on CCl4-induced liver fibrosis in mice. This beneficial effect appears to be associated with a reduction in CREBBP expression mediated by TET3 demethylation. Consequently, the apoptosis of activated HSCs is promoted through the FOXO1–BIM/BAX pathway. The identification of this novel mechanism holds promising implications and may offer new insights and strategies for the prevention and treatment of HF.
Hepatic fibrosis (HF) is a condition characterized by the abnormal growth of connective tissue in the liver due to chronic injury from various factors. As the disease progresses, additional symptoms such as spider nevi, gingival bleeding and jaundice may manifest.
As a member of the 10–11 translocation protein family of demethylases, TET3 plays a significant role in the DNA demethylation modification of target genes.
In this study, we aimed to investigate whether overexpression of TET3 could ameliorate HF in mice. Specifically, we focused on exploring the potential regulatory mechanism of TET3 through the induction of apoptosis in activated hepatic stellate cells.
Our findings indicate that overexpression of TET3 effectively improves CCl4-induced HF in mice.
This beneficial effect may be attributed to the downregulation of CBP expression through TET3-mediated demethylation, which leads to increased apoptosis of activated hepatic stellate cells via the FOXO1–BIM/BAX pathway.
The identification of this novel regulatory mechanism provides valuable insights and potential strategies for the prevention and treatment of HF.
Author Contributions
R Liu: conceptualization, methodology, writing (original draft). R Liu, L Feng: formal analysis, resources, investigation. R Liu, S Tang: formal analysis, visualization, data curation. Q Yang: validation, supervision, writing (review and editing).
Ethical conduct of research
All animal experiments complied with the ARRIVE guidelines and were approved by the Ethics Committee of the Guizhou Medical University.
Acknowledgments
The authors would like to express their gratitude to EditSprings (www.editsprings.cn) for the expert linguistic services provided.
Financial & competing interests disclosure
This work was funded by the National Natural Sciences Foundation of China (no. 81560105). The authors have no other relevant affiliations or financial involvement with any organization or entity with a financial interest in or financial conflict with the subject matter or materials discussed in the manuscript apart from those disclosed.
No writing assistance was utilized in the production of this manuscript.
Additional information
Funding
References
- Roehlen N , CrouchetE , BaumertTF. Liver fibrosis: mechanistic concepts and therapeutic perspectives. Cells9(4), 875 (2020).
- Kisseleva T , BrennerD. Molecular and cellular mechanisms of liver fibrosis and its regression. Nat. Rev. Gastroenterol. Hepatol.18(3), 151–166 (2021).
- Shen WJ , ChenG , WangM , ZhengS. Liver fibrosis in biliary atresia. World J. Pediatr.15(2), 117–123 (2019).
- Campos-Murguía A , Ruiz-MargáinA , González-RegueiroJA , Macías-RodríguezRU. Clinical assessment and management of liver fibrosis in non-alcoholic fatty liver disease. World J. Gastroenterol.26(39), 5919–5943 (2020).
- Caligiuri A , GentiliniA , PastoreM , GittoS , MarraF. Cellular and molecular mechanisms underlying liver fibrosis regression. Cells10(10), 2759 (2021).
- Smith A , BaumgartnerK , BositisC. Cirrhosis: diagnosis and management. Am. Fam. Physician100(12), 759–770 (2019).
- Hernandez-Gea V , FriedmanSL. Pathogenesis of liver fibrosis. Annu. Rev. Pathol.6, 425–456 (2011).
- Affo S , YuLX , SchwabeRF. The role of cancer-associated fibroblasts and fibrosis in liver cancer. Annu. Rev. Pathol.12, 153–186 (2017).
- Altamirano-Barrera A , Barranco-FragosoB , Mendez-SanchezN. Management strategies for liver fibrosis. Ann. Hepatol.16(1), 48–56 (2017).
- Schuppan D , Ashfaq-KhanM , YangAT , KimYO. Liver fibrosis: direct antifibrotic agents and targeted therapies. Matrix Biol.68-69, 435–451 (2018).
- Ginès P , KragA , AbraldesJG , SolàE , FabrellasN , KamathPS. Liver cirrhosis. Lancet398(10308), 1359–1376 (2021).
- Zhang M , Serna-SalasS , DambaT , BorghesanM , DemariaM , MoshageH. Hepatic stellate cell senescence in liver fibrosis: characteristics, mechanisms and perspectives. Mech. Ageing Dev.199, 111572 (2021).
- Zhang J , LiY , LiuQet al. Sirt6 alleviated liver fibrosis by deacetylating conserved lysine 54 on Smad2 in hepatic stellate cells. Hepatology73(3), 1140–1157 (2021).
- Chang J , LanT , LiCet al. Activation of Slit2-Robo1 signaling promotes liver fibrosis. J. Hepatol.63(6), 1413–1420 (2015).
- Xiang D , ZouJ , ZhuXet al. Physalin D attenuates hepatic stellate cell activation and liver fibrosis by blocking TGF-β/Smad and YAP signaling. Phytomedicine78, 153294 (2020).
- Bataller R , BrennerDA. Liver fibrosis. J. Clin. Invest.115(2), 209–218 (2005).
- Parola M , PinzaniM. Liver fibrosis: pathophysiology, pathogenetic targets and clinical issues. Mol. Aspects Med.65, 37–55 (2019).
- Zhu H , ZhaoH , XuSet al. Sennoside A alleviates inflammatory responses by inhibiting the hypermethylation of SOCS1 in CCl4-induced liver fibrosis. Pharmacol. Res.174, 105926 (2021).
- Fan C , MaY , ChenSet al. Comprehensive analysis of the transcriptome-wide m6A methylation modification difference in liver fibrosis mice by high-throughput m6A sequencing. Front. Cell Dev. Biol.9, 767051 (2021).
- Xue T , QiuX , LiuHet al. Epigenetic regulation in fibrosis progress. Pharmacol. Res.173, 105910 (2021).
- Moran-Salvador E , MannJ. Epigenetics and liver fibrosis. Cell. Mol. Gastroenterol. Hepatol.4(1), 125–134 (2017).
- Chen LL , MorcelleC , ChengZLet al. Itaconate inhibits TET DNA dioxygenases to dampen inflammatory responses. Nat. Cell Biol.24(3), 353–363 (2022).
- Wu X , ZhangY. TET-mediated active DNA demethylation: mechanism, function and beyond. Nat. Rev. Genet.18(9), 517–534 (2017).
- Shi DQ , AliI , TangJ , YangWC. New insights into 5hmC DNA modification: generation, distribution and function. Front. Genet.8, 100 (2017).
- Page A , PaoliP , MoranSalvador E , WhiteS , FrenchJ , MannJ. Hepatic stellate cell transdifferentiation involves genome-wide remodeling of the DNA methylation landscape. J. Hepatol.64(3), 661–673 (2016).
- Tsuchida T , LeeYA , FujiwaraNet al. A simple diet- and chemical-induced murine NASH model with rapid progression of steatohepatitis, fibrosis and liver cancer. J. Hepatol.69(2), 385–395 (2018).
- Zhang L , ZhangZ , LiCet al. S100A11 promotes liver steatosis via FOXO1-mediated autophagy and lipogenesis. Cell. Mol. Gastroenterol. Hepatol.11(3), 697–724 (2021).
- Tsitsipatis D , GopalK , SteinbrennerH , KlotzLO. FOXO1 cysteine-612 mediates stimulatory effects of the coregulators CBP and PGC1alpha on FOXO1 basal transcriptional activity. Free Radic. Biol. Med.118, 98–107 (2018).
- Fabregat A , SidiropoulosK , ViteriGet al. Reactome diagram viewer: data structures and strategies to boost performance. Bioinformatics34(7), 1208–1214 (2018).
- Liang Y , CaoD , LiY , LiuZ , WuJ. MicroRNA-302a is involved in folate deficiency-induced apoptosis through the AKT-FOXO1–Bim pathway in mouse embryonic stem cells. Nutr. Metab. (Lond.)17(1), 103 (2020).
- Cordero-Espinoza L , HuchM. The balancing act of the liver: tissue regeneration versus fibrosis. J. Clin. Invest.128(1), 85–96 (2018).
- Gäbele E , DostertK , HofmannCet al. DSS induced colitis increases portal LPS levels and enhances hepatic inflammation and fibrogenesis in experimental NASH. J. Hepatol.55(6), 1391–1399 (2011).
- Tsuchida T , FriedmanSL. Mechanisms of hepatic stellate cell activation. Nat. Rev. Gastroenterol. Hepatol.14(7), 397–411 (2017).
- Pastore M , CaligiuriA , RaggiCet al. Macrophage MerTK promotes profibrogenic cross-talk with hepatic stellate cells via soluble mediators. JHEP Rep.4(4), 100444 (2022).
- Lee SW , KimSM , HurWet al. Tenofovir disoproxil fumarate directly ameliorates liver fibrosis by inducing hepatic stellate cell apoptosis via downregulation of PI3K/Akt/mTOR signaling pathway. PLOS ONE16(12), e0261067 (2021).
- Mederacke I , HsuCC , TroegerJSet al. Fate tracing reveals hepatic stellate cells as dominant contributors to liver fibrosis independent of its aetiology. Nat. Commun.4, 2823 (2013).
- Rippe RA , BrennerDA. From quiescence to activation: gene regulation in hepatic stellate cells. Gastroenterology127(4), 1260–1262 (2004).
- Li Y , WuB , SunR , ZhaoM , LiN. miR-93-5p knockdown repressed hepatocellular carcinoma progression via increasing ERBB4 and TETs-dependent DNA demethylation. Autoimmunity54(8), 547–560 (2021).
- Wu H , ChenG , WangJ , DengM , YuanF , GongJ. TIM-4 interference in Kupffer cells against CCL4-induced liver fibrosis by mediating Akt1/Mitophagy signalling pathway. Cell Prolif.53(1), e12731 (2020).
- Yanguas SC , CogliatiB , WillebrordsJet al. Experimental models of liver fibrosis. Arch. Toxicol.90(5), 1025–1048 (2016).
- Huang YH , CaiK , XuPPet al. CREBBP/EP300 mutations promoted tumor progression in diffuse large B-cell lymphoma through altering tumor-associated macrophage polarization via FBXW7-NOTCH-CCL2/CSF1 axis. Signal Transduct. Target. Ther.6(1), 10 (2021).
- Jia D , AugertA , KimDWet al. CREBBP loss drives small cell lung cancer and increases sensitivity to HDAC inhibition. Cancer Discov.8(11), 1422–1437 (2018).
- Dutta R , TiuB , SakamotoKM. CBP/p300 acetyltransferase activity in hematologic malignancies. Mol. Genet. Metab.119(1–2), 37–43 (2016).
- He ZX , WeiBF , ZhangX , GongYP , MaLY , ZhaoW. Current development of CBP/p300 inhibitors in the last decade. Eur. J. Med. Chem.209, 112861 (2021).
- Zhang W , BertheletJ , MichailCet al. Human CREBBP acetyltransferase is impaired by etoposide quinone, an oxidative and leukemogenic metabolite of the anticancer drug etoposide through modification of redox-sensitive zinc-finger cysteine residues. Free Radic. Biol. Med.162, 27–37 (2021).
- Matsuzaki H , DaitokuH , HattaM , AoyamaH , YoshimochiK , FukamizuA. Acetylation of Foxo1 alters its DNA-binding ability and sensitivity to phosphorylation. Proc. Natl Acad. Sci. USA102(32), 11278–11283 (2005).
- Tang Q , ChenH , MaiZet al. Bim- and Bax-mediated mitochondrial pathway dominates abivertinib-induced apoptosis and ferroptosis. Free Radic. Biol. Med.180, 198–209 (2022).
- Azam S , KimIS , ChoiDK. α-Synuclein upregulates BIM-mediated apoptosis by negatively regulating endogenous GCN5. Aging (Albany NY)14(20), 8292–8301 (2022).
- Jiang J , HuangZ , ChenXet al. Trifluoperazine activates FOXO1-related signals to inhibit tumor growth in hepatocellular carcinoma. DNA Cell Biol.36(10), 813–821 (2017).
- Sun WL , HeLY , LiangLet al. Ambra1 regulates apoptosis and chemosensitivity in breast cancer cells through the Akt–FoxO1–Bim pathway. Apoptosis27(5–6), 329–341 (2022).