
Tweetable abstract
Monitoring changes in methylation heterogeneity can be powerful in detecting disease progression early. This editorial highlights the importance of profiling methylation heterogeneity and identifies existing measures and research gaps.
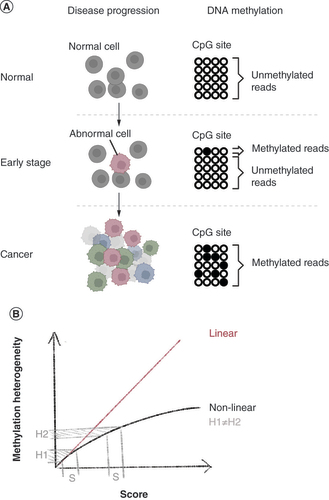
DNA methylation heterogeneity describes the degree of variation in methylation status at a specific genomic locus between cells. The higher the methylation heterogeneity of a cell population, the less uniform the DNA methylation patterns are between individual cells. Methylation heterogeneity has been shown to be another marker for disease progression (A), in addition to genetic mutation, gene expression changes and clinical phenotypes. For example, a comparative epigenomic study of acute myeloid leukemia samples at serial time points showed that changes in methylation heterogeneity were linked to perturbance of transcriptional regulation and then later increased disease aggressiveness [Citation1]. In large diffuse B-cell lymphoma, relapsed patients displayed higher within-tumor methylation heterogeneity than nonrelapsed patients [Citation2]. A large survey of 928 cancer cell lines showed that genes with methylation heterogeneity in promoter regions are associated with metastatic potential [Citation3]. Methylation heterogeneity is also captured in stem cells to trace cell lineages through identifying differentially methylated elements during embryonic development [Citation4,Citation5]. These findings pointed toward the significance of methylation heterogeneity in elucidating biological processes, particularly pathological conditions, and prompted increasing development of approaches to detect this metric.
(A) DNA methylation heterogeneity for monitoring disease progression (created with BioRender.com). (B) Linear and nonlinear scores in measuring DNA methylation heterogeneity.
Computationally measuring methylation heterogeneity in pooled cell samples
The measurement of methylation heterogeneity may generally be achieved in two ways: one is to isolate single cells from the tissue of interest and perform methylation sequencing for each cell (‘scBS-seq’) [Citation5,Citation6], and the other is to apply computational methods that can differentiate the methylation status of subpopulations onto methylation sequencing data of bulked cells (i.e., a tissue of interest where many cells are pooled together). Bulked-cells methylation sequencing is still the general practice to date, where one single measurement is assumed to represent the methylation status of one cytosine for millions of cells. Successful implementation of computational methods is radical, because it means that all existing bulked-cell datasets are now available to be further dissected for heterogeneity. For example, reanalysis of existing methylation data from tumor tissues can increase the profiling resolution from averaged to cell-type or subpopulation-specific methylation values. These discoveries can provide better predictions for hypothesis formulation prior to the use of single-cell technology, which is still technically challenging and costly.
Xie et al. first proposed adopting the concept of Shannon entropy as an indicator for stochastic methylation changes [Citation7]. ‘Methylation entropy’ essentially measures the randomness of the distribution of DNA methylation patterns observed for a genomic locus. Another method named ‘epipolymorphism’ assesses the methylation heterogeneity of a locus through the probability that two randomly sampled reads in the population contain different epialleles [Citation8]. Both of these earliest methods identify blocks of four adjacent CpGs and count the frequency of each possible permutation of methylation patterns per block (i.e., epialleles). Other methods have employed the concordance of the methylation status either between reads or between neighboring CpGs on the same read. Proportion of discordant reads (PDR) measures the proportion of methylated and unmethylated CpGs in reads per specific locus [Citation9], whereas fraction of discordant read pairs (FDRP) measures heterogeneity at single-CpG resolution using read pairs [Citation10]. In order to better quantify the numbers and proportions of each unique pattern, another approach utilizes read-clustering of identical methylation patterns per bin to represent each specific subpopulation [Citation11].
Here we discuss three main characteristics that affect the strengths and weaknesses of these methods. First, the consideration of neighboring CpGs. Entropy, epipolymorphism and PDR account for adjacent CpGs, either within a fixed window or within a read. This is advantageous as it means that the permutations of methylation statuses of CpG stretches are calculated and included as patterns. Second, splitting genomic regions into windows. Entropy and epipolymorphism are two window-based methods that calculate heterogeneity for every four consecutive CpGs. The drawback of this approach is that regions with low CpG density are neglected. Third, read-length dependency. PDR only considers reads that have four consecutive CpG, while FDRP has strict classification of pairwise disagreement of reads, therefore causing both methods to lose resolution in short-read data. A recent systemic evaluation compared a few major methods (entropy, epipolymorphism, methylation haplotype load [MHL] [Citation9], PDR, quantitative FDRP [qFDRP] and FDRP) and showed that different algorithms capture different simulated scenarios of heterogeneity [Citation10]. Epipolymorphism, entropy, FDRP and qFDRP were shown to be accurate in capturing cellular contamination, allele-specific methylation and cell-type heterogeneity, whereas PDR has high discriminatory power in DNA methylation erosion (i.e., the loss of methylation in a random manner). The consistency of the methods was also tested with technical setup biases such as read coverage and sequencing errors. MHL and qFDRP were concluded to be least affected by the biases, and are both able to tolerate up to a 5% sequencing error rate (the average error rates of short-read Illumina and long-read Nanopore are <1 and 7%, respectively) [Citation12,Citation13]. In general, these methods provide relatively straightforward frameworks to quantify methylation heterogeneity in bulked cells.
Limitations of current scoring systems
We would like to point out a few other limitations that are, in our opinion, significant. Based on our survey, the scoring systems that are adopted by the current methods are less than ideal. The first issue that we noticed is that none of the scores are able to faithfully describe heterogeneity in a linear manner. Making use of the experiment carried out in this recent evaluation, we observed that the heterogeneity score does not increase linearly as simulated patterns increase. For example, in the case of epipolymorphism, zero pattern was scored 0, two patterns was scored 0.5, and six patterns was scored 0.83. Linearly speaking, if an increment of two patterns = 0.5, then an increment of four patterns (from two to six) should equal the double of 0.5. This nonlinearity is observed across all the methods tested in this experiment. The failure to score linearly fails to report the difference of heterogeneity in two loci with the same difference in score (B). This complicates intuitive interpretation, introduces bias and prevents direct comparison of heterogeneity across loci. In our opinion, scoring linearity is an important principle to be adhered to when measuring the degree of variability in a population.
We think that the scoring system also has an issue of confounding methylation heterogeneity scoring with methylation level. One of the more extreme examples is observed in the estimation of MHL, which has low specificity, high background noise and the tendency to reflect methylation levels [Citation10]. Methylation level in and of itself is an informative measurement for the amount of methylated cytosines [Citation14], while methylation heterogeneity describes the variability of the pattern of level. These two metrics provide two layers of information that may complement each other but are not necessarily similar. Plotting relationships between methylation level and methylation heterogeneity has consistently shown that heterogeneity peaks in regions that are moderately methylated [Citation8,Citation9,Citation15]. In other words, heterogeneity is less likely to be found in regions that are either unmethylated or fully methylated. This relationship might be contributed by a widespread feature in cancer methylomes termed partially methylated domains, which are contiguous, heterochromatic regions of highly disordered methylation levels that are associated with inactive gene transcription [Citation16]. These interesting regions of high heterogeneity are at risk of being completely overlooked when using methods that give more weight to extreme methylation levels.
Patterns of methylation similarities are not considered
The level of similarity between distinct methylation patterns is not taken into account in some of the current methods (all except MHL and qFDRP). Treating each pattern as one distinct cell type causes a loss of resolution in the potential relationships between subpopulations. For example, one of the sources of heterogeneity is DNA methylation erosion, where cancer or aging cells undergo methylation changes in a stochastic process [Citation17,Citation18]. Indeed, methylation erosion was shown to be estimated with the lowest reliability out of all simulated scenarios using current methods [Citation10]. This experimental outcome matches with our concern that the current methods might be less sensitive in detecting slight heterogeneity changes, making it difficult to track and capture intramolecular changes. Algorithms that take neighboring CpG status into account and consider the probabilities of each permutation might help mitigate this issue.
Further deciphering transcriptional regulation
One main topic of interest is the role of methylation heterogeneity in regulating gene expression. For example, it is known that promoters with high methylation levels are linked to downregulation of genes, but does this relationship stay the same with methylation heterogeneity? High methylation heterogeneity of a group of embryonic development promoters has been demonstrated to be associated with differential gene expression levels even when the methylation level remained comparably similar in multiple myeloma cells [Citation15]. Methylation heterogeneity needs to be quantified in other regulatory elements in order to fully decipher its role in gene regulation. Enhancers are another group of regulatory regions that work similarly with promoters to facilitate binding of transcription factors. As enhancers are found at loci of low methylation, yet their activities remotely activate the expression of the neighboring genes, it would be interesting to measure whether enhancers display any methylation heterogeneity, and if so, how it correlates with heterogeneity at promoters. Similarly, this question can be extended to gene body and transposable elements. These insights can together shed light on questions that cannot be answered with averaged methylation levels alone, such as whether small methylation variability can be quantified (e.g., emergence of specific methylation patterns) before significant differential methylation or gene expression level changes are observed. This would be particularly informative in studies that involve progression, such as disease and embryonic development [Citation19].
Imputation supports the usage of heterogeneity methods
One of the limitations for majority of the bulked-cells analysis tools, methylation heterogeneity algorithms included, is insufficient read coverage. Imputation methods had been proposed to effectively resolve this [Citation11,Citation20]. A quick survey on the Short Read Archive retrieved 3973 human cancer whole-genome methylation samples with an average coverage of seven-times. Only 14% of the samples were being sequenced to more than ten-times, which is the minimum total read depth requirement for a few methylation heterogeneity estimation methods [Citation10]. This requirement is unavoidable as most of the methods account for read counts and relative proximity of neighboring methylated cytosines. Making use of the high correlation of methylation values among approximate cytosines [Citation21], imputation tools are designed to learn from existing reads and statistically infer ‘missing’ data [Citation22]. BSImp, for example, showed an improvement of 15% in coverage of methylation level for imputed eight-times data, with nearly 90% of the methylation statuses accurately imputed [Citation20].
Applications in previously unexplored territories
Methylation heterogeneity methods can be applied to bridge several long-standing research gaps. An exciting application is to profile methylation heterogeneity of highly complex genomic regions, such as centromeres and complex structural variants, with the use of long-read technology. With the advancement of long-read technology in sequencing accuracy, read length, epigenetic mark calling and phasing, researchers can soon characterize heterogeneity of epihaplotypes in species of interest. To broaden their usage, methylation heterogeneity methods can also be extended to cover non-CG contexts. Methylation in CHG and CHH contexts has been shown to play crucial roles in gene regulation in plants, while the degree of heterogeneity of these contexts in key areas such as plant development, crop breeding and domestication remains unknown. With increasing interest in methylation heterogeneity, we also expect bioinformatic approaches that incorporate both methylation level and methylation heterogeneity as joint analysis to be devised for future studies.
In this Editorial, we highlight methylation heterogeneity as an important metric. Advancement in methylation heterogeneity tools gives new lives to existing bulk-sequenced data, as new layers of information can now be discovered. We also acknowledge that there is room for improvement to linearly score and reliably capture all cases of methylation heterogeneity. Monitoring changes in methylation heterogeneity can be powerful in detecting cellular development and disease progression at an early stage, such as in cancer. We anticipate the development of more robust frameworks to target problems that are unique to heterogeneity, and to dissect its role in transcriptional regulation.
Financial & competing interests disclosure
This work was supported by grants from Academia Sinica and the Ministry of Science and Technology of Taiwan (111-2311-B-001-030- and 109-2313-B-001-009-MY3); VGH-TSGH-AS Joint Research Program (VTA112-T-3-2) and NTU-AS Innovative Joint Program (AS-NTU-112-12) to P Chen. The authors have no other relevant affiliations or financial involvement with any organization or entity with a financial interest in or financial conflict with the subject matter or materials discussed in the manuscript apart from those disclosed.
No writing assistance was utilized in the production of this manuscript.
Additional information
Funding
References
- Li S , Garrett-BakelmanFE , ChungSSet al. Distinct evolution and dynamics of epigenetic and genetic heterogeneity in acute myeloid leukemia. Nat. Med.22(7), 792–799 (2016).
- Pan H , JiangY , BoiMet al. Epigenomic evolution in diffuse large B-cell lymphomas. Nat. Commun.6(1), 6921 (2015).
- Lee D , KooB , YangJ , KimS. Metheor: ultrafast DNA methylation heterogeneity calculation from bisulfite read alignments. PLOS Comput. Biol.19(3), e1010946 (2023).
- Luo Y , HeJ , XuXet al. Integrative single-cell omics analyses reveal epigenetic heterogeneity in mouse embryonic stem cells. PLOS Comput. Biol.14(3), e1006034 (2018).
- Smallwood SA , LeeHJ , AngermuellerCet al. Single-cell genome-wide bisulfite sequencing for assessing epigenetic heterogeneity. Nat. Methods11(8), 817–820 (2014).
- Goldman SL , MacKayM , AfshinnekooE , MelnickAM , WuS , MasonCE. The impact of heterogeneity on single-cell sequencing. Front. Genet.10, 8 (2019).
- Xie H , WangM , DeAndrade Aet al. Genome-wide quantitative assessment of variation in DNA methylation patterns. Nucleic Acids Res.39(10), 4099–4108 (2011).
- Landan G , CohenNM , MukamelZet al. Epigenetic polymorphism and the stochastic formation of differentially methylated regions in normal and cancerous tissues. Nat. Genet.44(11), 1207–1214 (2012).
- Landau DA , ClementK , ZillerMJet al. Locally disordered methylation forms the basis of intratumor methylome variation in chronic lymphocytic leukemia. Cancer Cell26(6), 813–825 (2014).
- Scherer M , NebelA , FrankeAet al. Quantitative comparison of within-sample heterogeneity scores for DNA methylation data. Nucleic Acids Res.48(8), e46 (2020).
- Scott CA , DuryeaJD , MacKayHet al. Identification of cell type-specific methylation signals in bulk whole genome bisulfite sequencing data. Genome Biol.21(1), 156 (2020).
- Stoler N , NekrutenkoA. Sequencing error profiles of Illumina sequencing instruments. NAR Genomics and Bioinformatics.3(1), lqab019 (2021).
- Delahaye C , NicolasJ. Sequencing DNA with nanopores: Troubles and biases. PLOS ONE16(10), e0257521 (2021).
- Yong W-S , HsuF-M , ChenP-Y. Profiling genome-wide DNA methylation. Epigenetics Chromatin9(1), 26 (2016).
- Derrien J , Guérin-CharbonnelC , GaboritVet al. The DNA methylation landscape of multiple myeloma shows extensive inter- and intrapatient heterogeneity that fuels transcriptomic variability. Genome Med.13(1), 127 (2021).
- Lister R , PelizzolaM , DowenRHet al. Human DNA methylomes at base resolution show widespread epigenomic differences. Nature462(7271), 315–322 (2009).
- Ehrlich M . DNA hypomethylation in cancer cells. Epigenomics1(2), 239–259 (2009).
- Unnikrishnan A , HadadN , MasserDR , JacksonJ , FreemanWM , RichardsonA. Revisiting the genomic hypomethylation hypothesis of aging: genomic hypomethylation hypothesis of aging. Ann. NY Acad. Sci.1418(1), 69–79 (2018).
- Gkountela S , ZhangKX , ShafiqTAet al. DNA demethylation dynamics in the human prenatal germline. Cell161(6), 1425–1436 (2015).
- Chang Y-TS , YenM-R , ChenP-Y. BSImp: imputing partially observed methylation patterns for evaluating methylation heterogeneity. Front. Bioinform.2, 815289 (2022).
- Affinito O , PalumboD , FierroAet al. Nucleotide distance influences co-methylation between nearby CpG sites. Genomics112(1), 144–150 (2020).
- Chang Y-TS , YenM-R , ChenP-Y. Methylome imputation by methylation patterns. In: Computational Epigenomics and Epitranscriptomics. OliveiraPH ( Ed.). Springer US, NY, USA, 115–126 (2023).