
Abstract
Objective: Anoikis is a type of programmed cell death that occurs in normal epithelial and endothelial cells. However, the specific role of anoikis regulators (ANRs) in bladder cancer (BLCA) remains unknown. Therefore, the objective of this study was to find subgroups that could identify different levels of anoikis resistance in BLCA and construct an anoikis scoring system to assess prognosis. Method: By obtaining ANRs from public datasets, subgroups of BLCA with varying degrees of anoikis resistance were identified, and risk was determined. Result: ANRs affects the occurrence and prognosis of BLCA and can be predicted by establishing risk models. Conclusion: The anoikis scoring system and anoikis-associated risk profiles may help develop more effective and personalized treatment strategies for BLCA patients.
Plain language summary
This study investigates lncRNAs’ role in predicting bladder cancer patient prognosis and immune response. Anoikis is a key focus. Highly variable genes are identified, suggesting personalized treatment strategies. An anoikis scoring system aids clinicians.
Tweetable abstract
Anoikis is a type of programmed cell death that occurs in normal epithelial and endothelial cells and lead to the development of malignancies and drug resistance. Therefore, we aimed to determine its role in bladder cancer.
Bladder cancer (BLCA) is the 10th most diagnosed cancer worldwide, with approximately 573,000 new cases annually [Citation1]. In recent years, numerous potential therapeutic targets have been identified through the molecular characterization of BLCA. In addition to conventional treatments, various new therapeutic approaches have been applied to non-muscle-invasive and muscle-invasive BLCA [Citation2]. Immune checkpoint inhibitors have been demonstrated to prolong survival significantly and reduce adverse events in patients with advanced BLCA [Citation3,Citation4]. Given that patients with BLCA benefit from immunotherapy, extensive investigation of the underlying mechanisms of the tumor microenvironment (TME) in BLCA is important.
Anoikis is a specific form of programmed cell death that occurs when cells detach from the extracellular matrix (ECM) and lose cell–cell connections [Citation5]. Anoikis is indispensable for maintaining tissue homeostasis, and its main role is to prevent aberrant cell growth by balancing cell survival and death [Citation6,Citation7]. Resistance to anoikis is a feature of tumor metastasis; cell adhesion receptors are linked to signal transduction pathways, and dysregulated cell–cell and cell–ECM interactions facilitate tumor features such as cellular proliferation, migration and drug resistance [Citation8,Citation9]. Thus, anoikis resistance leads directly to immune evasion and metastasis [Citation10]. The mechanism by which anoikis regulators (ANRs) act in various cancers has been described. For example, TLE1 and NTRK2 suppress anoikis by inhibiting the Bit1 anoikis pathway [Citation11] and activating the phosphatidylinositol-3-OH kinase/protein kinase B pathway [Citation12], respectively. Multiple signaling pathways and molecular and biochemical processes are involved in this complex process, including the evasion of immune surveillance and immune attack [Citation10,Citation13]. However, the roles of anoikis in BLCA, especially in the immune environment and TME, are underexplored. The increase in the number of ANR copies may have some influence on patients with BLCA, which is its main feature.
lncRNAs play equally vital roles as coding genes, including the regulation of immune system function and the TME [Citation14]. For example, lnc-INSR promotes immunosuppression by enhancing regulatory T cell differentiation [Citation15], and lnc-NeST is capable of activating T cells to regulate immune function [Citation16]. In contrast, lnc-NRON maintains the quiescent state of T cells [Citation17]. Although the benefits of immunotherapeutic agents in patients with BLCA have been reported, biomarkers for their prognostic determination are lacking. Therefore, it is worth exploring lncRNAs that modulate the infiltrating immune cell population in the TME because these may aid in the development of effective immunotherapeutic strategies.
The present study comprehensively analyzes the characteristics of ANRs, as well as the mRNAs and lncRNAs associated with them, using data from patients with BLCA available in The Cancer Genome Atlas (TCGA) and Gene Expression Omnibus (GEO). An anoikis scoring system was established in BLCA, and anoikis-related mRNAs and lncRNAs were used to construct the risk signatures. Further, the prognosis, TME immune infiltration, immunotherapy response and drug sensitivity of patients with BLCA was systematically analyzed using an anoikis score-based evaluation system. It was hypothesized that molecular signatures would effectively differentiate patients with BLCA, thereby allowing the provision of more individualized and effective therapeutic strategies.
Materials&methods
Dataset collection
Gene expression files and information on the clinical characteristics of patients with BLCA were downloaded from the TCGA-BLCA (https://portal.gdc.cancer.gov/) cohort and the GSE31684 datasets from GEO (www.ncbi.nlm.nih.gov/geo/). Expression data and clinical annotations were also obtained for the IMvigor210 phase II trial study [Citation18] (http://research-pub.gene.com/IMvigor210CoreBiologies). All expression data were standardized to transcripts per million. Single-nucleotide mutation annotation and copy number variation (CNV) data were obtained from the TCGA-BLCA cohort. A gene set containing 19 ANRs was obtained from the Gene Ontology (GO) Biological Process Annotations dataset (Gene Ontology, GO_2000209).
Consensus clustering analysis&anoikis scoring system construction
Consensus clustering, based on the expression levels of the 19 ANRs, was performed using the Consensus Cluster Plus R package. The limma R package was used to identify overlapping differentially expressed genes (DEGs) in the resultant three ANR clusters (anoikis-related [A]DEGs), and DEGs associated with overall survival (OS) were screened using univariate Cox regression analysis [Citation19]. Consensus clustering based on the expression levels of these ADEGs was then performed, yielding two ADEG clusters. Principal component analysis (PCA) was used to calculate ADEG scores for all samples [Citation20]. PCA values were calculated as follows: Σ(coefficient_i*expression_i), where coefficient_i and expression_i are the PCA coefficient and the expression level of each gene, respectively. The ADEG score was calculated as PCA 1 value + PCA 2 value. The ADEG scores for all samples were calculated, and patients were divided into low- and high-score groups based on the median value.
Analysis of the abundance of infiltrating immune cell populations
Infiltrating immune and stromal cell abundance and tumor purity were quantified using the ESTIMATE (Estimation of STromal and Immune cells in MAlignant Tumor tissues using Expression) algorithm [Citation21]. The infiltration abundance of 23 immune cell types was determined using single-sample gene set enrichment analysis (ssGSEA).
Enrichment analysis
Differential functional identification of the ANR groups was conducted using c2.cp.kegg.v2022.1.Hs.symbols dataset downloaded from the GSEABase and GSVA R packages. The clusterProfiler R package was used to perform GO and Kyoto Encyclopedia of Genes and Genomes (KEGG) pathway enrichment analyses. Immune functions were assessed using the ssGSEA algorithm.
Comprehensive analyses of tumor mutation burden, immune checkpoints&immunotherapy response in different clusters&signature subgroups
Mutation annotation data extracted from TCGA were analyzed using the maftools R package to establish mutation subgroups. The differences in immune checkpoint expression between subgroups were then analyzed using the limma R package. In addition, we assessed the responses of patients in different clusters and signature subgroups to immunotherapy based on the Tumor Immune Dysfunction and Exclusion (TIDE) score [Citation22] as well as The Cancer Immunome Atlas (https://tcia.at/home).
Construction of the risk signatures
Because nearly all OS-related ADEGs were found to be mRNAs, lncRNAs were excluded based on gene annotation and obtained OS-related mRNAs via univariate Cox regression analysis, with a filtering threshold of p < 0.001. The co-expressed lncRNAs of ANRs were then screened based on thresholds of a correlation coefficient R > 0.4 and p < 0.001. Next, univariate Cox regression analysis was performed with a filtering threshold of p < 0.001 for lncRNAs to identify OS-related co-expressed lncRNAs. Next, we constructed risk models based on OS-related co-expressed lncRNAs and mRNAs. Using the least absolute shrinkage and selection operator (LASSO) Cox regression, we constructed an lncRNA risk signature containing four lncRNAs and an mRNA risk signature containing three mRNAs. The risk score was calculated as follows: Σ(coefficient_i*expression_i), where coefficient_i and expression_i are the risk coefficient and expression of each gene, respectively The risk scores for all samples were calculated, and the patients were divided into low- and high-risk groups according to the median value.
Evaluation of the risk signatures
The patients in the study cohort were randomly and equally divided into training and tests set using the caret R package and analyzed to confirm that there were no differences in clinical traits between the two subgroups. The prognostic value of the risk signatures was assessed by Kaplan–Meier survival, Cox regression and receiver-operating characteristic (ROC) curve analyses and by calculating the concordance index for the training and test sets. The rms R package was used to generate nomograms, and their accuracy was evaluated using calibration curves.
Tissue specimens&quantitative reverse transcription PCR
Eight BLCA and matching paracancerous nontumor tissue samples were obtained during routine surgery at the First Affiliated Hospital of Nanjing Medical University in China, and the samples were stored at -80°C until further experiments. The total RNA from tissues was isolated using TRIzol reagent (Takara Bio, Shiga, Japan) and reverse-transcribed to cDNA with a PrimeScriptTM RT reagent Kit (Takara Bio) per the manufacturer’s instructions. SYBR® Premix Ex Taq (Takara Bio) was used for quantitative reverse transcription PCR. The 2-ΔΔCt method was used to assess the relative expression levels of query genes. General Biosystems (Anhui, China) provided all primers, listed in Supplementary Table 1.
Immunohistochemistry staining
The tissue sections were deparaffinized in xylene and rehydrated using a gradient ethanol series. Tissue slices were blocked and incubated with appropriate concentrations of primary antibodies overnight at 4°C. The biotinylated sections were incubated for 30 min at 37°C with a secondary antibody (Dako, Denmark). Finally, the slices were stained with a Dako diaminobenzidine kit and counterstained with hematoxylin (Baso, Zhuhai, China). The intensity and extent of staining were evaluated. The antibodies used in this study are listed in Supplementary Table 2.
Western blotting
BLCA and matched normal tissues were lysed in RIPA buffer (Beyotime, Shanghai, China) containing protease and phosphatase inhibitors (Sigma-Aldrich, MO, USA). Protein samples were resolved by SDS-PAGE and transferred to a polyvinylidene difluoride membrane (Millipore, MA, USA). The membrane was blocked with 5% nonfat milk (BD Biosciences, CA, USA) for 1 h at 24°C before incubation with the primary antibody. The membrane was then treated for 2 h at 24°C with a secondary antibody (A0216, 1:1000; Beyotime) labeled with horseradish peroxidase. The signals were imaged using a chemiluminescent imager and visualized using an ECL solution (Tanon 5200; Tanon, Shanghai, China). Band intensities were determined using ImageJ software (US National Institutes of Health, MD, USA). The primary antibodies used in this study are listed in Supplementary Table 2.
Single-cell analysis of the mRNA risk signature
Raw data for single-cell RNA sequencing (scRNA-seq) of seven BLCA samples and one normal tissue sample were downloaded from GSE135337 [Citation23]. Raw count matrices were merged and converted into an expression matrix. The data were read using the ScanPy single-cell gene expression software [Citation24], integrating multiple samples according to the official tutorial. Data were pre-processed as follows: samples were excluded if fewer than three cells expressed the genes, less than 200 genes occurred in a single cell or cells contained too many mitochondrial genes and an abnormal number of expressed genes. The data were then normalized to allow practical comparability between the different cell samples. Highly variable genes were screened and the data were normalized using regression. The dimensionality of the data was reduced using PCA to denoise the data and reveal the principal factors of the different subgroups. The contribution of individual components to the total variance of the data was examined, and then the top 20 principal components were used for uniform manifold approximation and projection reduction. Clustering operations were performed using the Leiden algorithm, with a resolution of 0.25. The cell types were annotated and marker genes were compared across taxa based on known cell markers. The analysis was performed using Python (version 3.9.4; www.python.org/).
Correlation analysis of the risk signatures with drug sensitivity
The half-maximal inhibitory concentrations of drugs in various cell lines and the mRNA (in the mRNA risk signature) expression data were extracted from the Cancer Therapeutics Response Portal and Genomics of Drug Sensitivity in Cancer databases [Citation25]. Spearman’s rank correlation analysis was used to detect drugs with high sensitivity associated with risk signatures.
Statistical analysis
On the basis of the expression profiles of Anoikis regulators, we conducted consistent clustering analysis of bladder cancer patients. Through dimensionality reduction analysis, we observed that Anoikis regulators can effectively distinguish patients. Single-factor Cox regression analysis was used to screen for genes associated with the prognosis of bladder cancer patients, and multiple-factor Cox regression analysis was employed to assess whether risk features can serve as independent prognostic factors for bladder cancer. Wilcoxon rank-sum test and Kruskal–Wallis test were used to compare two independent groups and three or more independent groups, respectively. Kaplan–Meier test and log-rank test were employed to evaluate differences in patient survival. Spearman rank correlation analysis was used for correlation analysis. All statistical analyses were conducted using R software (version 4.2.1). Data collection and analysis were carried out by professional statisticians. Sample selection adhered to the research question, ensuring the appropriateness of sample sources and sample size. The original data underwent quality control to eliminate low-quality and noisy data and to remove batch effects between datasets, ensuring the accuracy and reliability of subsequent analysis. The analysis process strictly followed standardized operating procedures, ensuring accuracy and reproducibility. The results of the analysis were explained and annotated in detail. The original data and code are publicly accessible, ensuring transparency throughout the data and analysis process.
Results
Characteristics&prognostic value of ANRs in BLCA
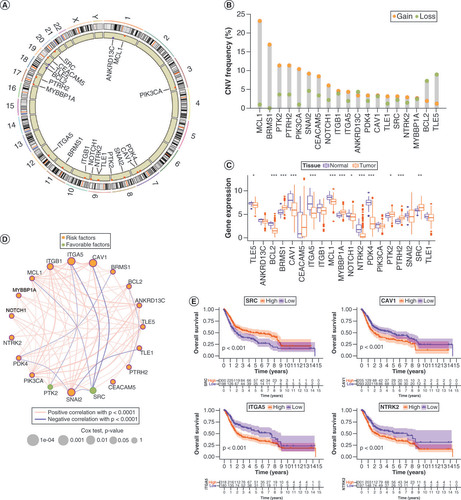
Anoikis was originally studied in epithelial cells, and when they lost their adhesion, they were removed to prevent spreading. Therefore, we analyzed 19 ANRs in this study (Supplementary Table 3). Their chromosomal distributions and CNVs are shown in A & B. Among them, MCL1, BRMS1, PTK2, PTRH2, PIK3CA, SNAI2, CEACAM5 and NOTCH1 showed copy number amplification, whereas ANKRD13C, BCL2 and TLE5 exhibited copy number deletions. The CNV of ANRs correlated with prognosis is shown in Supplementary Figure 1A&B. Survival differences were found between mutant and wild-type ANRs because most mutations in ANRs were associated with favorable prognosis (Supplementary Figure 1C&D). Mutation trends and mutation types of ANRs in 414 patients with BLCA are summarized in Supplementary Figure 1E&F. In addition, the expression levels of ANRs were remarkably different between BLCA tumors and healthy tissues (C). The interactions among and prognostic values of the ANRs are shown in the network diagram in D. SRC and PTK2 played a favorable prognostic role, whereas the other ANRs were prognostic risk factors. In addition, Kaplan–Meier survival analyses of individual ANRs that had prognostic value separately were performed, and the results were consistent with the network diagram. (E & Supplementary Figure 2).
(A) Chromosomal distribution of 19 anoikis regulators (ANRs). (B) CNV in ANRs in patients with bladder cancer (BLCA). (C) Genetic variants in ANRs in 414 patients with BLCA, based on the Gene Set Cancer Analysis database. (D) Summary of ANR genetic variants in 414 patients with BLCA, according to the Gene Set Cancer Analysis database. (E) Kaplan–Meier curves of the indicated ANRs for patients with BLCA.
*p < 0.05; **p < 0.01 and ***p < 0.001.
CNV: Copy number variation.
Identification of distinct clusters&associated immune profiles based on ANR expression
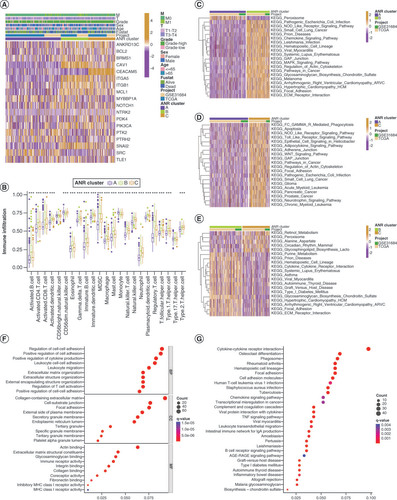
To explore whether clinical characteristics related to BLCA were associated with ANRs expression, we performed a consensus clustering analysis of a combined cohort of 499 patients with BLCA from TCGA-BLCA and GSE31684 databases based on the expression levels of 19 ANRs (Supplementary Figure 3A). Three ANR clusters were identified: A (n = 228), B (n = 146) and C (n = 125) (Supplementary Table 4). PCA plots showed that ANR clusters could effectively differentiate between the survival rates of patients with BLCA (Supplementary Figure 3B). The heat-map in A illustrates the expression patterns of ANRs and associated BLCA clinical characteristics in the three ANR clusters. Kaplan–Meier survival analyses indicated a survival advantage for patients in cluster A and poor prognosis for those in cluster C (Supplementary Figure 3C). We assessed the differences in the degree of immune infiltration in the three ANR clusters and found that the proportions of CD56dim natural killer cells and monocytes were the highest in cluster A, the proportion of type 2 T helper cells was the highest in cluster C, and the majority of remaining immune cells were significantly more abundant in cluster B than in the other two clusters (B).
(A) Clinical characteristics and expression of 19 ANRs in three clusters. (B) Differences in immune cell infiltration among the three ANR clusters were analyzed using sample gene set enrichment analysis. (C–E) Gene set variation analysis of Kyoto Encyclopedia of Genes and Genomes (KEGG) terms in pairs of the three ANR clusters. (F–G) Gene Ontology and KEGG enrichment analyses of overlapping differentially expressed genes.
*p < 0.05; **p < 0.01 and ***p < 0.001.
ANR: Anoikis regulator; BP: Biological process; CC: Cellular component; MF: Molecular function.
Identification of DEGs&their functions among ANR clusters
To gain more insight into the biological functions of ANRs in the different ANR clusters, we performed gene set variation analysis (C–E). Surprisingly, ANRs in cluster A (which were associated with the best survival trend) were enriched only in peroxisomal functions (C & D). ANRs in cluster B were more closely related to the regulation of immune diseases (autoimmune thyroid disease and systemic lupus erythematosus) and infectious diseases (pathogenic Escherichia coli and Leishmania infection) (C&E). ANRs in cluster C were involved in inflammatory responses (NOD-like and Toll-like receptor signaling pathways), multiple cancers (small-cell lung cancer, glioma, pancreatic cancer and prostate cancer) and signaling pathway regulation (pathways in cancer and WNT signaling) (D&E). The ANRs in clusters B and C had substantial overlapping functions related to cell adhesion, implying that they play a role in anoikis resistance (C–E).
Next, DEGs that overlapped with the three ANR clusters were identified, resulting in a total of 851 ADEGs (Supplementary Figure 3D&Supplementary Table 5). Functional enrichment analysis of these ADEGs revealed that they were mainly related to cell adhesion, immune cell activity and the regulation of tumor signaling pathways (F&G). Thus, we identified distinct biological roles and major differential functions of the ANRs in the three ANR clusters.
Identification of distinct clusters based on OS-related ADEGs&construction of an anoikis scoring system
As ADEGs play important regulatory functions in resistance to anoikis and tumor development, univariate regression analysis was used to screen 390 prognostically relevant ADEGs (Supplementary Table 6) and consensus clustering analysis of patients with BLCA in the study cohort was performed based on the expression levels of these OS-related ADEGs, yielding two ADEG clusters: A (n = 226) and B (n = 273) (Supplementary Figure 4&Supplementary Table 7). A shows the expression levels of ADEGs and associated clinical characteristics in these two clusters. ADEGs in cluster B were generally expressed at higher levels than those in cluster A. The Kaplan–Meier survival analyses indicated a survival advantage for patients in cluster A and a poorer prognosis for those in cluster B (B). Most ANRs were also expressed at higher levels in ADEG cluster B than in cluster C (C).
(A) Expression and clinical characteristics of overall survival (OS)-related (ADEGs in two ADEG clusters. (B) Kaplan–Meier curves for patients with bladder cancer (BLCA) in the two ADEG clusters. (C) Differential expression levels of the 19 ANRs in the two ADEG clusters. (D) Kaplan–Meier curves for patients with BLCA in the low- and high-anoikis-score subgroups. (E) Anoikis score differences among the three ANR clusters. (F) Differences in Anoikis scores between the two ADEG clusters. (G & H) Correlation between anoikis scores and the survival status of patients with BLCA. (I) Sankey diagram of the three ANR clusters, two ADEG clusters, anoikis score and survival status of patients with BLCA. Kaplan–Meier curves for patients with BLCA at stage I–II (J) and stage III–IV (K) of tumor node metastasis using our anoikis scoring system.
*p < 0.05; **p < 0.01 and ***p < 0.001.
ADEG: Anoikis-related overlapping differentially expressed gene; ANR: Anoikis regulator.
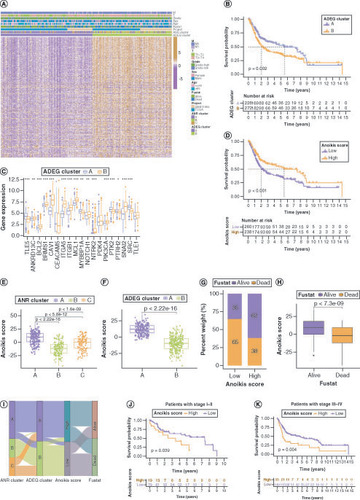
All patients were then scored with BLCA using PCA (anoikis score) and divided them into low- and high-score groups based on the optimal score threshold (Supplementary Table 7). Kaplan–Meier survival analyses showed that these groups were effectively differentiated in terms of prognosis, with patients in the high-score group having a survival advantage (D). Next, the distribution of and differences in anoikis scores among the ANR and ADEG clusters was investigated (E&F), which confirmed that patients in ANR cluster A and ADEG cluster A (who tended to have better survival) had higher anoikis scores. The survival status of patients with BLCA differed significantly between the low- and high-anoikis score groups (G&H). The relationships between the ANR cluster, ADEG cluster, anoikis score and survival status of patients with BLCA are summarized in a Sankey plot in I. In addition, the anoikis scoring system effectively discriminated survival in patients with BLCA in both early and advanced tumor node metastasis (TNM) stages, although it was a more effective predictor in the advanced stage (J&K).
Correlations of anoikis scores with tumor mutation burden, TME immune infiltration, immune checkpoints & immunotherapy response
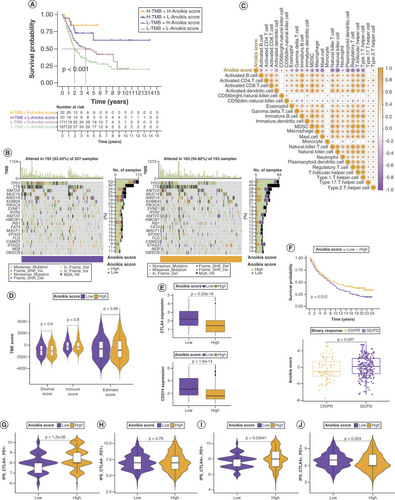
Although tumor mutation burden (TMB) did not differ significantly between the low and high anoikis score groups (Supplementary Figure 5A & B), the degree of TMB affected prognosis (Supplementary Figure 5C), suggesting that the combination of TMB and anoikis score was more effective in predicting prognosis (Supplementary Figure 4A). Genes with markedly high mutation levels in the low and high anoikis score groups are shown in B. Next, the correlations between the anoikis score and various immune cell populations in the TME were analyzed, and it was found that the anoikis score was significantly negatively correlated with most immune cell populations (C). However, the TME score did not vary substantially between the low and high anoikis score groups (D). To evaluate whether the anoikis score could serve as a clinical guide for immunotherapy, the expression of immune checkpoints and immunotherapy response in the two groups were analyzed. As shown in E and Supplementary Figure 5D, all 15 immune checkpoints analyzed were highly expressed in the low anoikis score group, implying that the immune functions of patients with BLCA in this group were generally suppressed. The anoikis score evaluation system also held true for the IMvigor210 cohort, and BLCA patients with high anoikis scores responded better to immunotherapy (F). Immune phenoscore analysis revealed similar results (G–J).
(A) Kaplan–Meier curves for patients with bladder cancer (BLCA) in the four groups based on anoikis score and tumor mutation burden level. (B) Gene mutations in patients with BLCA with low and high anoikis scores. (C) Correlation between anoikis scores and infiltrating immune cell populations. (D) Comparison of tumor microenvironment scores between the low and high anoikis score groups. (E) Correlation between the anoikis scores and immune checkpoint inhibitor expression. (F) Kaplan–Meier curves and immunotherapy response analysis for patients with BLCA in the IMvigor210 cohort. (G–J) Differences in response to immunotherapy among subgroups with different anoikis scores.
CR: Complete response; IPS: Immunophenoscore; PD: Progressive disease; PR: Partial response; SD: Stable disease.
Risk signature construction based on OS-related lncRNAs&mRNAs
We found that the genes underlying OS-related ADEGs largely encode mRNAs. To analyze comprehensively the relevant effects of anoikis in BLCA, the lncRNAs associated with them were also analyzed. lncRNAs that were significantly associated with ANR expression were screened for, yielding 1316 ANR co-expressing lncRNAs (Supplementary Figure 6A&Supplementary Table 8). These lncRNAs were combined with the survival data of patients with BLCA to screen (p < 0.001) for prognosis-related lncRNAs (OS-related lncRNAs) (Supplementary Figure 6B). Next, we removed the lncRNAs from the OS-related ADEGs, and the remaining mRNAs were similarly screened for prognosis-related (OS-related) mRNAs based on p < 0.001 (Supplementary Figure 6C). Finally, LASSO (Supplementary Figure 8A&B) and multivariate Cox regression analyses (Supplementary Tables 9&10) were performed on the OS-related lncRNAs and mRNAs to establish the corresponding risk signatures. The lncRNA risk signature contained four lncRNAs (AC006160.1, AL390236.1, AL356234.3 and AC018978.1), and their correlations with 19 ANRs are shown in Supplementary Figure 6D. The mRNA risk signature contained three mRNAs (CERCAM, CSPG4 and ECHDC2).
Risk scores were calculated for the patients in the TCGA-BLCA cohort using the expression and coefficient of each candidate gene in the risk signatures and divided the patients into low- and high-score groups using the median value as a threshold (Supplementary Tables 11&12). To analyze the accuracy of the signatures, the patients were randomly divided into training and test subsets. There were no differences in clinical characteristics between the two subgroups (Supplementary Tables 13&14). Trends in the expression changes of candidate genes used for the lncRNA and mRNA risk signatures were consistent with changes in risk in the training set, test set and a combination of the two sets (Supplementary Figure 8C&D). Risk plots revealed that low-risk patients with BLCA had a longer survival time according to both risk signatures (Supplementary Figure 8E&F), confirming that both signatures can discriminate risk.
Assessment of the risk signatures
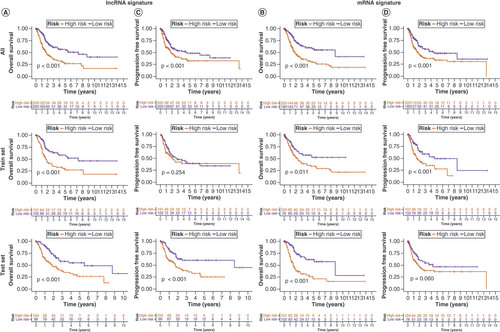
To validate the lncRNA and mRNA risk signatures, Kaplan–Meier OS analysis (A&B) and progression-free survival analysis (C&D) were conducted. Except for progression-free survival based on lncRNA signature risk in the training set and mRNA signature risk in the test set, survival was significantly higher in the low-risk group than in the high-risk group for all other signatures. Overall, the mRNA risk signature had a better discriminatory ability than the lncRNA risk signature. E&F shows that the risk scores of both risk signatures served as independent prognostic factors, but the mRNA risk score had a higher hazard ratio. ROC curves suggested that the two risk signatures had more prognostic value than clinical characteristics (G & H). Furthermore, time-dependent ROC curves showed that both risk signatures had good predictive ability at 1, 3 and 5 years, with the mRNA risk signature performing better (I & J). Separate nomograms were constructed for each risk signature, along with clinical features, to quantify their prognostic value in patients with BLCA (A&B). Calibration analyses were performed to assess the accuracy of their predictive capability, which suggested that the lncRNA risk signature was more accurate than the mRNA signature (C&D). The concordance index values showed that the two risk signatures displayed the best predictive ability compared with the other clinical characteristics (E & F). Moreover, the two risk signatures were able to predict the prognosis in both early and advanced TNM stages of BLCA (G&H), and the risk scores were notably associated with BLCA survival status (I&J).
Kaplan–Meier overall survival curves for patients with bladder cancer (BLCA) in the low- and high-risk subgroups of the lncRNA (A) and mRNA (B) risk signatures. Kaplan–Meier progression-free survival curves for patients with BLCA in the low- and high-risk subgroups of the lncRNA (C) and mRNA (D) risk signatures. Univariate and multivariate analyses of independent prognostic value of the lncRNA (E) and mRNA (F) risk signatures. Receiver operating characteristics (ROC) curves for the risk scores of the lncRNA (G) and mRNA (H) risk signatures and other clinical characteristics. ROC curves validating the prognostic capability of lncRNA (I) and mRNA (J) risk signatures at 1, 3 and 5 years, respectively.
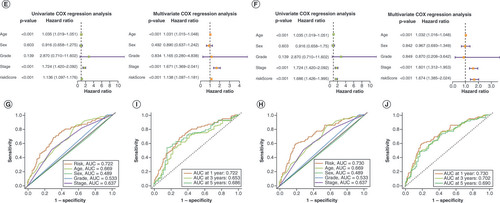
Overall survival probability of patients with bladder cancer at 1, 3 and 5 years was predicted based on nomograms created using the lncRNA (A) and mRNA (B) risk signatures. Calibration curves showing deviation from the predicted results of the lncRNA (C) and mRNA (D) risk signatures. Concordance index values of the risk scores from the lncRNA (E) and mRNA (F) risk signatures. Kaplan–Meier curves for the lncRNA (G) and mRNA (H) risk signatures for low- and high-risk subgroups of patients with bladder cancer (BLCA) according to the tumor–node–metatstasis stage. The distribution of survival statuses of patients with BLCA between low- and high-risk groups for lncRNA (I) and mRNA (J) risk signatures.
Survival analysis of the risk signatures
Kaplan–Meier OS analysis was performed with the candidate genes of the lncRNA and mRNA risk signatures (Supplementary Figure 9A&B). The analysis predicted the likelihood of survival at 1, 3 and 5 years based on risk signatures. Calibration curves were created to evaluate the accuracy of risk signatures. These curves depict the differences between the predicted outcomes and the actual results of the lncRNA and mRNA risk signatures. The calibration curves for the lncRNA and mRNA risk signatures are shown in Supplementary Figure 9C&D, respectively. Concordance index values were calculated to assess the predictive performance of the risk scores obtained from the lncRNA and mRNA risk signatures. The concordance index values for the lncRNA and mRNA risk signatures are shown in Supplementary Figure 9E&F, respectively. Additionally, Kaplan–Meier curves were generated to determine the performance of the risk signatures in stratifying patients into low- and high-risk subgroups. The Kaplan–Meier curves for the lncRNA and mRNA risk signatures are shown in Supplementary Figure 9G&H, respectively. Overall, validation of the risk signatures demonstrated their ability to distinguish between different risk levels and predict patient outcomes. These findings further support the utility of lncRNA and mRNA risk signatures in the clinical setting.
Correlations of the risk signature scores with the TMB, immune function & cytokine levels
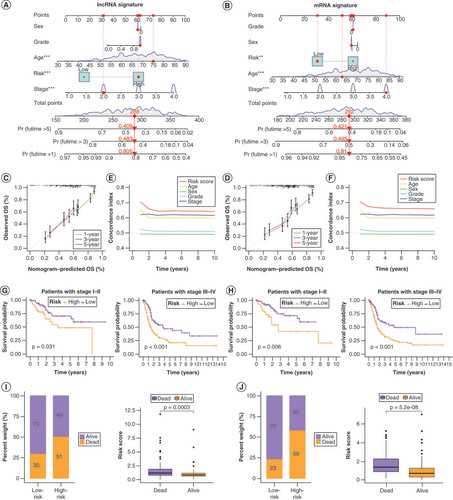
Mutation information of patients in the low- and high-risk groups for genes in the lncRNA and mRNA risk signatures is shown in (A & B). Survival analyses for the two risk signatures combined with TMB are presented in (C & D). The degree of TMB differed significantly between the low- and high-risk groups based on the lncRNA risk signature (E) but not the mRNA risk signature (F). The mRNA risk signature genes were more involved in immune function than those in the lncRNA risk signature (G&H). The expression levels of immunosuppressive factors in both the lncRNA and mRNA risk signatures were higher in the high-risk group than in the low-risk group, but this trend was more pronounced in the mRNA risk signature (I & J).
Mutations in lncRNA (A) and mRNA (B) risk signature genes in low- and high-risk patients with bladder cancer (BLCA). (C) Kaplan–Meier curves for the four groups of patients with BLCA based on lncRNA risk and tumor mutation burden (TMB) levels. (D) Kaplan–Meier curves for the four groups of patients with BLCA, based on mRNA risk and TMB. Variation in TMB between the low- and high-risk groups in lncRNA (E) and mRNA (F) risk signatures. Immune functions of genes in lncRNA (G) and mRNA (H) risk signatures. Differences in mRNA expression of cytokines and their receptors in the high- and low-risk groups for lncRNA (I) and mRNA (J) risk signatures.
*p < 0.05; **p < 0.01 and ***p < 0.001.
Response to immunotherapy&functional enrichment analysis of the risk signatures
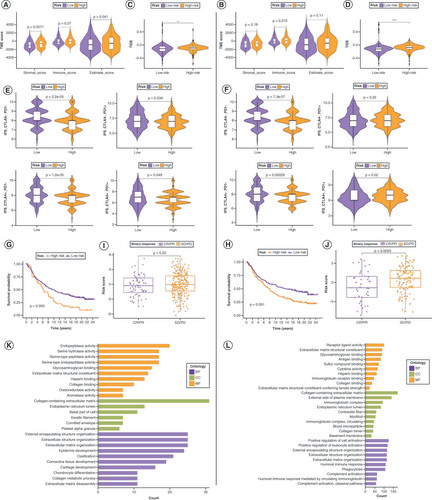
In the TME, immune cell abundance (immune score) and tumor purity (ESTIMATE score) were markedly different between the low- and high-risk groups of the lncRNA risk signature, whereas stromal cell infiltration levels (stromal score) were significantly different between these groups of the mRNA risk signature (A & B). Regarding immunotherapy efficacy, TIDE scores differed between the low- and high-risk groups for both risk signatures but were more significant for the mRNA risk signature (C&D). The immunophenoscore score for the CTLA4- PD1+ immunophenotype did not differ significantly between the low- and high-risk groups for both risk signatures, whereas all other groups showed differences in immunotherapy response (E&F). After verifying the accuracy of both risk signatures in the IMvigor210 cohort (G&H), risk scores to differentiate immunotherapy responses among the patients in the cohort were applied. In the mRNA risk signature, patients with low-risk scores responded significantly better to immunotherapy, whereas there was no major difference in the lncRNA risk signature between the two risk groups (I&J). This demonstrates the increased sensitivity of the mRNA risk signature. Supplementary Figure 10 shows the expression patterns of the mRNA risk signature candidate genes at the single-cell level.
Comparison of tumor microenvironment (TME) scores between the low- and high-risk groups in lncRNA (A) and mRNA (B) risk signatures. (C, D) Variation in Tumor Immune Dysfunction and Exclusion scores between the low- and high-risk groups in the lncRNA (C) and mRNA (D) risk signatures. Differences in response to immunotherapy between the low- and high-risk groups in lncRNA (E) and mRNA (F) risk signatures. Kaplan–Meier curves for patients with bladder cancer (BLCA) in the IMvigor210 cohort after implementation of the lncRNA (G) and mRNA (H) risk signatures. Immunotherapy response analysis for patients with BLCA in the IMvigor210 cohort after the implementation of the lncRNA (I) and mRNA (J) risk signatures. Gene Ontology enrichment analysis of genes in t lncRNA (K) and mRNA (L) risk signatures.
BP: Biological process; CC: Cellular component; CR: Complete response; IPS: Immunophenoscore; MF: Molecular function; PD: Progressive disease; PR: Partial response; SD: Stable disease.
Relevance of the mRNA risk signature to drug sensitivity
To assess the potential relevance of the mRNA risk signature in guiding therapy, the Cancer Therapeutics Response Portal and Genomics of Drug Sensitivity in Cancer was used to screen 30 drugs significantly associated with the mRNA risk signature (Supplementary Figure 11A & B). The results showed that the expression of ECHDC2 was strongly positively correlated with high sensitivity to multiple drugs, followed by CERCAM and CSPG4.
Discussion
The concept of anoikis was first introduced and studied in the context of the epithelial cells. When epithelial cells lose their attachment, they undergo excision to prevent their survival and potentially spread to other sites. This process plays a crucial role in maintaining tissue homeostasis, embryonic development and in preventing tumor metastasis [Citation26]. In anoikis or anchorage-dependent cell death, normal epithelial and endothelial cells undergo programmed death after detachment from the ECM and cell–cell contact loss to maintain tissue homeostasis [Citation26,Citation27]. BLCA is a uroepithelial carcinoma [Citation28] in which anoikis are avoided via an unknown regulatory mechanism. Given that ANR characteristics and anoikis resistance mechanisms have not been systematically investigated in BLCA, this study provides a comprehensive analysis of anoikis-related characteristics in BCLA to fill this gap.
In this study, we found that patients with BLCA were mainly characterized by copy number amplification of ANRs and that there were certain differences in tumor grade. In addition, we found that class A BLCA patients had a better prognosis than class b/c patients, whereas class C patients had the worst prognosis, possibly because class A patients had a lower adhesion score, and their immune cell expression and response to immunotherapy showed better advantages, so their prognosis was better. On the other hand, risk assessment based on lncRNAs and mRNAs has the ability to identify risks, among which the ncRNA risk signature contains four lncRNAs (AC006160.1, AL390236.1, AL356234.3 and AC018978.1). The mRNA risk signature contained three mRNAs (CERCAM, CSPG4 and ECHDC2). Finally, the major differences in immunity and drug sensitivity between the low-risk and the high-risk groups were mainly caused by the different regulation of mRNA and lncRNAs in the different subtypes of the disease.
Of the 19 ANRs contained in the gene set derived from GO_2000209, 13 were associated with BLCA prognosis. In our study, we found that SRC and PTK2 play important roles in the prognosis of BLCA. Others factors are risk factors for BLCA prognosis. SRC is a protective factor mainly because it improves the survival of patients with BLCA by regulating necrotic necrosis [Citation29], and it also plays a similar role in EGFR/SRC/STAT3 signaling [Citation30]. However, there have been few studies on the prognosis of PTK2 expression in BLCA.
The patients from the TCGA-BLCA cohort were clustered into three distinct ANR clusters based on ANR expression. ANRs showed low expression in patients in ANR cluster A, in which patients had a better overall prognosis. The degree of immune infiltration was highest in patients of cluster B and lowest in those of cluster A. This is not consistent with the view that immune infiltration favors prognosis [Citation31–34]; thus, there should be other biological processes that obscure the TME immune function. Furthermore, the other reason maybe the higher the degree of infiltration, the faster the growth rate of tumor cells and the stronger their ability to grow and escape immune monitoring, thus increasing the risk of metastasis and affecting their prognosis. We therefore compared the enriched functions in each of the three ANR clusters. Unexpectedly, ANRs in cluster A were enriched only in peroxisome functions. Peroxisomal molecules such as catalase protect cells by oxidizing toxic substances, such as fatty acids and uric acid [Citation35,Citation36]. Therefore, ANRs in cluster A benefit BLCA patients mainly through metabolic pathways, whereas ANRs in the other two clusters are associated with anoikis resistance and pathways related to cancer pathogenesis.
We functionally annotated the DEGs overlapping the ANRs, and found that most of the overlapping DEGs were associated with anoikis resistance. We distinguished between two ADEG clusters and established an anoikis scoring system based on the degree of anoikis resistance. The anoikis scoring system showed excellent performance in determining BLCA survival status and predicting prognosis in both the early and advanced disease stages.
At present, the conventional treatment regimen for BLCA is based on carboplatin, but carboplatin resistance can occur because of resistance to apoptosis [Citation37]. Despite the benefits of immunotherapy, the efficiency rate remains below 30% [Citation38]. Therefore, there is an urgent need to optimize treatment regimens to avoid anoikis resistance, including immunotherapy. We found that the anoikis scoring system could be implemented to guide immunotherapy planning because patients with high anoikis scores had significantly reduced expression of immune checkpoints compared with those with low scores – and consequently, a higher response to immunotherapy. Therefore, the anoikis scoring system may help clinicians identify BLCA patients early in the future and guide immunotherapy programs to enable early intervention and precise treatment, thereby improving the prognosis of such patients.
However, we found that the anoikis scoring system involves 390 candidate genes, and it is difficult to measure the expression of all ADEGs in each patient, which limits its clinical application. Therefore, we constructed a more representative prognostic mRNA risk signature based on ADEGs (excluding a few lncRNAs). In addition, we identified co-expressed lncRNAs of ANRs with prognostic relevance and constructed an lncRNA risk signature. Both risk signatures were highly effective in predicting the prognosis of BLCA patients, with mRNA risk signals appearing to be more accurate and having a higher assessment power than lncRNAs.
The lncRNA risk signature is mainly associated with TMB, whereas the mRNA risk signature is more related to immune functions, suggesting that it has a greater impact on the response to immunotherapy and, perhaps, in turn, on prognosis [Citation39]. Immune and stromal cells are the dominant components of the TME [Citation40]. Interestingly, the lncRNA risk signature was associated with stromal cells, whereas the mRNA risk signature was associated with immune cells. Although they exhibit differences in sensitivity to the immune environment, immunotherapy response and modulated biochemical processes, both signatures provide valuable insights for the determination of BLCA treatment options.
CSPG4, which is present in the mRNA risk signature, was expressed at lower levels in tumor tissues than in healthy tissues in the validation analysis. We hypothesized that CSPG4 may be more relevant to advanced or high-grade BLCA, and immunohistochemical analysis confirmed this. CSPG4 expression has been shown to reduce the survival of patients with epithelial ovarian cancer and serves as an independent risk label [Citation41]. CERCAM is involved in regulating PI3K/AKT signaling, thus promoting the malignant phenotype of BLCA [Citation42]. The oncogenic factor ECHDC2 is involved in cell death regulation as a mitochondrial protein [Citation43], and anoikis is executed via the mitochondrial pathway [Citation44,Citation45]. Among the lncRNAs in the lncRNA risk signature, AC006160.1 was recently identified as a ferroptosis-related gene that inhibits the proliferative ability of BLCA [Citation46]. There are no reports on other candidate genes; thus, further research is necessary to establish their roles in this regard.
Finally, we screened for drugs with high sensitivity associated with the mRNA risk signature. The top 30 drugs screened by both databases contained vorinostat, an antitumor drug that induces cell differentiation, blocks the cell cycle and induces cellular regulation. We hope that these results will help develop more individualized therapeutic regimens for patients with BLCA.
This study has some limitations. The study subjects were enrolled based on limited resources in public databases, and the retrospective analysis may be subject to selection bias, which affects accuracy. Moreover, clinical information on BLCA patients in public databases is not comprehensive, which may have led to the omission of some characteristics related to anoikis.
Conclusion
By constructing an anoikis scoring system and anoikis-related risk signatures, we revealed the correlations between anoikis in BLCA and patient clinical characteristics, prognosis and immunotherapeutic response, with insights into the underlying regulatory mechanisms. These promising predictive tools may aid in the development of more effective and individualized treatment strategies for patients with BLCA in the coming 5 years.
SRC benefits survival in bladder cancer (BLCA) by regulating necroptosis, and its involvement in EGFR/SRC/STAT3 signaling has been described.
Anoikis regulators (ANRs) in cluster A benefit BLCA patients mainly through metabolic pathways.
The anoikis scoring system had excellent performance in determining BLCA survival status and in predicting prognosis in both early and advanced disease stages.
The anoikis scoring system could be implemented to guide immunotherapy planning.
The role of CSPG4 may be more relevant in advanced or high-grade BLCA.
Vorinostat showed the highest sensitivity associated with the mRNA risk signature.
The lncRNA risk signature effectively predicted the prognosis of BLCA patients.
The mRNA risk signature was the most accurate in predicting the prognosis of BLCA patients.
Conceptualization: YQ Shu; methodology: YQ Shu and XZ Wang; software: XZ Wang and ZY Wang; validation: XZ Wang, ZY Wang and Q Wei; formal analysis: XZ Wang, ZY Wang, Q Wei and HY Wang; data curation: XZ Wang; writing – original draft preparation: XZ Wang; writing – review&editing: XZ Wang, ZY Wang, Q Wei, HY Wang and YQ Shu; visualization: XZ Wang; supervision: YQ Shu; project administration: YQ Shu; funding acquisition: YQ Shu.
Competing interests disclosure
The authors have no competing interests or relevant affiliations with any organization or entity with the subject matter or materials discussed in the manuscript. This includes employment, consultancies, honoraria, stock ownership or options, expert testimony, grants or patents received or pending, or royalties.
Writing disclosure
No writing assistance was utilized in the production of this manuscript.
Ethical conduct of research
This study was conducted in accordance with the Declaration of Helsinki and was approved by the Research Ethics Committee of the First Affiliated Hospital of Nanjing Medical University, China (approval no. 2021-SRFA-016 on 1 March 2021).
Informed consent was obtained from all patients involved in this study, and ethics approval was granted. The authors collected eight bladder cancer tissue samples and matched adjacent nontumor tissue samples from routine surgeries at the First Affiliated Hospital of Nanjing Medical University in China. The clinical registration number for this study is NCT04658862.
Data sharing statement
The authors downloaded gene expression files and information on clinical characteristics of patients with BLCA from the TCGA (https://portal.gdc.cancer.gov/) BLCA cohort and the GSE31684 dataset from GEO (www.ncbi.nlm.nih.gov/geo/). Expression data and clinical annotations were also obtained for the IMvigor210 phase II trial study (http://research-pub.gene.com/IMvigor210CoreBiologies). All expression data were standardized to transcripts per million. Single-nucleotide mutation annotation and copy number variation data were obtained from the TCGA-BLCA cohort. A gene set containing 19 ANRs was obtained from the GO Biological Process Annotations dataset (Gene Ontology, GO_2000209).
Supplemental Material
Download MS Word (20.1 MB)Supplemental Material
Download MS Excel (2.5 MB)Acknowledgments
The authors thank all staff members of the Department of Oncology and Jiangsu Key Lab of Cancer Biomarkers, the First Affiliated Hospital of Nanjing Medical University (Nanjing, China), and also the National Natural Science Foundation of China for their support.
Supplementary data
To view the supplementary data that accompany this paper please visit the journal website at: www.tandfonline.com/doi/suppl/10.2217/epi-2023-0240
Financial disclosure
This research was funded by the National Natural Science Foundation of China (grants. 82172889 and 82203010) and by the Clinical Frontier Technology of Jiangsu Provincial Department of Science and Technology in China (grant BE2020783).
The authors have no other relevant affiliations or financial involvement with any organization or entity with a financial interest in or financial conflict with the subject matter or materials discussed in the manuscript apart from those disclosed.
References
- Sung H , FerlayJ , SiegelRLet al. Global Cancer Statistics 2020: GLOBOCAN estimates of incidence and mortality worldwide for 36 cancers in 185 countries. CA Cancer J. Clin.71(3), 209–249 (2021).
- Patel VG , OhWK , GalskyMD. Treatment of muscle-invasive and advanced bladder cancer in 2020. CA Cancer J. Clin.70(5), 404–423 (2020).
- Tran L , XiaoJF , AgarwalN , DuexJE , TheodorescuD. Advances in bladder cancer biology and therapy. Nat. Rev. Cancer21(2), 104–121 (2021).
- Lenis AT , LecPM , ChamieK , MshsMD. Bladder cancer: a review. JAMA324(19), 1980–1991 (2020).
- Galluzzi L , VitaleI , AaronsonSAet al. Molecular mechanisms of cell death: recommendations of the Nomenclature Committee on Cell Death 2018. Cell Death Differ.25(3), 486–541 (2018).
- Raeisi M , ZehtabiM , VelaeiKet al. Anoikis in cancer: the role of lipid signaling. Cell Biol. Int.46(11), 1717–1728 (2022).
- Han HJ , SungJY , KimSHet al. Fibronectin regulates anoikis resistance via cell aggregate formation. Cancer Lett.508, 59–72 (2021).
- D’amato NC , RogersTJ , GordonMAet al. A TDO2-AhR signaling axis facilitates anoikis resistance and metastasis in triple-negative breast cancer. Cancer Res.75(21), 4651–4664 (2015).
- Mihalopoulos M , DoveyZ , ArcherMet al. Repurposing of α1-adrenoceptor antagonists: impact in renal cancer. Cancers (Basel)12(9), (2020).
- Cao L , HanL , ZhangZet al. Involvement of anoikis-resistance in the metastasis of hepatoma cells. Exp. Cell Res.315(7), 1148–1156 (2009).
- Brunquell C , BiliranH , JenningsS , IrelandSK , ChenR , RuoslahtiE. TLE1 is an anoikis regulator and is downregulated by Bit1 in breast cancer cells. Mol. Cancer Res.10(11), 1482–1495 (2012).
- Douma S , Van LaarT , ZevenhovenJet al. Suppression of anoikis and induction of metastasis by the neurotrophic receptor TrkB. Nature430(7003), 1034–1039 (2004).
- Khan SU , FatimaK , MalikF. Understanding the cell survival mechanism of anoikis-resistant cancer cells during different steps of metastasis. Clin. Exp. Metastasis39(5), 715–726 (2022).
- Xiao Y , DongY , YuTet al. Characterization of the immune related lncRNAs in bladder cancer to aid immunotherapy. Front. Immunol.13, 941189 (2022).
- Wang Y , YangX , SunXet al. Bone marrow infiltrated Lnc-INSR induced suppressive immune microenvironment in pediatric acute lymphoblastic leukemia. Cell Death Dis.9(10), 1043 (2018).
- Brahic M , BureauJF , MichielsT. The genetics of the persistent infection and demyelinating disease caused by Theiler’s virus. Annu. Rev. Microbiol.59, 279–298 (2005).
- Sharma S , FindlayGM , BandukwalaHSet al. Dephosphorylation of the nuclear factor of activated T cells (NFAT) transcription factor is regulated by an RNA–protein scaffold complex. Proc. Natl. Acad. Sci. U S A108(28), 11381–11386 (2011).
- Balar AV , GalskyMD , RosenbergJEet al. Atezolizumab as first-line treatment in cisplatin-ineligible patients with locally advanced and metastatic urothelial carcinoma: a single-arm, multicentre, phase 2 trial. Lancet389(10064), 67–76 (2017).
- Ritchie ME , PhipsonB , WuDet al. limma powers differential expression analyses for RNA-sequencing and microarray studies. Nucl. Acids Res.43(7), e47 (2015).
- Gao Y , LinT , PanJet al. Fuzzy sparse deviation regularized robust principal component analysis. IEEE Trans. Image Process31, 5645–5660 (2022).
- Yoshihara K , ShahmoradgoliM , MartínezEet al. Inferring tumour purity and stromal and immune cell admixture from expression data. Nat. Commun.4, 2612 (2013).
- Jiang P , GuS , PanDet al. Signatures of T cell dysfunction and exclusion predict cancer immunotherapy response. Nat. Med.24(10), 1550–1558 (2018).
- Lai H , ChengX , LiuQet al. Single-cell RNA sequencing reveals the epithelial cell heterogeneity and invasive subpopulation in human bladder cancer. Int. J. Cancer149(12), 2099–2115 (2021).
- Wolf FA , AngererP , TheisFJ. SCANPY: large-scale single-cell gene expression data analysis. Genome Biol.19(1), 15 (2018).
- Yang W , SoaresJ , GreningerPet al. Genomics of Drug Sensitivity in Cancer (GDSC): a resource for therapeutic biomarker discovery in cancer cells. Nucl. Acids Res.41(Database issue), D955–961 (2013).
- Yin J , WangJ , ZhangXet al. A missing piece of the puzzle in pulmonary fibrosis: anoikis resistance promotes fibroblast activation. Cell Biosci.12(1), 21 (2022).
- Zhong X , RescorlaFJ. Cell surface adhesion molecules and adhesion-initiated signaling: understanding of anoikis resistance mechanisms and therapeutic opportunities. Cell Signal.24(2), 393–401 (2012).
- Ploussard G , DaneshmandS , EfstathiouJAet al. Critical analysis of bladder sparing with trimodal therapy in muscle-invasive bladder cancer: a systematic review. Eur. Urol.66(1), 120–137 (2014).
- Xu W , AnwaierA , MaCet al. Multi-omics reveals novel prognostic implication of SRC protein expression in bladder cancer and its correlation with immunotherapy response. Ann. Med.53(1), 596–610 (2021).
- Zhou Z , ZhangZ , ChenHet al. SBSN drives bladder cancer metastasis via EGFR/SRC/STAT3 signalling. Br. J. Cancer127(2), 211–222 (2022).
- Chevalier MF , TrabanelliS , RacleJet al. ILC2-modulated T cell-to-MDSC balance is associated with bladder cancer recurrence. J. Clin. Invest.127(8), 2916–2929 (2017).
- Pichler R , GruenbacherG , CuligZet al. Intratumoral Th2 predisposition combines with an increased Th1 functional phenotype in clinical response to intravesical BCG in bladder cancer. Cancer Immunol. Immunother.66(4), 427–440 (2017).
- Biot C , RentschCA , GsponerJRet al. Preexisting BCG-specific T cells improve intravesical immunotherapy for bladder cancer. Sci. Transl. Med.4(137), 137ra172 (2012).
- Antonelli AC , BinyaminA , HohlTM , GlickmanMS , Redelman-SidiG. Bacterial immunotherapy for cancer induces CD4-dependent tumor-specific immunity through tumor-intrinsic interferon-γ signaling. Proc. Natl. Acad. Sci. U S A117(31), 18627–18637 (2020).
- Honsho M , OkumotoK , TamuraS , FujikiY. Peroxisome biogenesis disorders. Adv. Exp. Med. Biol.1299, 45–54 (2020).
- Farré JC , MahalingamSS , ProiettoM , SubramaniS. Peroxisome biogenesis, membrane contact sites, and quality control. EMBO Rep.20(1), (2019).
- Johnstone RW , RuefliAA , LoweSW. Apoptosis: a link between cancer genetics and chemotherapy. Cell108(2), 153–164 (2002).
- De Jong FC , RuttenVC , ZuiverloonTCM , TheodorescuD. Improving anti-PD-1/PD-L1 therapy for localized bladder cancer. Int. J. Mol. Sci.22(6), (2021).
- Wang L , SaciA , SzaboPMet al. EMT- and stroma-related gene expression and resistance to PD-1 blockade in urothelial cancer. Nat. Commun.9(1), 3503 (2018).
- Schneider AK , ChevalierMF , DerréL. The multifaceted immune regulation of bladder cancer. Nat. Rev. Urol.16(10), 613–630 (2019).
- Yang J , LiaoQ , PriceMet al. Chondroitin sulfate proteoglycan 4, a targetable oncoantigen that promotes ovarian cancer growth, invasion, cisplatin resistance and spheroid formation. Transl. Oncol.16, 101318 (2022).
- Zuo Y , XuX , ChenM , QiL. The oncogenic role of the cerebral endothelial cell adhesion molecule (CERCAM) in bladder cancer cells in vitro and in vivo. Cancer Med.10(13), 4437–4450 (2021).
- Du J , LiZ , LiQZet al. Enoyl coenzyme a hydratase domain-containing 2, a potential novel regulator of myocardial ischemia injury. J. Am. Heart Assoc.2(5), e000233 (2013).
- Owens TW , ValentijnAJ , UptonJPet al. Apoptosis commitment and activation of mitochondrial Bax during anoikis is regulated by p38MAPK. Cell Death Differ.16(11), 1551–1562 (2009).
- Liu Z , LiH , DerouetMet al. Oncogenic Ras inhibits anoikis of intestinal epithelial cells by preventing the release of a mitochondrial pro-apoptotic protein Omi/HtrA2 into the cytoplasm. J. Biol. Chem.281(21), 14738–14747 (2006).
- Liu J , CuiJ , ZhaoSet al. Ferroptosis-related long noncoding RNAs have excellent predictive ability for multiomic characteristics of bladder cancer. Oxid. Med. Cell Longev.2022, 9316847 (2022).