
Abstract
Aim: To explore the overall methylation changes in liver tissues during the formation of gallstones, as well as the key pathways and genes involved in the process. Methods: Reduced-representation bisulfite sequencing and RNA sequencing were conducted on the liver tissues of mice with gallstones and control normal mice. Results: A total of 8705 differentially methylated regions in CpG and 1410 differentially expressed genes were identified. The joint analysis indicated that aberrant DNA methylation may be associated with dysregulated gene expression in key pathways such as cholesterol metabolism and bile secretion. Conclusion: We propose for the first time that methylation changes in some key pathway genes in liver tissue may be involved in the formation of gallstones.
Tweetable abstract
The methylation status and downstream expression levels of many key pathways involved in gallstones formation were altered in the liver tissue of mice with gallstones.
Gallstones are one of the most common gastrointestinal diseases and cause huge medical costs every year around the world.
The specific causes of gallstone formation are currently not fully understood. It is not yet known whether DNA methylation is related to the formation of gallstones.
This study revealed the overall methylation changes in liver tissue of gallstone mice through reduced-representation bisulfite sequencing and RNA sequencing.
A total of 8705 differentially methylated regions in CpG and 1410 differentially expressed genes were identified in the analyzed samples.
The methylation status of genes in numerous pathways closely related to gallstone formation, including cholesterol metabolism and bile secretion, was significantly altered.
The joint analysis of methylome and transcriptome data indicated that aberrant DNA methylation may be associated with dysregulated gene expression in key pathways such as cholesterol metabolism and bile secretion.
In this study, we first proposed that methylation changes in some key pathways in liver tissue may be related to the formation of gallstones.
This research result provides a new perspective for understanding the formation mechanism of gallstones.
Gallstones are one of the most common gastrointestinal diseases, with a prevalence rate of approximately 10–20% in the US population [Citation1]. In recent years, with the improvement of living standards, the morbidity of this disease has been increasing [Citation2]. In terms of the composition of stones, more than 90% of gallstones are mainly composed of cholesterol [Citation3]. It is generally known that the liver is the main route for cholesterol excretion and plays a critical role in cholesterol homeostasis and lipoprotein metabolism [Citation4]. Therefore, exploring liver lipid metabolism and its related regulatory mechanisms may be of great significance for understanding the formation of gallstones.
DNA methylation is the process of selectively adding methyl groups to cytosine under the action of DNA methyltransferases, ultimately forming 5′-cytosine. It mainly occurs in regions rich in dinucleotide CpG islands in mammals and is an important epigenetic marker [Citation5]. Numerous researches have shown that changes of DNA methylation are involved in the occurrence and development of various diseases, such as autoimmune diseases, metabolic disorders, neurological diseases and cancer [Citation6–10]. One study found that the number and degree of epigenetic changes (mainly DNA methylation and copy number variations) in patients with gallbladder disease in Chile gradually increased along the sequence of gallstone disease, low-grade dysplasia, high-grade dysplasia and gallbladder cancer [Citation11]. Similar studies have found that the methylation status and protein expression of certain genes change during the progression of gallbladder cancer, thereby promoting the progression of the disease [Citation12–14]. Although there have been several articles reporting on the methylation status of gallbladder diseases in recent years, almost all of them are based on the pathological process from gallstone disease to gallbladder cancer. There is currently no research on whether DNA methylation in liver tissue affects the formation process of gallstones.
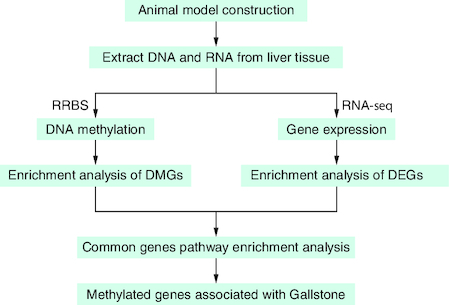
In this study, we collected liver tissues obtained from a gallstone group of mice (fed with lithogenic feed) and a control group of mice (fed with a normal diet) and subjected them to RNA sequencing (RNA-seq) and reduced-representation bisulfite sequencing (RRBS) to discover the methylation landscape of liver-related genes associated with the formation of gallstones ().
Figure 1. Discovery strategy.
Reduced-representation bisulfite sequencing and RNA sequencing were performed on the liver tissues of gallstone mice to explore the genomic methylation landscape and the methylation and expression changes of key pathway genes during the formation of gallstones.
DEG: Differentially expressed gene; DMG: Differentially methylated gene; RNA-seq: RNA sequencing; RRBS: Reduced-representation bisulfite sequencing.
Materials & methods
Animals & diet
5-week-old male C57BL/6 mice were purchased from Hangzhou Ziyuan Laboratory Animal Technology Co., Ltd (Hangzhou, China). All mice were housed at a constant temperature (25 ± 2°C), with five mice per cage, and allowed to drink freely, with alternating light and darkness for 12 h. All animals underwent a 2-week transitional diet and were fed with normal feed. After 2 weeks, all mice were randomly divided into two groups: the control group (fed with normal feed), and the stone group, fed with lithogenic feed containing high cholesterol (1%) and sodium cholate (0.5%). Each group consisted of ten mice, with a total feeding period of 10 weeks.
Liver collection & histological staining
All mice were fasted for 12 h at the end of the group feeding. After anesthesia with isoflurane (Ante Animal Husbandry Technology Co., Ltd, Shandong, China), the mice were executed by cervical dislocation, and the formation of gallstones was observed after opening the abdominal cavity of the mice. Liver tissues of mice were completely excised, and each group included ten liver samples. Four liver tissues from each group were taken for RRBS and RNA-seq (named as stone 1–4 and control 1–4); another four liver tissues from each group were taken for RT-PCR validation experiments (named as stone 5–8 and control 5–8); the last two liver tissues from each group were fixed with 4% paraformaldehyde and stained with hematoxylin and eosin (named as stone 9–10 and control 9–10).
RNA isolation & RNA-seq
The RNA from each sample, which consisted of four liver tissues per group, was isolated using the TRIzol® reagent from Invitrogen (Thermo Fisher, Suzhou, China). Following the manufacturer’s instructions, the RNA was then processed with RNase-free DNase I for a duration of 30 min. Poly(A)-containing mRNA was purified from ∼1 µg of total RNA using Oligo(dT) beads (Beyotime, Shanghai, China). The captured mRNA was fragmented into lengths of between 100 and 200 nucleotides by using divalent cations at a high temperature. The fragmented mRNA underwent reverse transcription using SuperScript™ II (Thermo Fisher, Suzhou, China) and was subsequently converted into double-stranded cDNA through random priming with the aid of RNaseH and DNA polymerase I (Thermo Fisher, Shanghai, China). After being purified, the double-stranded cDNA underwent blunt-ending, addition of dA to the 3′ end and adapter ligation. The final step involved performing PCR to enrich the adapter-ligated cDNA. The libraries were analyzed using the Agilent Bioanalyzer 2100 (Agilent, Beijing, China) and quantified via qPCR before being sequenced on the Illumina sequencing platform (Illumina, CA, USA).
Analysis of RNA-seq results
The raw sequences obtained from sequencing were filtered using the software Cutadapt [Citation15] to obtain clean reads. After obtaining valid data (clean read), it was aligned to the reference genome (mm10) using the software HISAT2 [Citation16]. Gene expression levels were estimated by counting sequenced sequences (reads) localized to genomic regions or exonic regions of genes, and the software used to calculate expression was StringTie [Citation17]. After obtaining the gene expression of each sample, in order to determine which genes had a significant change in expression in the stone group compared with the control group, we performed differential gene analysis on each group of samples, including both known and unknown genes in the annotation file. Given that the groups in this experiment had biological replicates, we used the most widely used differential gene analysis software for differential gene analysis, which is DESeq2 [Citation18]. The different expression levels of each gene were calculated. Then a certain threshold, defined as an adjusted p-value < 0.05 and an absolute value of log2 (fold change) >1, was used to filter out the statistically significant differential genes. Gene ontology (GO) and Kyoto Encyclopedia of Genes and Genomes (KEGG) annotations were performed for searching possible regulatory pathways. The R package clusterProfiler [Citation19] was used for enrichment analysis of those differential genes, and a p-value < 0.05 was considered to be a critical value for assessing whether a gene could be enriched to the GO term or KEGG term.
DNA extraction & RRBS
RRBS was performed on four mouse livers from each of the stone and control groups. Approximately 1 μg of genomic DNA, admixed with unmethylated λ-DNA, was subjected to digestion by the MspI enzyme for a duration of 16 h at 37°C. Post digestion, the libraries were constructed in accordance with the Illumina paired-end protocol with certain modifications [Citation20]. To summarize: the purified, digested DNA was subsequently treated with a mixture comprising T4 DNA polymerase, Klenow fragment and T4 polynucleotide kinase to facilitate repair, blunting and phosphorylation of the ends. The blunt DNA was then 3′ adenylated with Klenow fragment (3′–5′ exo-) before being ligated to adaptors produced using 5′-methylcytosine instead of cytosine by T4 DNA ligase. After each step, purification of the DNA was achieved using the MinElute PCR Purification Kit (Qiagen, Shanghai, China). The EZ DNA Methylation-Gold Kit™ (Zymo, Beijing, China) was used to convert unmethylated cytosine to uracil following the provided instructions. Ultimately, PCR was executed in a final reaction volume of 50 μl, which included 0.5 μl of JumpStart™ Taq DNA polymerase, 2 μl of PCR primers, 4 μl of 2.5 mM dNTP, 5 μl of 10 × buffer, 18.5 μl of water and 20 μl of adapter-ligated DNA, followed by a 12-cycle thermocycling program of 94°C for 1 min, 94°C for 10 s, 62°C for 30 s and 72°C for 30 s. The product was then extended at 72°C for 5 min and kept at 12°C. Prior to analysis using the Illumina sequencing platform, libraries of selected sizes were analyzed using the Bioanalyzer analysis system (Agilent, CA, USA) and quantified via real-time PCR.
RRBS results analysis
The reads after quality control were aligned to the reference genome (mm10) based on sequence similarity with the reference genome; this process was performed using the software BSMAP [Citation21]. After filtering the raw data, checking the sequencing error rate, examining the GC content distribution and accomplishing the alignment with the host reference genome, the nonhost sequences (nonhost reads) were obtained. Subsequent analyses were performed on the aligned original sequences (nonhost sequences). The methylation level of each sample was also assessed using BSMAP, and CpG sites were used to find differentially methylated regions (DMRs). Then intergroup DMRs were identified using the software metilene [Citation22], which utilizes a binary segmentation algorithm combined with double statistical tests (Mann-Whitney U test and 2D Kolmogorov–Smirnov test) to quickly achieve de novo detection of DMRs between pairs of samples or two groups of samples. The DMRs were corrected by multiple testing and annotated to the corresponding genes. The detection rules included: a sequencing depth of each CpG site greater than or equal to the screening depth; methylation difference of CpG sites ≥0.1; the number of differentially methylated CpG sites in the region was at least five; the distance between neighboring differentially methylated CpG sites was ≤300 bp; q-value (or MWU-test p-value) <0.05. The genes with at least one DMR annotated to their promoter or gene body were called differentially methylated genes (DMGs). Finally, the screened DMGs were subjected to functional enrichment analysis. The enrichment analysis was performed using Fisher’s test combined with Benjamini–Hochberg correction.
RRBS–RNA-seq correlation analysis
To determine the correlation between methylation and expression, we jointly analyzed RRBS and RNA-seq data. Pearson correlation analysis was performed between the expression and methylation of significant genes in the promoter and gene body regions. The critical p-value was set to 0.05. Venn analysis was used to compare the DMR annotation results of CGs in the promoter and gene body regions with the results of differentially expressed genes (DEGs), counting the overlapping and unique significant differential genes. The KEGG enrichment analysis was performed on the overlapping genes using the software Allenricher [Citation23]. Overlapping genes enriched in the pathways related to the formation of gallstones were used to construct the differentially expressed protein interaction networks using the STRING database (https://string-db.org/).
Validation of RNA-seq data by RT-qPCR
The candidate DEGs were tested by RT-qPCR to verify the reliability of the analysis. Four mouse liver tissues were taken from each group for validation. Primer analysis was performed using Oligo 6.0 (Sangon Biotech, Shanghai, China), and the list of primer designs is shown in Supplementary Table 1. Total RNA extraction was performed using the Ultrapure RNA Kit (CWBIO, Taizhou City, China). cDNA was synthesized using EasyScript® One-Step gDNA Removal and cDNA Synthesis SuperMix (Transgen, Beijing, China) according to the manufacturer’s protocol. RT-qPCR (SYBR® Green I method; relative quantification) was used for mRNA expression analysis. The qPCR kit used was the TransStart Green qPCR SuperMix (Transgen), and the detection machine used was the LightCycler96 (Roche, Basel, Switzerland). Each sample was tested three times. The relative expression of each gene was calculated using the 2-ΔΔCt method. Mouse actin was used as an internal control for normalization. The statistical significance of the difference in mRNA expression levels between the stone group and the control group was analyzed using SPSS software (SPSS 22.0, IBM Corp., NY, USA). Visual graphing of the expression quantities was performed using GraphPad Prism 9.0 software (GraphPad Software, Inc., CA, USA).
Statistical analysis
The data are expressed as mean ± standard deviation (SD). The identification of DMRs between two groups was performed using a binary segmentation algorithm combined with double statistical tests (MWU test and 2D KS test). The comparison of expression levels between two groups was conducted using Student’s t-test or Welch’s t-test. Correlations were calculated using Pearson’s correlation test. When p < 0.05, the difference was considered statistically significant.
Results
Stone formation & liver histological staining
After 10 weeks of feeding, no stones were found in the gallbladders of the control group mice, and the bile of these mice was clear (Supplementary Figure 1A). The gallbladder of almost every mouse in the stone group containing more or less stones could be observed clearly, and the bile appeared turbid compared with that of the control group (Supplementary Figure 1B). The hematoxylin and eosin staining of the liver tissues in the control group showed clear cellular structure and no obvious lesions (Supplementary Figure 1C), while a large number of steatotic vacuoles and disorganized texture of hepatocytes were observed in the liver tissues of mice in the stone group (Supplementary Figure 1D).
Identification of DEGs
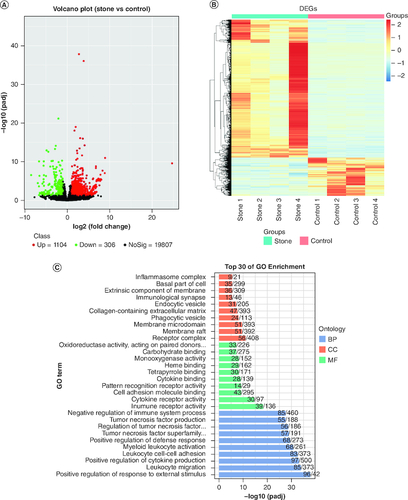
RNA-seq was used to detect gene expression alterations across the entire genome in two sets of liver samples. For RNA-seq samples, an average of 32 million (SD: ±7.7 million) clean reads were obtained. More than 87% (SD: ±1.48%) of the reads were uniquely aligned to unique positions on the reference genome (Supplementary Table 2). After obtaining the gene expression data for each sample, a differential gene analysis was performed on the two groups of samples. The differential genes that satisfied the criteria of an adjusted p-value value < 0.05 and an absolute value of log2 (fold change) >1 were considered statistically significant. A total of 1410 DEGs were finally identified between the stone group and the control group. Among these genes, there were 1104 significantly upregulated genes and 306 significantly downregulated genes (A & Supplementary Table 3). Cluster analysis was performed on the DEGs. B shows the expression levels of DEGs in all samples.
Figure 2. Expression and enrichment analysis of differentially expressed genes in the liver tissues of the stone and control groups (stone 1–4, control 1–4).
(A) Volcano plot showing the DEGs between the stone and control groups. Each dot corresponds to a gene, and color corresponds to the direction. (B) Heat map along with hierarchical clustering showing the most significant DEGs expressed in the stone and control groups. (C) Gene ontology enrichment of DEGs. (D) Kyoto Encyclopedia of Genes and Genomes enrichment of DEGs.
DEG: Differentially expressed gene.
Functional enrichment analysis of differential mRNAs
After identifying DEGs between groups, we conducted enrichment analysis on these genes. The results of the GO enrichment analysis indicated that the top pathways of enrichment were: positive regulation of response to external stimulus (GO:0032103; p = 2.14 × 10-42), leukocyte migration (GO:0050900; p = 4.28 × 10-38) and cytokine production (GO:0001819; p = 4.65 × 10-37) (C & Supplementary Table 4). The top three pathways for the KEGG enrichment analysis results were: hematopoietic cell lineage (mmu04640; p = 4.01 × 10⁻¹¹), leishmaniasis (mmu05140; p = 5.53 × 10⁻¹¹) and steroid biosynthesis (mmu00100; p = 5.39 × 10⁻¹⁰) (D & Supplementary Table 5). Among the top 20 enriched pathways, two were found to be closely related to the formation of gallstones: cholesterol metabolism (mmu04979; p = 2.97 × 10⁻⁶) and bile secretion (mmu04976; p = 2.77 × 10⁻⁵).
Distribution of methylation levels in the enzyme digestion-enriched fragment regions of each sample genome
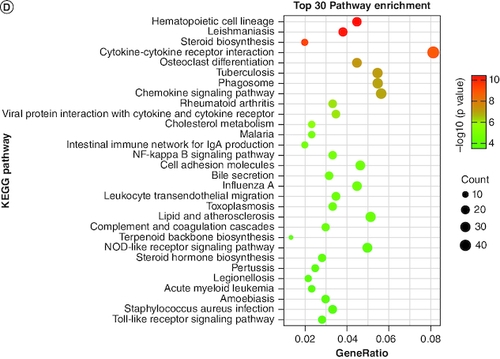
To characterize the DNA methylation patterns of the liver tissues of gallstone mice, we performed RRBS analysis on the liver tissue samples from four stone groups and four control groups of mice. The sequencing of the RRBS libraries yielded an average of 70 million (SD: ±1.02 million) clean reads per sample, with an average alignment rate of 91.21% (SD: ±0.59%) and a conversion rate of 99.14% (SD: ±0.14%) (Supplementary Table 6). In order to effectively boost the number of CG loci in the subsequent analyses, subsequent analyses of CpG were performed using MergedCG data. Under the effective sequencing depth, the average methylation levels of three types of cytosines (MergedCG, CHG, CHH) within the genomic enzyme digestion-enriched fragment regions were counted separately. As shown in A, the average methylation rate of MergedCG type cytosines in the sequencing samples was close to 60%, while the average methylation rate of CHG and CHH type cytosines was basically less than 1% (Supplementary Table 7). This shows that genomic methylation is mainly concentrated in MergedCG type cytosines, which is consistent with the pattern of genomic methylation in mammals [Citation24]. No significant difference was found in the average methylation rate between the two groups. Based on different gene structural elements, the genome sequence was divided into three parts: promoter, gene body and 2000 bp downstream transcriptional termination site (down2k). The distribution of methylation levels at CG sites in these gene structural elements was then calculated. As shown in B, the average methylation rate in the gene body region of each sample was the highest. Subsequently, the methylation levels of CpG islands and their upstream and downstream regions were quantified. The methylation levels in the CpG island regions were found to be the lowest, lower than those in the upstream and downstream regions (C). There was no significant difference in the distribution of methylation levels at the CG sites of each gene’s structural elements between the two groups of samples.
Figure 3. Methylation levels of the enzyme digestion-enriched fragment region and distribution of differential methylation regions (stone 1–4, control 1–4).
(A) The average global methylation levels of the eight samples. Global methylation levels show higher methylation levels of CG; the merged CG methylation level is higher than the other contexts for all the samples. (B & C) Methylation levels of gene elements in each sample. (D) Proportions of three types of differential methylation regions (CG, CHG, CHH). (E) Distribution of differentially methylated regions on chromosomes. (F) Distribution of hypermethylated and hypomethylated regions on promoters and gene bodies.
CGI: CpG island; down2k: 2000 bp Downstream transcriptional termination site; H: Any nucleotide.
Identification & statistics of DMRs
A total of 9881 DMRs of three different types were identified: mergedCG (8705), CHG (686) and CHH (490), as shown in D. The follow-up study focused on the mergedCG type of DMRs, which consisted of 4671 hypermethylated DMRs and 4034 hypomethylated DMRs (Supplementary Table 8). Based on the location information of DMRs, the distribution preferences of DMRs on chromosomes and gene elements (primarily promoters and exons) were statistically analyzed. There were significantly more hypermethylated DMRs than hypomethylated DMRs, except for the Y chromosome and a few autosomes (E). There were significantly more DMRs in the exon regions (1347 hypermethylated DMRs and 1025 hypomethylated DMRs) than in the promoter regions (640 hypermethylated DMRs and 575 hypomethylated DMRs). In addition, there was a predominance of hypermethylated DMRs within these two gene elements (F).
Functional enrichment analysis of DMR modified genes
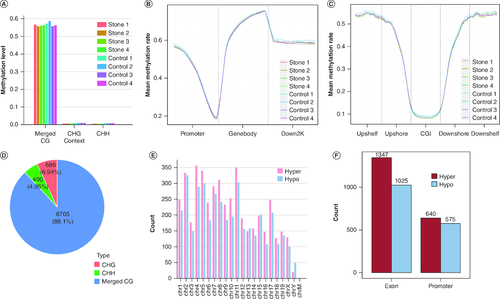
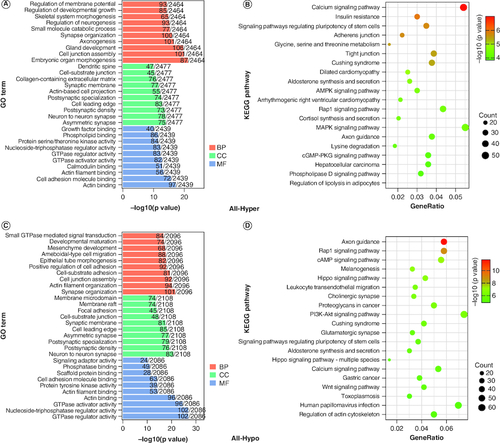
Genes with at least one DMR annotation on their promoter or gene body were termed DMGs. A total of 3059 hypermethylated DMGs and 2644 hypomethylated DMGs were identified through gene annotation by DMRs. In order to determine the functions of these DMGs, we performed GO and KEGG enrichment analyses on the hypermethylated and hypomethylated DMGs. The GO analysis showed that the hypermethylated genes were mainly enriched in embryonic organ morphogenesis (GO:0048562; p = 6.49 × 10⁻²²), cell junction assembly (GO:0034329; p = 1.15 × 10⁻²⁰) and gland development (GO:0048732; p = 2.03 × 10⁻²⁰) (A & Supplementary Table 9). The KEGG results showed that the top three enriched pathways were calcium signaling pathway (mmu04020; p = 1.02 × 10⁻⁷), insulin resistance (mmu04931; p = 1.16 × 10⁻⁶) and signaling pathways regulating pluripotency of stem cells (mmu04550; p = 1.83 × 10⁻⁶) (B & Supplementary Table 10). The top three enrichment results of GO analysis of hypomethylated genes were synapse organization (GO:0050808; p = 3.86 × 10⁻²²), actin filament organization (GO:0007015; p = 7.75 × 10⁻²¹) and cell junction assembly (GO:0034329; p = 9.97 × 10⁻²¹) (C & Supplementary Table 11). The top three pathways for KEGG enrichment analysis were axon guidance (mmu04360; p = 1.81 × 10⁻¹²), Rap1 signaling pathway (mmu04015; p = 1.26 × 10⁻⁹) and cAMP signaling pathway (mmu04024; p = 5.18 × 10⁻⁸) (D & Supplementary Table 12).
Figure 4. Enrichment analysis of differentially methylated genes.
(A & B) GO and KEGG enrichment analysis of hypermethylated genes. (C & D) GO and KEGG enrichment analysis of hypomethylated genes.
BP: Biological process: CC: Cellular component; GO: Gene ontology; KEGG: Kyoto Encyclopedia of Genes and Genomes; MF: Molecular function.
RRBS–RNAseq correlation analysis results
In order to determine whether the differential expression of genes between the two groups was related to DNA methylation changes, we conducted association analyses on all DEGs with DMGs. Pearson association analysis between expression and methylation was first performed, and scatter plots were used to plot the correlation coefficients of the promoter and gene body regions. In addition, density distribution plots were used to plot the distribution of the correlation coefficients of the significant genes in the two regions (A). It can be observed from the plot that the density of gene distribution is higher for genes that exhibit a significant negative correlation between methylation and expression in both the promoter and gene body regions. Next, the Venn analysis of DMGs and DEGs in the promoter and gene body regions revealed 59 and 305 overlapping genes in these two regions, respectively (B & C). Subsequently, KEGG pathway enrichment analysis was conducted on these overlapping genes. The top three pathways for enrichment of 59 overlapping genes in the promoter region were leukocyte transendothelial migration (mmu04670; p = 5.34 × 10⁻⁴), cell adhesion molecules (mmu04514; p = 2.64 × 10⁻³) and regulation of the actin cytoskeleton (mmu04810; p = 6.06 × 10⁻³) (D & ). The top three pathways for the enrichment of the 305 overlapping genes in the gene body region were bile secretion (mmu04976; p = 7.43 × 10⁻⁷), intestinal immune network for IgA production (mmu04672; p = 7.01 × 10⁻⁵) and chemokine signaling pathway (mmu04062; p = 8.16 × 10⁻⁵) (E, ). The pathways related to bile secretion, cholesterol metabolism and primary bile acid biosynthesis were all found in the enriched pathways of the overlapping genes in the promoter and gene body regions (Supplementary Tables 13 & 14). These pathways were enriched for a total of 15 significant genes, with three genes (SLC51B, APOC2, CYP8B1) annotated in the promoter region and 14 genes (CYP7A1, UGT1A9, HMGCR, SLC22A7, ABCC4, ADCY7, ATP1A3, UGT1A5, ABCG5, UGT1A10, SLC51B, ANGPTI8, LIPG, CYP8B1) in the gene body region. Among these genes, SLC51B and CYP8B1 are the intersection genes of the two regions (). Among these 15 significant genes, there are seven upregulated and eight downregulated genes (A). In order to investigate the interaction between these genes, an interaction network of their differentially expressed proteins was constructed using the STRING database (B). From B, it can be seen that the CYP7A1 gene is located at the center of the protein interaction network; other key node genes are CYP8B1, SLC51B, ABCG5, APOC2, ABCC4 and SLC22A7.
Figure 5. Gene expression and methylation co-analysis.
(A) Pearson correlation analysis between expression and methylation. (B & C) Overlapping genes between DMGs and DEGs in the promoter and gene body regions. (D & E) KEGG pathway enrichment analysis of overlapping genes in the promoter and gene body regions.
DEG: Differentially expressed gene; DMG: Differentially methylated gene; DMR: Differentially methylated region; KEGG: Kyoto Encyclopedia of Genes and Genomes.
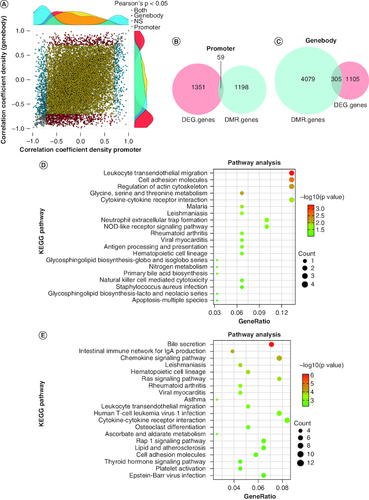
Table 1. Kyoto Encyclopedia of Genes and Genomes pathway enrichment analysis of overlapping genes in promoter and gene body regions (top ten pathways).
Table 2. Methylation and expression of 15 candidate genes.
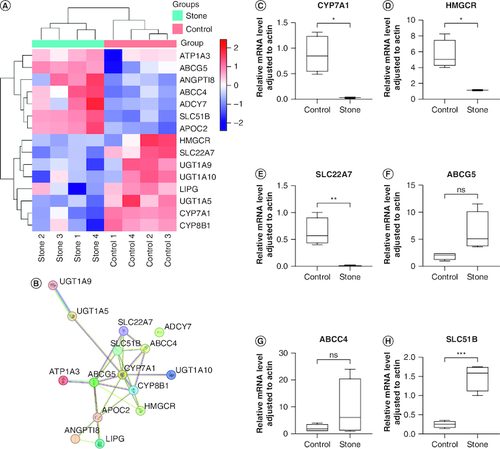
Figure 6. Validation of RNA expression data and overlapping genes in key pathways.
(A) Expression heat map of 15 candidate genes. The color gradient from blue to red in the heat map indicates an increase in the transcription level. (B) Network analysis of 15 candidate genes. (C–H) PCR results of three upregulated and three downregulated genes in mouse liver tissue (stone 5–8, control 5–8). The PCR results are consistent with the RNA sequencing data.
Validation of RNA-seq results
To validate the accuracy of the expression profiles obtained through RNA-seq and DEG analyses, we utilized qRT-PCR to measure the expression levels of three upregulated and three downregulated candidate genes. The RT-qPCR results were generally consistent with the RNA-seq results, confirming the alterations in gene expression levels observed through RNA-seq (C–H & Supplementary Table 15). The difference in gene expression level validation was statistically significant (p < 0.05).
Discussion
The formation of gallstones is a complex process involving hepatic hypersection of cholesterol, gallbladder hypomotility, destruction of intestinal mucosal barrier, genetic factors and other elements. These important factors work together to promote cholesterol crystallization and gallstone formation [Citation25]. However, the pathogenesis of gallstone formation has so far remained unknown. In recent years, it has been found that DNA methylation, as an important epigenetic modification, plays a significant role in the development of many diseases [Citation26–28]. Studying methylation changes in diseases is of great significance for early diagnosis, prevention and treatment. In order to understand whether methylation modification has an impact on the formation of gallstones, we investigated the overall DNA methylation changes in liver tissues from mice with gallstones to find the methylation alterations of some key pathways during the formation of gallstones.
In this study, we conducted a comprehensive analysis of genomic methylation changes and corresponding gene expression changes during the formation of gallstones using RNA-seq and RRBS. Initially, we identified a total of 1410 DEGs between the two groups using RNA-seq. The pathway enrichment analysis of these DEGs revealed that two pathways were closely associated with the formation of gallstones among the top 20 enriched pathways. These pathways were cholesterol metabolism (mmu04979; p = 2.97 × 10⁻⁶) and bile secretion (mmu04976; p = 2.77 × 10⁻⁵). Furthermore, we used RRBS to identify differentially methylated regions between the two groups and performed gene annotation on these regions. A total of 3059 hypermethylated genes and 2644 hypomethylated genes were identified. Hypermethylated genes were significantly enriched in calcium signaling pathway (mmu04020; p = 1.02 × 10⁻⁷), insulin resistance (mmu04931; p = 1.16 × 10⁻⁶) and other pathways. Hypomethylated genes were significantly enriched in Rap1 signaling pathway (mmu04015; p = 1.26 × 10⁻⁹), cAMP signaling pathway (mmu04024; p = 5.18 × 10⁻⁸) and others. We conducted a joint analysis of the identified DEGs and DMGs and screened out overlapping genes between the two. Then the relevant pathways significantly enriched by these overlapping genes were screened through enrichment analysis. We focused on studying several classical pathways that affect the formation of gallstones, such as cholesterol metabolism and bile secretion, as well as the methylation and expression changes of related genes. A total of 15 candidate genes were identified from these classical pathways. Through protein–protein interaction network analysis, it was found that CYP7A1, CYP8B1, ABCG5, ABCC4, SLC51B, SLC22A7 and APOC2 were key nodes in the interaction network. Finally, the reliability of analysis was verified through RT-qPCR.
According to the classical triangular theory, an imbalance in the ratio of cholesterol, phospholipids and bile acids is an important cause and prerequisite for the precipitation of cholesterol crystals in the bile, which in turn leads to the formation of stones [Citation29,Citation30]. In addition to the vast majority of water in bile, the remaining major solute components are cholesterol, bile acids and phospholipids. Cholesterol itself is insoluble in water and is dissolved in bile by the amphiphilic bile acid salts and lecithin, which encapsulate it to form micelles or vesicles. Excessive hepatic cholesterol secretion or decreased secretion of the amphipathic component can cause disruption of the otherwise stable ternary bile salt–cholesterol–phospholipid phase to release free cholesterol. In this study, we found that the screened overlapping genes were significantly enriched in classical pathways such as bile secretion and cholesterol metabolism by RRBS and RNA-seq association analysis. The methylation modifications and differential expression of these classical pathways and key genes may play important roles in multiple aspects of liver cholesterol metabolism and gallstone formation. Starting from lipid transport, exchangeable apolipoproteins represented by apolipoprotein C-II (APOC2) are synthesized in the liver and secreted into the blood, and play an important role in facilitating the exchange of lipids between the liver and blood [Citation31]. Serum APOC2 has been found to be positively correlated with the cholesterol content and cholesterol saturation index of gallbladder bile, which are high risk factors for stone formation [Citation32]. After lipid transport to hepatocytes, members of the liver-specific microsomal cytochrome P450 enzyme family play a key role in cholesterol metabolism and bile acid synthesis. Among them, CYP7A1 is a rate-limiting enzyme in the classical pathway of bile acid synthesis [Citation33]. Nearly 50% of the cholesterol in the human body is converted into bile acids in the liver through catalysis by CYP7A1 and excreted from the body [Citation33–35]. Additionally, CYP8B1 is one of the bile acid synthetases that affects the ratio of cholic acid to chenodeoxycholic acid and the hydrophobicity of the bile acid pool in vivo [Citation36]. Fang et al. found that histone methyltransferase G9a forms a complex with the small heterodimer partner in liver tissue. It inhibits hepatic bile acid biosynthesis by catalyzing the methylation of the Lys9 site (H3K9) of histone 3 of the CYP7A1 and CYP8B1 promoters and downregulating the expression of CYP7A1 and CYP8B1 [Citation37]. This discovery indicates that the CYP7A1 and CYP8B1 genes can regulate their own expression through methylation modification. In this study, we found that the CYP7A1 and CYP8B1 genes in the liver tissue of gallstone mice showed high methylation, and the expression levels of CYP7A1 and CYP8B1 were reduced. Reviewing the experiments of Fang et al., we speculate that DNA methylation in the liver tissue of gallstone mice affects cholesterol metabolism and bile secretion by regulating the expression of these two genes, thereby affecting the formation of gallstones. Unfortunately, this study was only a preliminary screening of differentially expressed and differentially methylated overlapping genes in the liver tissues of mice with gallstones, and no methylation enzymes related to the CYP7A1 and CYP8B1 genes have been found. It is unclear whether there is a necessary relationship between DNA methylation and gene expression.
ATP binding cassette (ABC) and solute-linked carrier (SLC) transporters are two protein superfamilies responsible for the transport of endogenous and exogenous substances. In general, the former is mainly responsible for the excretion of substances, while the latter is mainly responsible for the uptake of substances [Citation38]. In the protein family of ABC transporters, ABCC4 has been shown to be a cotransporter protein of reduced glutathione and bile acids [Citation39]. ABCG5 is an important carrier protein mediating cholesterol efflux to the bile [Citation40]. Yu et al. observed that bile was turbid in transgenic mice overexpressing ABCG5, suggesting that this gene may be a susceptibility gene for gallstones [Citation41]. These ABC family transporters may affect the formation of gallstones by participating in the efflux of bile components such as cholesterol and bile acids. In the SLC transporter protein family, the encoded product of SLC51B is mainly involved in the construction of functional bile salt transporter proteins [Citation42]. Lee et al. found that a combination of arazyme and extracts of soy leaves inhibited the expression of various bile acid transporters, including SLC51B, in the liver tissue of C57BL/6J mice fed a high-fat diet, thereby inhibiting liver lipid uptake and reducing hepatic steatosis [Citation43]. SLC51B was hypermethylated and highly expressed in the liver tissues of mice with gallstones in this study. Its action may be similar to the process described above, in that the high expression of SLC51B aggravates hepatic steatosis by promoting hepatic uptake of lipids, which then affects cholesterol metabolism to a certain extent. The specific mechanism of action needs to be proved by further studies. Another SLC, SLC22A7 (also known as OAT2), is predominantly distributed in the liver and kidney and participates in the transport of organic anions such as niacin in a sodium-independent manner [Citation44]. There is evidence that most types of bile acids are transport substrates for OAT2, which in turn represses the expression of the nuclear transcription factor HNF-4α and subsequently mediates the downregulation of SLC22A7 gene expression. This mechanism may contribute to the maintenance of bile acid homeostasis in vivo [Citation45]. Liu et al. found that the expression of both MRP2 (the coding product of ABCC2) and OAT2 was reduced in proteomic analysis of liver tissues from rats fed a high-cholesterol diet and, more interestingly, that the low expression of both MRP2 and OAT2 was regulated by the nuclear transcriptional receptor liver X receptor α (LXRα), which is closely related to cholesterol metabolism [Citation46,Citation47]. Therefore, we conjecture that a high-fat diet may cause a decrease in the expression of OAT2 and MRP2 through downregulation of LXRα, which may affect cholesterol metabolism and bile secretion through synergistic effects and ultimately lead to disruption of ternary homeostasis, causing cholesterol crystallization and increasing the likelihood of stone formation. It is very likely that other members of the SLC and ABC families may also affect gallstone formation through this mechanism. The methylation alteration of the related genes may be a key part of this, and deserves further exploration.
In addition to the classical pathways closely related to the formation of gallstones, such as cholesterol metabolism and bile secretion, the methylation status of genes in other pathways related to gallstone formation was also found to have changed (e.g., calcium signaling pathway, cAMP signaling pathway, Rap1 signaling pathway, insulin resistance, cell adhesion molecules, intestinal immune network for IgA production). Calcium precipitation in bile is often considered a necessary condition for pigment gallstones, and the presence of calcium salts is found at the center and edge of cholesterol stones, with differences in calcium concentration in different circles [Citation48]. Using atomic force microscopy, Frincu et al. observed that cholesterol in simulated bile in vitro can form crystals with a special structure on the surface of calcite (the main component of which is calcium carbonate) and grow in a certain pattern [Citation49]. The solubility and concentration of calcium ions in bile are crucial for the formation and growth of cholesterol stones. Meanwhile, calcium, as a second messenger, can synergistically regulate bile secretion, bile flow rate and bile composition with cAMP [Citation50]. Conversely, the chemical structure of bile acids in bile can affect the binding ability and solubility of calcium in bile [Citation51]. The methylation status of the calcium signaling pathway was significantly altered in this study, and this alteration may affect the nucleation and growth of cholesterol crystals by influencing calcium distribution in bile and bile secretion.
The functions of cAMP as a classical second messenger are extensive and complex. Previous studies have shown that in the liver, cAMP may be involved in the entire process of cholesterol-to-cholic-acid conversion. This includes the fact that cAMP regulates the expression of CYP7A1 through phosphorylation of HNF4α by PKA, thus affecting the conversion of cholesterol to 7α-hydroxycholesterol; and the key enzyme CYP8B1, which catalyzes the conversion of 7α-hydroxycholesterol into cholic acid, is also affected by the cAMP-regulated expression of RORα [Citation52,Citation53]. These findings suggest that the cAMP signaling pathway can have an impact on the whole cholesterol efflux process. Alterations in its methylation status are highly likely to affect the above process, thereby participating in the formation of gallstones. Hepatic insulin resistance reduces the expression of bile acid synthases, particularly CYP7B1, and produces partial resistance to the farnesoid X receptor receptor, leading to impaired bile acid salt synthesis [Citation54]. Yeung et al. found that RAP1 inhibition in mice leads to hepatic and adipose dysfunction, resulting in glucose intolerance, insulin resistance, hepatic steatosis and excess fat accumulation [Citation55]. The pathway may affect bile acid metabolism by direct or indirect means.
Cell adhesion molecules such as the claudin family are involved in the formation of tight junction structures next to the bile canaliculi between hepatocyte membranes, forming ion channels between the perisinusoidal space and the bile canaliculi. They play a role in regulating the water and electrolyte content of bile and are important for the regulation of bile flow. Matsumoto et al. found that the bile flow in claudin-2 knockout mice was significantly slowed down, while the formation rate of cholesterol stones in the gallbladder was significantly increased [Citation56]. This finding suggests that certain cell adhesion molecules (e.g., claudin-2) that constitute the paracellular barrier can alter bile volume and flow rate by means of paracellular osmosis and influence gallstone formation. IgA is another protein that can promote cholesterol crystallization and has been found to exist as a nucleation factor for cholesterol crystals in gallstones. It can organize cholesterol crystals and calcium salts on an organic matrix network [Citation57]. Lammert et al. found that IgA can be an important mediator of crystal aggregation and cholesterol gallstone growth by altering the ongoing evolution of the crystal structure in vivo [Citation58].
The methylation levels of many pathways involved in the formation of gallstones were found to have changed. In particular, the methylation status of some classical pathways and genes (such as cholesterol metabolism and bile secretion) changed, accompanied by changes in gene expression levels. These changes in the methylation status of numerous related pathways, including cholesterol metabolism and bile secretion, require our high attention. DNA methylation may play an extremely important role in the formation of gallstones and may even determine the final formation of stones.
In conclusion, in this study, we found that although the average level of DNA methylation in the liver genome of the stone group mice was not significantly altered, the methylation of numerous pathways and genes involved in gallstone formation was altered. Methylation alterations of DNA are present in all aspects of gallstone formation including lipid transport, cholesterol metabolism, bile secretion and nucleation of gallstones. It is highly likely that these alterations contribute to the entire process of gallstone formation. The present study provides a new perspective to study the formation mechanism of gallstones at the methylation level, and also provides some reference values for treatment and prevention.
This study also exhibits certain limitations. First, the information obtained from methylation analysis using RRBS technology in the experiment is not as complete as that provided by whole-genome bisulfite sequencing. Moreover, liver samples are more difficult to obtain because most patients with gallstones do not require combined liver resection or biopsy. Therefore, the experimental subjects chosen for this study were mouse liver tissues rather than human liver tissues. The samples for RRBS and RNA-seq were the entire liver tissues, including different cell types. Therefore, the sequencing results may be affected by the presence of different cell types. In addition, the utilization of a small sample size for sequencing analysis may show certain selectivity bias. Finally, this experiment only preliminarily explored the possible role of DNA methylation in liver tissue in gallstones. Key methylation modifications of genes that may be associated with gallstone formation were screened, but the specific mechanism of action remains to be explored by further experimental studies.
Conclusion
We have confirmed for the first time through animal research that epigenetic modifications may affect the formation of gallstones by regulating the expression of some key genes on key pathways.
Author contributions
B Cao, J Yao, J Peng: concept and design of this study. J Peng, H Li, J Hu: conducted experiments and analyzed data. J Peng, J Liu, R Wang, H Xu, X Li: collected samples. M Li, X Zhong, G Chen, D Liu: interpreted data. J Peng, J Hu: drafted the manuscript. B Cao, J Yao, F Tong, J Hu: reviewed data and proofread manuscripts. All authors participated in the revision of the manuscript and ultimately approved it.
Financial disclosure
This work was supported by the Natural Science Foundation of Anhui Province (1808085MH237), the Science Project of Education Department in Anhui Province (KJ2020A0854, KJ2021A1258, 2020jyxm0952) and the Scientific Project of Health Department in Anhui Province (2018SEYL004, AHWJ2021a010). The authors have no other relevant affiliations or financial involvement with any organization or entity with a financial interest in or financial conflict with the subject matter or materials discussed in the manuscript apart from those disclosed. This includes employment, consultancies, honoraria, stock ownership or options, expert testimony, grants or patents received or pending, or royalties.
Writing disclosure
No writing assistance was utilized in the production of this manuscript.
Ethical conduct of research
All animal experiments were approved by Biomedical Research Ethics Committee of Anhui University of Science and Technology.
Data sharing statement
The original sequencing data of this study is available in the Sequence Read Archive (SRA) (http://www.ncbi.nlm.nih.gov/sra). The accession number is from SRR27755701 to SRR27755716.
Supplementary Figure S1 and Tables S1-S15
Download Zip (12.8 MB)Acknowledgments
The authors would like to express sincere gratitude to the staff of the Animal Experiment Center of Anhui University of Science and Technology for their assistance during the experiment.
Competing interests disclosure
The authors have no competing interests or relevant affiliations with any organization or entity with the subject matter or materials discussed in the manuscript. This includes employment, consultancies, honoraria, stock ownership or options, expert testimony, grants or patents received or pending, or royalties.
Additional information
Funding
References
- Everhart JE, Ruhl CE. Burden of digestive diseases in the United States part III: liver, biliary tract, and pancreas. Gastroenterology 136(4), 1134–1144 (2009).
- Lammert F, Gurusamy K, Ko CW et al. Gallstones. Nat. Rev. Dis. Primers 2, 16024 (2016).
- Schafmayer C, Hartleb J, Tepel J et al. Predictors of gallstone composition in 1025 symptomatic gallstones from Northern Germany. BMC Gastroenterol. 6, 36 (2006).
- Groen AK, Bloks VW, Verkade H, Kuipers F. Cross-talk between liver and intestine in control of cholesterol and energy homeostasis. Mol. Aspects Med. 37, 77–88 (2014).
- Biswas S, Rao CM. Epigenetic tools (the writers, the readers and the erasers) and their implications in cancer therapy. Eur. J. Pharmacol. 837, 8–24 (2018).
- Zhu H, Wu LF, Mo XB et al. Rheumatoid arthritis-associated DNA methylation sites in peripheral blood mononuclear cells. Ann. Rheum. Dis. 78(1), 36–42 (2019).
- Imgenberg-Kreuz J, Carlsson Almlöf J, Leonard D et al. DNA methylation mapping identifies gene regulatory effects in patients with systemic lupus erythematosus. Ann. Rheum. Dis. 77(5), 736–743 (2018).
- Płatek T, Polus A, Góralska J et al. DNA methylation microarrays identify epigenetically regulated lipid related genes in obese patients with hypercholesterolemia. Mol. Med. 26(1), 93 (2020).
- Nikolac Perkovic M, Videtic Paska A, Konjevod M et al. Epigenetics of Alzheimer’s disease. Biomolecules 11(2), 195 (2021).
- Hernandez-Meza G, von Felden J, Gonzalez-Kozlova EE et al. DNA methylation profiling of human hepatocarcinogenesis. Hepatology 74(1), 183–199 (2021).
- Brägelmann J, Barahona Ponce C, Marcelain K et al. Epigenome-wide analysis of methylation changes in the sequence of gallstone disease, dysplasia, and gallbladder cancer. Hepatology 73(6), 2293–2310 (2021).
- Baghel K, Kazmi HR, Chandra A, Raj S, Srivastava RN. Significance of methylation status of MASPIN gene and its protein expression in prognosis of gallbladder cancer. Asia Pac. J. Clin. Oncol. 15(5), e120–e125 (2019).
- Tekcham DS, Gupta S, Shrivastav BR, Tiwari PK. Epigenetic downregulation of PTEN in gallbladder cancer. J. Gastrointest. Cancer 48(1), 110–116 (2017).
- Bharti A, Kar AG, Singh D et al. Frequent promoter hypermethylation and down regulation of BNIP3: an early event during gallbladder cancer progression. Dig. Liver Dis. 54(9), 1257–1263 (2022).
- Martin M. Cutadapt removes adapter sequences from high-throughput sequencing reads. EMBnet J. 17(1), 10–12 (2011).
- Kim D, Langmead B, Salzberg SL. HISAT: a fast spliced aligner with low memory requirements. Nat. Methods 12(4), 357–360 (2015).
- Pertea M, Pertea GM, Antonescu CM et al. StringTie enables improved reconstruction of a transcriptome from RNA-seq reads. Nat Biotechnol. 33(3), 290–295 (2015).
- Love MI, Huber W, Anders S. Moderated estimation of fold change and dispersion for RNA-seq data with DESeq2. Genome Biol. 15(12), 550 (2014).
- Yu G, Wang L, Han Y et al. clusterProfiler: an R package for comparing biological themes among gene clusters. OMICS 16(5), 284–287 (2012).
- Hu X, Yuan J, Shi Y et al. pIRS: Profile-based Illumina pair-end reads simulator. Bioinformatics 28(11), 1533–1535 (2012).
- Xi Y, Li W. BSMAP: whole genome bisulfite sequence MAPping program. BMC Bioinformatics 10, 232 (2009).
- Jühling F, Kretzmer H, Bernhart SH et al. Metilene: fast and sensitive calling of differentially methylated regions from bisulfite sequencing data. Genome Res. 26(2), 256–262 (2016).
- Zhang D, Hu Q, Liu X et al. AllEnricher: a comprehensive gene set function enrichment tool for both model and non-model species. BMC Bioinformatics 21(1), 106 (2020).
- Lister R, Pelizzola M, Dowen RH et al. Human DNA methylomes at base resolution show widespread epigenomic differences. Nature 462(7271), 315–322 (2009).
- Wang D, Afdhal Q, H N. Gallstone Disease. In: Sleisenger and Fordtran's Gastrointestinal and Liver Disease (10th Edition). Mark Feldman ( Ed.). Saunders Elsevier Publishers, PA, US, 1100–1133 (2014).
- Fu S, Deger T, Boers RG et al. Hypermethylation of DNA methylation markers in non-cirrhotic hepatocellular carcinoma. Cancers (Basel) 15(19), 4784 (2023).
- Acha B, Corroza J, Sánchez-Ruiz de Gordoa J et al. Association of blood-based DNA methylation markers with late-onset Alzheimer disease: a potential diagnostic approach. Neurology 101(23), e2434–e2447 (2023).
- Henningsson AJ, Hellberg S, Lerm M et al. Genome-wide DNA methylation profiling in Lyme neuroborreliosis reveals altered methylation patterns of HLA genes. J. Infect. Dis. jiad451 (2023).
- Rudling M, Laskar A, Straniero S. Gallbladder bile supersaturated with cholesterol in gallstone patients preferentially develops from shortage of bile acids. J. Lipid Res. 60(3), 498–505 (2019).
- Van Erpecum KJ. Pathogenesis of cholesterol and pigment gallstones: an update. Clin. Res. Hepatol. Gastroenterol. 35(4), 281–287 (2011).
- Wolska A, Dunbar RL, Freeman LA et al. Apolipoprotein C-II: new findings related to genetics, biochemistry, and role in triglyceride metabolism. Atherosclerosis 267, 49–60 (2017).
- Fu X, Gong K, Shao X. The relationship between serum lipids, apolipoproteins level and bile lipids level, chemical type of stone. Zhonghua Yi Xue Za Zhi 75(11), 656–659; 708 (1995).
- Hubacek JA, Bobkova D. Role of cholesterol 7alpha-hydroxylase (CYP7A1) in nutrigenetics and pharmacogenetics of cholesterol lowering. Mol. Diagn. Ther. 10(2), 93–100 (2006).
- Chiang JY. Bile acids: regulation of synthesis. J. Lipid Res. 50(10), 1955–1966 (2009).
- Li T, Matozel M, Boehme S et al. Overexpression of cholesterol 7α-hydroxylase promotes hepatic bile acid synthesis and secretion and maintains cholesterol homeostasis. Hepatology 53(3), 996–1006 (2011).
- Heuman DM, Hylemon PB, Vlahcevic ZR. Regulation of bile acid synthesis. III. correlation between biliary bile salt hydrophobicity index and the activities of enzymes regulating cholesterol and bile acid synthesis in the rat. J. Lipid Res. 30(8), 1161–1171 (1989).
- Fang S, Miao J, Xiang L et al. Coordinated recruitment of histone methyltransferase G9a and other chromatin-modifying enzymes in SHP-mediated regulation of hepatic bile acid metabolism. Mol. Cell. Biol. 27(4), 1407–1424 (2007).
- Nigam SK. What do drug transporters really do? Nat. Rev. Drug Discov. 14(1), 29–44 (2015).
- Rius M, Nies AT, Hummel-Eisenbeiss J, Jedlitschky G, Keppler D. Cotransport of reduced glutathione with bile salts by MRP4 (ABCC4) localized to the basolateral hepatocyte membrane. Hepatology 38(2), 374–384 (2003).
- Berge KE, Tian H, Graf GA et al. Accumulation of dietary cholesterol in sitosterolemia caused by mutations in adjacent ABC transporters. Science 290(5497), 1771–1775 (2000).
- Yu L, Li-Hawkins J, Hammer RE et al. Overexpression of ABCG5 and ABCG8 promotes biliary cholesterol secretion and reduces fractional absorption of dietary cholesterol. J. Clin. Invest. 110(5), 671–680 (2002).
- Wang W, Seward DJ, Li L, Boyer JL, Ballatori N. Expression cloning of two genes that together mediate organic solute and steroid transport in the liver of a marine vertebrate. Proc. Natl Acad. Sci. USA 98(16), 9431–9436 (2001).
- Lee H, Cho S, Kang A et al. Combination treatment of arazyme and soy leaf extract attenuates hyperglycemia and hepatic steatosis in high-fat diet-fed C57BL/6J mice. Life 11(7), 645 (2021).
- Burckhardt G, Burckhardt BC. In vitro and in vivo evidence of the importance of organic anion transporters (OATs) in drug therapy. In: Handbook of Experimental Pharmacology. Martin F. Fromm ( Ed.). Springer, Berlin, Heidelberg, 201, 29–104 (2011).
- Wang Y, Hu H, Nie J et al. Inhibiting uptake activity of organic anion transporter 2 by bile acids. Drug Metab. Pharmacokinet. 43, 100448 (2022).
- Liu Y, Pu QH, Wu MJ, Yu C. Proteomic analysis for the impact of hypercholesterolemia on expressions of hepatic drug transporters and metabolizing enzymes. Xenobiotica 46(10), 940–947 (2016).
- Chen G, Wu S. Role of baicalin and liver X receptor alpha in the formation of cholesterol gallstones in mice. Gastroenterol. Res. Pract. 2020, 1343969 (2020).
- Gazali Z, Gupta V, Kumar T et al. Effect of mineral elements on the formation of gallbladder stones using spectroscopic techniques. Anal. Bioanal. Chem. 415(25), 6279–6289 (2023).
- Frincu MC, Fleming SD, Rohl AL, Swift JA. The epitaxial growth of cholesterol crystals from bile solutions on calcite substrates. J. Am. Chem. Soc. 126(25), 7915–7924 (2004).
- Bygrave FL, Karjalainen A, Hamada Y. Crosstalk between calcium- and cyclic AMP-mediated signalling systems and the short-term modulation of bile flow in normal and cholestatic rat liver. Cell. Signal. 6(1), 1–9 (1994).
- Tamasawa N, Yoneda M, Makino I et al. The effect of biliary bile acid concentration and composition on the calcium level in human gallbladder bile. Tohoku J. Exp. Med. 171(4), 297–307 (1993).
- Song KH, Chiang JY. Glucagon and cAMP inhibit cholesterol 7alpha-hydroxylase (CYP7A1) gene expression in human hepatocytes: discordant regulation of bile acid synthesis and gluconeogenesis. Hepatology 43(1), 117–125 (2006).
- Pathak P, Li T, Chiang JY. Retinoic acid-related orphan receptor α regulates diurnal rhythm and fasting induction of sterol 12α-hydroxylase in bile acid synthesis. J. Biol. Chem. 288(52), 37154–37165 (2013).
- Biddinger SB, Haas JT, Yu BB et al. Hepatic insulin resistance directly promotes formation of cholesterol gallstones. Nat. Med. 14(7), 778–782 (2008).
- Yeung F, Ramírez CM, Mateos-Gomez PA et al. Nontelomeric role for Rap1 in regulating metabolism and protecting against obesity. Cell Rep. 3(6), 1847–1856 (2013).
- Matsumoto K, Imasato M, Yamazaki Y et al. Claudin 2 deficiency reduces bile flow and increases susceptibility to cholesterol gallstone disease in mice. Gastroenterology 147(5), 1134–45.e10 (2014).
- de la Porte PL, Lafont H, Domingo N et al. Composition and immunofluorescence studies of biliary ‘sludge’ in patients with cholesterol or mixed gallstones. J. Hepatol. 33(3), 352–360 (2000).
- Lammert F, Südfeld S, Busch N, Matern S. Cholesterol crystal binding of biliary immunoglobulin A: visualization by fluorescence light microscopy. World J Gastroenterol. 7(2), 198–202 (2001).