
Abstract
Background: Aberrations in DNA methylation patterns are well-described in human malignancies. However, the existence of the ‘CpG island methylator phenotype’ (CIMP) in human breast cancer is still controversial. Materials & methods: Illumina’s HumanMethylation 450K BeadChip was used to analyze genome-wide DNA methylation patterns. Chromosomal abnormalities were determined by array-based CGH. Results: Invasive lobular breast carcinomas exhibit the highest number of differentially methylated CpG sites and a strong inverse correlation of aberrant DNA hypermethylation and copy number alterations. Nine differentially methylated regions within seven genes discriminating the investigated subgroups were identified and validated in an independent validation cohort and correlated to a better relapse-free survival. Conclusion: These results depict a clear difference between genetically and epigenetically unstable breast carcinomas indicating different ways of tumor progression and/or initiation, which strongly supports the association of CIMP with the lobular subtype and provide new options for detection and therapy.
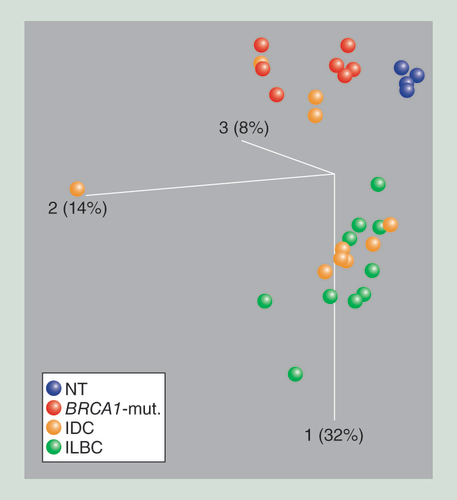
The first principle component is depicted in the vertical axis. Each ball represents 8550 variable CpG sites of one primary tissue specimen (blue: [NT; red: specimens from patients with BRCA1-mut.; orange: IDC samples; and green: ILBCs. NT and BRCA1-mut. samples separate from ILBC samples along the first principle component. IDC do not form an independent group; however, either cluster with ILBC or BRCA1-mutated samples.
BRCA1-mut.: BRCA1-germline mutation; IDC: Invasive ductal breast cancer; ILBC: Invasive lobular breast cancer; NT: Normal breast tissue.
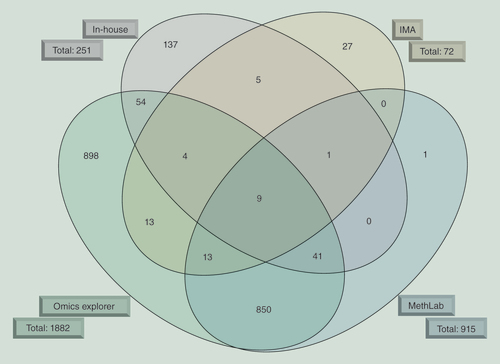
The overlap of differentially methylated genes identified by four different approaches used to analyze the high-throughput data of the HM450K BeadChip is shown. The algorithms are depicted outside the ellipse together with the total number of genes harboring differentially methylated CpG sites.
IMA: Illumina Methylation Analyzer.
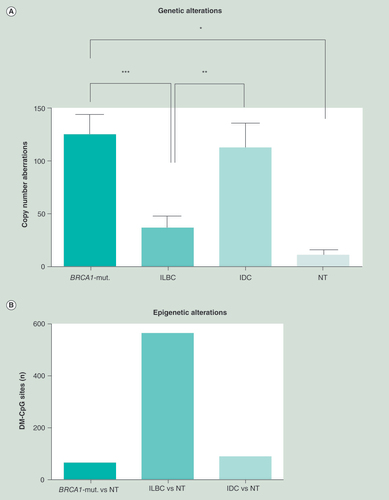
(A) Copy number aberrations for each subgroup were plotted. BRCA1-mutated samples showed the most alterations, with 3.5-fold more than exhibited for ILBC. (B) The number of highly relevant differentially methylated CpG sites (Δbeta-value≥0.4), analyzed by the limma R-package, was determined by the mean of each subgroup compared against the mean of NT for each single CpG site. ILBC show almost 8.4-times more DMR (561 DMR) than BRCA1-mutated (67 DMR). IDC showed 86 DMR compared with NT.
*p < 0.05; **p < 0.01; ***p < 0.001.
BRCA1-mut.: BRCA1-germline mutation; IDC: Invasive ductal breast cancer; ILBC: Invasive lobular breast cancer; NT: Normal breast tissue.
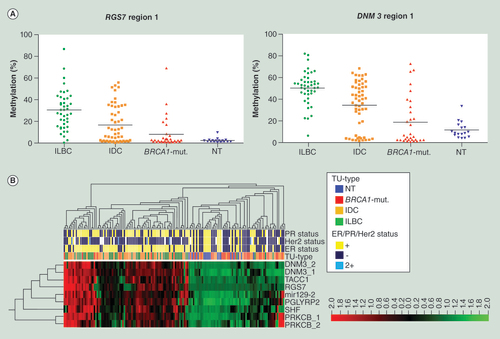
(A) Plotted is percentage methylation (y-axis) within the four subgroups (x-axis). Each dot represents the mean of the sequenced region within one sample, with the black line denoting the mean of each subgroup. (B) Unsupervised hierarchical clustering and heat map analysis was performed on bisulfite pyrosequencing data of 117 primary tissue specimens within nine candidate regions (DNM3 region 1, DNM3 region 2, mir129-2, PGLYRP2, PRKCB region 1, PRKCB region 2, RGS7, SHF, TACC1), for MapInfo see supplementary table s3. ER, PR, Her2 status, and tumor type are color coded according to the legend on the right side. Most BRCA1-mut. samples showed a similar DNA methylation pattern as NT, whereas most ILBC form their own cluster. IDC are more-or-less spread within the ILBC but also the BRCA1-mut./NT cluster. Red = high; black = intermediate; green = low DNA methylation values.
BRCA1-mut.: BRCA1-germline mutation; IDC: Invasive ductal breast cancer; ILBC: Invasive lobular breast cancer; NT: Normal breast tissue.
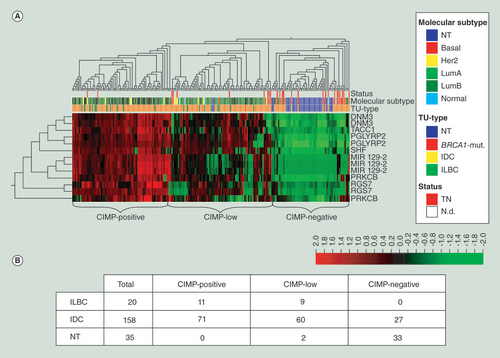
(A) Unsupervised hierarchical clustering and heat map illustration of the candidate DMR within the HM450K BeadChip dataset of the Cancer Genome Atlas. Normal breast tissue (blue) clusters together with the majority of basal-like (middle, red) classified and triple-negative tumors (upper, red). Lobular carcinomas (lower, green) belong to the subgroup of highly methylated tumors on the left side (CIMP-positive). Red = high methylation; green = low or no methylation. (B) The number of ILBC, IDC, and NT comprised within each subgroup identified by the clustering approach.
BRCA1-mut.: BRCA1-germline mutation; IDC: Invasive ductal breast cancer; ILBC: Invasive lobular breast cancer; NT: Normal breast tissue.
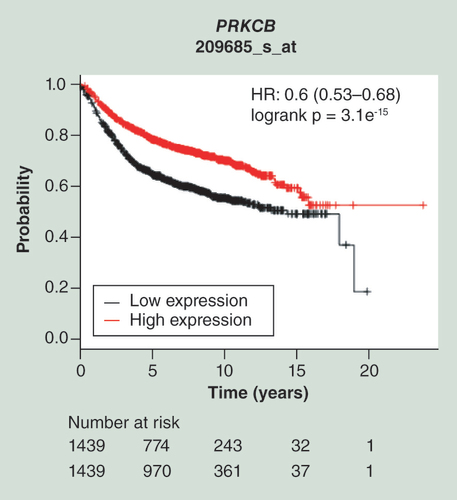
Kaplan–Meier plots of survival data for 2878 patient samples provided by the database of the Kaplan–Meier Plotter is shown for the probe represented by the Affymetrix ID 209685_s_at. Cited is the hazard ratio with the 95% CI and the logrank p-value. The red line represents patient samples overexpressing PRKCB, whereas the black line represents patient data exhibiting lower gene expression values (high expression: above the median; low expression: below the median). Thus, upregulation of PRKCB is associated with a beneficial relapse-free survival.
HR: Hazard ratio.
Background
With 464,000 new cases (13.5% of all cancer cases) per year, breast cancer is the most common cancer in Europe and the leading cause of death in women, with around 131,000 deaths each year [Citation1]. It is a highly heterogeneous disease in respect to histopathological features, clinical course, molecular profiles, and response to therapy [Citation2]. The classical approach to categorize this type of cancer is based on histopathology [Citation3,Citation4]. The most prominent groups classified this way are invasive ductal (IDC) and invasive lobular breast carcinomas (ILBCs). Although most breast carcinomas are sporadic, 5–10% of all breast cancers are inherited [Citation5–7].
Aberrant DNA methylation is an epigenetic modification promising great potential as a new biomarker for the early detection, prediction, and prognosis of cancer [Citation8]. Initial research on DNA methylation changes was based on candidate gene approaches. However, new high-throughput technologies offer the possibility to investigate up to several thousand CpG sites in parallel, approaching a genome-wide perspective. Using the HumanMethylation 27K BeadChip (HM27K BeadChip) from Illumina Inc. (CA, USA), interrogating 27,600 single CpG sites, high levels of DNA methylation were shown to be associated with estrogen receptor (ER)-positive breast tumors [Citation9–11]. Moreover, an association of basal-like tumors with low levels and luminal tumors with high levels of DNA methylation was postulated [Citation12–14].
Concordant hypermethylation of various genomic regions and its association with clinical course was first identified by Toyota et al. in a series of colorectal cancer specimens and named ‘CpG island methylator phenotype’ (CIMP) [Citation15,Citation16]. Similar concordant hypermethylation patterns were subsequently described in various human malignancies [Citation17]. However, although numerous publications about DNA methylation in breast cancer exist, only two recent studies claimed the existence of CIMP in breast cancer [Citation10,Citation18]. One of these associated CIMP with poor prognosis [Citation18], the other one with better patient survival [Citation10]. Within glioma [Citation19,Citation20], leukemia [Citation21], enchondroma and spindle cell hemangioma [Citation22], CIMP was associated with somatic mutations in IDH1 or IDH2. Loss-of-function mutations in TET2, a methylcytosine dioxygenase, showed similar aberrant epigenetic characteristics, as do mutations in IDH1/2 [Citation21]. Thus, we are just at the start of understanding the molecular mechanisms underlying CIMP and its association with genetic changes.
Addressing the still unresolved question of the existence of CIMP in breast cancer, DNA methylation alterations among various breast cancer subtypes were examined by applying the HM450K BeadChip of Illumina Inc., covering about 480,000 single CpG sites, where each gene is represented by 17.2 probes on average [Citation23]. In addition to the occurrence of the CpG island methylator phenotype in breast cancer, its relation to genetic instability and histological subtypes was investigated, aiming to better understand the role of DNA methylation in breast cancer.
Material & methods
Patient cohort & sample preparation
Primary tissue specimens were retrieved anonymously from the archive of the Institute of Pathology, according to the guidelines of the local ethics committee (‘Ethik-Kommission der Medizinischen Hochschule Hannover’, head: Professor Dr Tröger). All samples (supplementary table s1) of the study cohort (n = 32) and validation cohort (n = 117) were reviewed and classified by an experienced pathologist (H Kreipe), ascertaining a tumor cell content of at least 70%. The clinical records and the histopathology did not provide any hint that the non-BRCA1-associated cases might contain an undetected germ-line mutation in the BRCA1 gene. However, for legal reasons it was not possible to verify the BRCA1 wild-type sequence by germ-line analysis in these cases.
The cell line MDA-MB-134 was purchased from ATCC (VA, USA), HCC1937 from DSMZ (Braunschweig, Germany), IPH-926 was established at the Institute of Pathology (Hanover Medical School) [Citation24], and PMC42 was kindly provided by Robert H Whitehead [Citation25,Citation26].
DNA isolation was performed via phenol-chloroform extraction subsequent to tissue digestion by Proteinase K (Merck, Darmstadt, Germany). Prior to BeadChip hybridization and bisulfite pyrosequencing, DNA was sodium bisulfite treated using the EZ DNA Methylation™ Kit (Zymo Research, CA, USA) following the manufacturer’s instructions.
BeadArray-based DNA methylation analysis
The HumanMethylation 450K BeadChip (Illumina Inc.) analysis was performed according to manufacturer’s instructions. Beta-values were determined by applying default settings of the Genome Studio Software’s DNA methylation module (as described in [Citation27]). To identify DMR among the subgroups four analytical approaches were applied. The first approach made use of the R-package MethLab [Citation28], utilizing default settings. The second data analysis is based on the F-test of the OMICS Explorer (Qlucore, Lund, Sweden) identifying DMR between the subgroups under investigation applying a FDR <1.2e-4. A subsequent unsupervised PCA of the complete dataset using the OMICS Explorer separated the samples into two groups. Thus, in the third approach (in-house), DMR among these two groups were analyzed using the limma R-package, with p-values adjusted according to Benjamini-Hochberg. Missing values were imputed in two ways, either by the median of those available values relating to the same group or by the median of all available values. By imputing missing data in two different ways the sensitivity of the results on different analytical ways was assessed, which can provide further insights into the data structure. Only CpG sites significant for both imputation variants were considered as relevant. For the fourth approach, being similar to the in-house one, the R-package IMA (version 3.1.1; site filter: 75% of samples with p-value ≤ 0.05, sample filter: 75% of sites with p-value ≤ 1e-5) was applied [Citation29]. DMR exhibiting a Δbeta-value of at least 0.4 and a p-value ≤ 1e-4 were identified by the site level analysis using the integrated limma R-package applying the Benjamini-Hochberg method for multiple testing corrections [Citation30].
COBRA & bisulfite pyrosequencing
COBRA was performed for 23 DMR (supplementary table s2) using the restriction enzymes Bsh1236 I, Tai I and Taq I, as described previously [Citation31].
Bisulfite pyrosequencing analysis was performed as previously described [Citation27]. Genomic regions, primer sequences, and PCR conditions are listed within supplementary table s2.
MBD-capture reaction & DNA methylation microarray analysis
Methylated DNA fragments were enriched and separated from unmethylated DNA using the MethylCollector™ Ultra Kit of Active Motif (CA, USA) according to the manufacturer’s instructions. Successful enrichment was controlled by qPCR on genomic regions being highly methylated (Mint31/SOCS1 for cell lines, MafB/KLF11 for primary samples) or completely unmethylated (MLH1/APC) within each individual sample.
DNA fragments were labelled and subsequently hybridized onto Agilent’s Human DNA Methylation microarray (Agilent Technologies, CA, USA). The data were analyzed by Agilent’s Genomic Workbench Lite-Methylation (CH3) application (version 6.5).
Array-based comparative genomic hybridization
Array-CGH was performed using the Sure Print G3 Custom CGH Microarray, 4x180K (Agilent Technologies, CA, USA). Labeling of genomic DNA and hybridization was performed according to the manufacturer’s protocol without enzymatic restriction. Microarray slides were scanned using a microarray scanner (Agilent Technologies). Data were processed by Feature Extraction Software (Agilent Technologies), applying default CGH settings, and subsequently analyzed by Agilent’s CGH data analysis software, Genomic-Workbench (reference sequence GRCh37/hg19). Breakpoint calling was performed using Aberration Algorithm ADM2 set to 5.0 and Aberration Filters set to at least 20 probes with a mean log2-ratio = 0.1 with Nesting Filter Off for a standardized overview (or with different filter settings depending on the signal/noise ratio given as Derivative Log Ratio Spread for individual arrays, e.g., at least five probes with mean log2-ratio = 0.3 to achieve higher stringency or, e.g., at least 100 probes with mean log2-ratio = 0.1 to achieve lower stringency). CNA were counted as discrete regions of loss or gain.
Quantitative real-time PCR
Gene expression analysis was performed using TaqMan® expression assays for all candidate genes. The mix of 10 μl TaqMan® Universal Master Mix, 1 μl TaqMan® gene expression assay, and 9 μl of cDNA was analyzed by the ABI 7500 Fast Real-Time system using the ‘standard’ program. Candidate genes were normalized over GUSB and TBP, and mir129–2 over RNU48 and snoRNA U6. Data analysis was performed using the REST2009 software, version 2.0.13.
Survival analysis
Employing the Kaplan–Meier Plotter (version 2012 [Citation32]) for breast cancer [Citation33] Kaplan–Meier plots, log rank tests, and cox regression analysis was performed for four candidate genes on the basis of gene expression and survival information. All sample characteristics can be found in [Citation33] or at the cited web page.
Statistical analysis for the identification of subgroups
Investigating differences in bisulfite pyrosequencing DNA methylation data and aCGH data the Kruskal–Wallis test and unpaired two-tailed t-test was performed, respectively, using GraphPad Prism 5. Spearman correlation was applied for technical replicates (GraphPad Prism 5). Analyzing the driving force of the separation of the dataset into two branches along the maximal differences the ‘Decision tree’ algorithm of JMP®Pro was performed, computing a LogWorth value as described [Citation34].
Results
Genome-wide methylation analysis of histological breast cancer subtypes
Investigating genome-wide DNA methylation differences between breast cancer subtypes, the HM450K BeadChip was used for the analysis of four breast cancer cell lines and a study cohort comprising 28 fresh–frozen breast cancer specimens (ten ILBC, ten sporadic IDC, eight IDC of BRCA1-germline mutation carriers) and four normal breast tissues (NT). Technical replicates of primary tissues showed very high concordance (Spearman r = 0.994, p < 0.0001; data not shown). To date, no standardized workflow exists for the analysis of such datasets and to avoid overinterpretation of the results obtained by a single data processing and evaluation pipeline, we used four different algorithms and concentrated on those regions and genes identified by all four algorithms and validated our findings with an independent quantitative method in an independent cohort. A principal component analysis (PCA) of all samples exhibited the most prominent difference in DNA methylation between cell lines and primary specimens(supplementary figure s1). Unsupervised hierarchical clustering along with heat map analysis indicated a more similar DNA methylation pattern among IPH-926 and MDA-MB-134, whereas PMC42 showed the largest deviation from the other cell lines (data not shown). Although the four cell lines were established from very different primary tumors their DNA methylation pattern showed much more similarities among themselves compared with the primary tissue. Therefore, the cell line data were excluded from further analysis. Focusing only on primary tissue samples, normal breast tissues built the most homogenous group, clustering tightly together ( & supplementary figure s2). However, BRCA1-mutated samples exhibited more DNA methylation similarities with NT than with any other subgroup ( & supplementary figure s2). Applying a stringent definition for differential methylation (ΔbetaTumor-NT ≥0.4), ILBC displayed by far the highest number of differentially methylated CpG sites (n = 561), whereas BRCA1-mutated specimens harbored only 65 differentially methylated CpG sites. IDC samples constituted the most heterogeneous group, either clustering with ILBC or with BRCA1-mutated tumors.
For the identification of DMR among the subgroups, we concentrated on whole regions (i.e., stretches of CpG sites with very similar methylation level) and not single CpG sites. In addition, we focused on regions identified by all four algorithms in order to avoid overinterpretation of the data. That means that the lists of individual CpG sites that overlap between only two algorithms (e.g., MethLab and OMICS explorer) were not analyzed any further. Therefore, 68 genes were identified by three algorithms used, with nine of these genes being identified by all four algorithms (). This outcome was carefully reviewed by inspecting the beta-values of all individual CpG sites annotated to these candidate genes. Mean beta-values of each subgroup were visualized using the IGV browser. Thus, DMR exhibiting beta-value differences not providing biological relevant discriminatory information (e.g., 0.7 vs 0.9) could be excluded. Genes described to have a role in cancer were of major interest. A total of 16 candidate genes were therefore selected for further verification.
Correlation between epigenetic & genetic aberrations
Assessing genetic aberrations within the same primary samples (study cohort), array-based comparative genomic hybridization (aCGH) was performed. BRCA1-mutated tumors exhibited by far the highest number of CNA (mean: 125), being significantly different from NT (11 CNA compared with control DNA) and ILBC (). ILBC with on average 36 CNA had the lowest level of genetic instability of all tumor subtypes. In respect to the epigenetic data obtained by the HM450K BeadChip, a striking inverse correlation between CNA and aberrant DNA hypermethylation exists in human breast cancer ().
Validation of newly identified differentially methylated regions
DMR identified in the screening approach were independently validated using COBRA and bisulfite pyrosequencing analyzing the study cohort (n = 32) and an independent validation cohort (n = 117). Stringent quantitative thresholds were applied to clearly discriminate significant DNA methylation differences between the subgroups. Ultimately, regions within seven genes (DNM3, mir129–2, PGLYRP2, PRKCB, RGS7, SHF, TACC1; for further information see supplementary figure s3) were evaluated and subsequently validated by bisulfite pyrosequencing (). The mean methylation level for all seven genes within all samples analyzed showed significant differences among all subgroups (Kruskal-Wallis test, p-value ≤0.0001). Thereby, ILBC exhibited hypermethylation within 87.3% of the validation measurements (n = 385), whereas BRCA1-mutated showed hypermethylation in only 34.7% of the validation measurements (n = 262). ILBC clustered together with a subgroup of IDC, whereas BRCA1-mutated tumors form a distinct cluster with NT and the remaining IDC, as already seen in the HM450K BeadChip dataset ( & supplementary figure s2). Performing the ‘Decision tree’ approach on the bisulfite pyrosequencing data BRCA1-mutated and NT were separated from ILBC and IDC (LogWorth = 65.81). Further analyzing the high methylator group on the far left site of the cluster tree () revealed a strong enrichment of ILBC (54.5 vs 29.5% ILBC within the whole cohort).
Next to COBRA and bisulfite pyrosequencing, the candidate genes were also verified by another genome-wide screening based on the capture of methylated DNA fragments by methyl-CpG-binding domain (MBD) proteins and subsequent hybridization to a DNA methylation promoter microarray [Citation35]. Analyzing the DNA methylation status of the seven candidate genes, a similar clustering pattern could be observed as for the HM450K BeadChip and bisulfite pyrosequencing (supplementary figure s3).
Additionally, the TCGA dataset (datafreeze 27022012 [Citation14]) was reanalyzed for the DNA methylation status of the newly identified candidate genes DNM3, mir129-2, PGLYRP2, PRKCB, RGS7, SHF, and TACC1. ILBC were clustering with the majority of IDC, whereas the NT clustered with almost all basal-like tumors (). Focusing only on the subgroup showing the highest DNA methylation levels, 13.4% of the samples were ILBC (CIMP-positive; ). Thus, 55% of all ILBC of the whole TCGA dataset (n = 213, ILBC represents 9.4%) were represented within this high methylator group, with only 44.9% of all IDC of the whole TCGA dataset (IDC represents 74.2%). Interestingly, the group exhibiting low methylation levels (CIMP-negative; ) comprised no ILBC sample.
Gene expression analysis of candidate genes
The impact of DNA methylation on gene activity was investigated by quantitative RT-PCR analysis. Comparing ILBC and IDC to NT, downregulation of DNM3 and TACC1 was observed. Expression of RGS7 could not be detected within NT and showed only low expression in tumor samples. PGLYRP2, PRKCB, SHF, and mir129–2 did not show any difference in gene expression among ILBC/IDC and NT (data not shown).
Impact of differentially methylated genes on patient survival
Since survival data were not available for our patient cohort, the database of the Kaplan–Meier Plotter [Citation33] was utilized to obtain information on a potential clinical relevance of the identified candidate genes. Not all candidates were represented within this database, with PGLYRP2, SHF, and mir129-2 missing. All of the remaining four genes showed a significantly better relapse-free survival (RFS, p-value <2e-5) in patients highly expressing the individual genes ( & supplementary figure s4). However, the overall survival (OS) was unaffected by the expression status of any candidate supplementary figure s4.
Discussion
The term ‘CpG island methylator phenotype’ (CIMP) has been used over the past years to describe patterns of concordant hypermethylation within various tumor types. However, the molecular basis behind CIMP is barely understood [Citation17].
Early candidate gene approaches on DNA methylation postulated a distinct hypermethylation profile for subgroups of breast cancer harboring specific histopathological features [Citation36–39]. Since genome-wide DNA methylation screening approaches on breast cancer subtypes are still missing, the present study applied the genome-wide HM450K BeadChip on 32 primary histologically classified tissue specimens comprising ILBC, IDC (sporadic and familial), and normal breast. Although, the various cell lines showed different methylation patterns among themselves, the overall differences to primary breast tissues were even more prominent (supplementary figure s1). Thus, cell lines are not a suitable tool for the identification of clinically relevant DNA methylation patterns in breast cancer. Investigating primary tissue specimens, a cluster of low DNA methylation including all BRCA1-mutated tumors and NT was identified, whereas ILBC and most of the sporadic IDC samples formed a second distinct cluster of strongly increased methylation levels ( & , & supplementary figure s2). Previous studies employing less comprehensive approaches and focusing on molecular subtypes showed hypomethylation within basal-like tumors [Citation40], whereas luminal breast carcinomas exhibited increased methylation [Citation12–14]. Considering the fact that most BRCA1 mutation carriers harbor TNBCs and that many TNBCs are classified as basal-like [Citation41], our findings are in congruence with these earlier, less comprehensive studies.
Hypermethylation clusters within breast cancer were associated with ER status [Citation9–11]. Since the majority of BRCA1-mutated samples are ER-negative and ILBC are ER-positive, sporadic IDC comprising ER-positive and ER-negative were included in the analysis. ‘Decision tree’ calculations [Citation34] identified the classification according to histopathological/molecular features as the major discriminator of the methylation profile. Noteworthy, Fang et al. [Citation10] discussed that other factors in addition to ER status have to be involved in order to explain the separation according to the DNA methylation patterns.
It is well known that BRCA1-mutated tumors harbor high levels of CNA and a low de novo DNA methylation frequency, and that ILBC harbor low levels of CNA [Citation42–48]. This study confirmed these previous findings and identified a strong inverse relationship between epigenetic and genetic aberrations (). Interestingly, a similar inverse relationship was identified in colorectal cancer analyzing chromosomal imbalances in CIMP-high and CIMP-low/CIMP-0 tumors [Citation49].
The TCGA network published the first study describing breast cancer DNA methylation data based on the HM450K BeadChip [Citation14]. However, since the study was initiated before the release of the HM450K BeadChip, the HM27K BeadChip was started with and used for more than 100 samples. Therefore, the final evaluation published in [Citation14] is based only on CpG sites represented on both arrays (~27,600), and thus far less comprehensive than the DNA methylation profiling described herein. During the preparation of this manuscript, Fleischer et al. [Citation50] published a study on DNA methylation in human breast cancer also employing the 450K methylation array. However, these authors concentrate on a completely different question (i.e., the occurrence of aberrant DNA methylation during the process of malignant transformation by comparing normal breast epithelium, intraductal carcinomas, and invasive ductal carcinomas), thereby nicely complementing our study.
A potential limitation of the present study is the limited number of fresh–frozen specimens analyzed in the study cohort (n = 32). However, availability for a research project of large fresh–frozen breast cancer samples from BRCA1-mutation carriers was (and is) a severe bottle neck. In addition, increasing the size of the other classes out of proportion might have distorted the evaluation. Therefore, we validated a small but highly significantly differentially methylated set of genes (concordantly identified by four different algorithms) in a fairly large independent cohort (n = 117) by employing an independent method. In addition, a reanalysis of TCGA data (n = 213) supports our conclusions.
Since to date no standardized statistical guideline for the evaluation of HM450K BeadChip data has been established, DMR among the histological subtypes were identified using four different approaches (). Thereby, seven candidate genes clearly discriminating ILBC from BRCA1-mutated and NTs were identified. The individual analysis of these candidates by the Kaplan–Meier Plotter database [Citation33] exhibited clinical relevance with respect to RFS; however, it lacked an association with OS ( & supplementary figure s4). Investigating the relationship between DNA methylation status and gene expression showed an inverse correlation between DNA methylation and gene expression for DNM3 and TACC1. Interestingly, DNM3 is a postulated tumor suppressor gene in hepatocellular carcinoma, since the DNA methylation-induced downregulation of the gene was associated with poor prognosis [Citation51]. Additionally, DNM3 was identified by the TCGA consortium as one of the 490 highly methylated genes in mainly luminal B breast tumors [Citation14], as well as one of the 86 key CpGs in the study of Dedeurwaerder et al. [Citation52]. TACC1 was also proposed to be a prognostic marker, however, for endocrine therapy resistance and RFS in breast cancer [Citation53], and was associated with diminished gene expression in various cancers [Citation54,Citation55]. PGLYRP2 was found to be downregulated in colorectal cancer compared with normal tissue [Citation56]. Cancer cell line studies on PRKCB associated DNA methylation at the promoter region of the gene with protein downregulation [Citation57]. Interestingly, PRKCB was even identified as one of the discriminatory genes within the studies of Hill et al. and Dedeurwaerder et al. [Citation9,Citation52], whereas none of these studies investigated this further. Downregulation of mir129–2 was correlated with an upregulation of SOX4, an oncogene, as shown for several cancers [Citation58–60], whereas DNA methylation is one mechanism for this downregulation [Citation61–66]. SHF negatively regulates the oncogenic ALK, with its loss increasing cell growth and mobility, and thus invasiveness [Citation67]. In nonmetastatic neuroblastomas, SHF expression was also positively associated [Citation67]. Investigations on RGS7 associated the DNA methylation-induced loss of gene expression with worse survival in renal cell carcinoma [Citation68].
Conclusion
According to our knowledge, the present study is the first analyzing 480,000 single CpGs within a breast tumor cohort including various histological and molecular subtypes. The identified complementarity of genetic and epigenetic instability indicates alternative ways of tumor development within various subtypes of breast cancer. The enhanced levels of DNA methylation within ILBC exhibited not only on the global (450K methylation data) but also on the candidate gene level (bisulfite pyrosequencing, reanalysis of the TCGA dataset, MBD-capture/promoter microarray) associates this histological subtype of breast cancer with a CpG island methylator phenotype. It also hints at an underlying epigenetic instability preventing faithful propagation of DNA methylation patterns, which requires additional studies. These findings will certainly contribute to the elucidation of the peculiarities of lobular breast cancer, which needs to be explored further in future studies.
Future perspective
The focus of this study is on differentially methylated regions and not regions commonly methylated in breast cancer. The seven candidate genes identified by all four algorithms used represent genes commonly hypermethylated in lobular breast cancer. Whether and how the gene products are involved in the development of lobular breast cancer needs to be elucidated in further studies. No regions heavily methylated in all breast cancer cases could be identified and the lists of regions commonly methylated between various groups have to be studied in detail in future studies.
DNA methylation is considered as a potential biomarker for the early detection and classification of human cancers. The higher stability of DNA over RNA (required for gene expression analyses) makes DNA methylation alterations a more promising biomarker for the clinics. Since epigenetic modifications are potentially reversible, they provide additional new therapeutic targets for personalized medicine. Some of the so-called ‘epigenetic drugs’ are already US FDA approved, but they still have major drawbacks. Therefore, further understanding of the complex deregulation of epigenetic mechanisms during carcinogenesis will also lead to the better treatment of patients.
Lobular breast cancer shows the highest methylation in comparison to other breast cancer subtypes. By contrast, genetic instability (number of copy number alterations) was lowest in lobular breast cancer.
Tumors of BRCA1-mutation carriers showed the lowest levels of DNA methylation but the highest levels of genetic instability.
The existence of a ‘CpG island methylator phenotype’ in human breast cancer is strongly supported, especially in the lobular subtype.
DNA methylation patterns of well-established breast cancer cell lines are far away from patterns in primary tissue specimens.
Four statistical approaches were performed to analyze the 450K BeadChip dataset.
Identification of seven differentially methylated genes clearly discriminates ILBC from BRCA1-mutated tumors: DNM3, mir129-2, PGLYRP2, PRKCB, RGS7, SHF and TACC1.
Expression of differentially methylated genes showed better RFS in breast cancer.
Availability of supporting data
450K BeadChip data and aCGH data have been submitted to GEO, accession number GSE59903.
J Roessler and U Lehmann conceived and planned the study with support from O Ammerpohl, D Steinemann and H Kreipe. J Roessler, O Ammerpohl, J Gutwein, D Steinemann, B Hasemeier, R Geffers and E Schipper carried out all experiments and prepared all figures. N Arnold, R Schmutzler, CR Bartram, T Heinrich, B Schlegelberger, D Steinemann and H Kreipe collected clinical data and analyzed data. M Abbas, W Antonopoulos and H Kreipe selected and contributed the histopathological specimens and participated in the data analysis. J Roessler, O Ammerpohl, J Gutwein, V Weyer, M Sariyar and U Lehmann analyzed the HM450K methylation data. J Roessler, D Steinemann and U Lehmann analyzed the aCGH data. J Roessler and U Lehmann evaluated all data and wrote the manuscript with support from R Schmutzler, CR Bartram, T Heinrich, B Schlegelberger and H Kreipe. All authors were involved in finishing the final version of the manuscript and had approved it for submission.
Ethical conduct of research
The authors state that they have obtained appropriate institutional review board approval or have followed the principles outlined in the Declaration of Helsinki for all human or animal experimental investigations. In addition, for investigations involving human subjects, informed consent has been obtained from the participants involved.
Supplemental Figure 1
Download MS Word (1 MB)Supplemental Table 1
Download MS Excel (37 KB)Supplemental Table 2
Download MS Excel (13.9 KB)Supplemental Table 3
Download MS Excel (10.5 KB)Financial & competing interests disclosure
This study was funded in part by the Lower Saxony Israel foundation. The authors have no other relevant affiliations or financial involvement with any organization or entity with a financial interest in or financial conflict with the subject matter or materials discussed in the manuscript apart from those disclosed.
No writing assistance was utilized in the production of this manuscript.
Additional information
Funding
References
- Ferlay J , Steliarova-FoucherE , Lortet-TieulentJet al. Cancer incidence and mortality patterns in Europe, estimates for 40 countries in 2012 . Eur. J. Cancer49 ( 6 ), 1374 – 1403 ( 2013 ).
- Arps DP , HealyP , ZhaoL , KleerCG , PangJC . Invasive ductal carcinoma with lobular features, a comparison study to invasive ductal and invasive lobular carcinomas of the breast . Breast Cancer Res. Treat.138 ( 3 ), 719 – 726 ( 2013 ).
- Li C , UribeD , DalingJ . Clinical characteristics of different histologic types of breast cancer . Br. J. Cancer93 ( 9 ), 1046 – 1052 ( 2005 ).
- Yerushalmi R , HayesM , GelmonK . Breast carcinoma – rare types, review of the literature . Ann. Oncol.20 ( 11 ), 1763 – 1770 ( 2009 ).
- G Group ABCS . Prevalence and penetrance of BRCA1 and BRCA2 mutations in a population-based series of breast cancer cases . Br. J. Cancer83 ( 10 ), 1301 ( 2000 ).
- Loman N , JohannssonO , KristofferssonU , OlssonH , BorgÅ . Family history of breast and ovarian cancers and BRCA1 and BRCA2 mutations in a population-based series of early-onset breast cancer . J. Natl Cancer Inst.93 ( 16 ), 1215 – 1223 ( 2001 ).
- Shih HA , CouchFJ , NathansonKLet al. BRCA1 and BRCA2 mutation frequency in women evaluated in a breast cancer risk evaluation clinic . J. Clin. Oncol.20 ( 4 ), 994 – 999 ( 2002 ).
- Laird PW . The power and the promise of DNA methylation markers . Nat. Rev. Cancer3 ( 4 ), 253 – 266 ( 2003 ).
- Hill VK , RickettsC , BiecheIet al. Genome-wide DNA methylation profiling of CpG islands in breast cancer identifies novel genes associated with tumorigenicity . Cancer Res.71 ( 8 ), 2988 – 2999 ( 2011 ).
- Fang F , TurcanS , RimnerAet al. Breast cancer methylomes establish an epigenomic foundation for metastasis . Sci. Transl. Med.3 ( 75 ), 75ra25 ( 2011 ).
- Fackler MJ , UmbrichtCB , WilliamsDet al. Genome-wide methylation analysis identifies genes specific to breast cancer hormone receptor status and risk of recurrence . Cancer Res.71 ( 19 ), 6195 – 6207 ( 2011 ).
- Holm K , HegardtC , StaafJet al. Molecular subtypes of breast cancer are associated with characteristic DNA methylation patterns . Breast Cancer Res.12 ( 3 ), R36 ( 2010 ).
- Kamalakaran S , VaradanV , Giercksky RussnesHEet al. DNA methylation patterns in luminal breast cancers differ from non-luminal subtypes and can identify relapse risk independent of other clinical variables . Mol. Oncol.5 ( 1 ), 77 – 92 ( 2011 ).
- Network CGA . Comprehensive molecular portraits of human breast tumours . Nature490 ( 7418 ), 61 – 70 ( 2012 ).
- Hughes LA , Khalid-de BakkerCA , SmitsKMet al. The CpG island methylator phenotype in colorectal cancer: progress and problems . Biochim. Biophys. Acta1825 ( 1 ), 77 – 85 ( 2012 ).
- Toyota M , AhujaN , Ohe-ToyotaM , HermanJG , BaylinSB , IssaJ-PJ . CpG island methylator phenotype in colorectal cancer . Proc. Natl Acad. Sci. USA96 ( 15 ), 8681 – 8686 ( 1999 ).
- Hughes LA , MelotteV , De SchrijverJet al. The CpG island methylator phenotype, what’s in a name? Cancer Res. 73 ( 19 ), 5858 – 5868 ( 2013 ).
- Van der Auwera I , YuW , SuoL , Van NesteLet al. Array-based DNA methylation profiling for breast cancer subtype discrimination . PLoS ONE5 ( 9 ), e12616 ( 2010 ).
- Turcan S , RohleD , GoenkaAet al. IDH1 mutation is sufficient to establish the glioma hypermethylator phenotype . Nature483 ( 7390 ), 479 – 483 ( 2012 ).
- Noushmehr H , WeisenbergerDJ , DiefesKet al. Identification of a CpG island methylator phenotype that defines a distinct subgroup of glioma . Cancer cell17 ( 5 ), 510 – 522 ( 2010 ).
- Figueroa ME , Abdel-WahabO , LuCet al. Leukemic IDH1 and IDH2 mutations result in a hypermethylation phenotype, disrupt TET2 function, and impair hematopoietic differentiation . Cancer Cell18 ( 6 ), 553 – 567 ( 2010 ).
- Pansuriya TC , van EijkR , d’ AdamoPet al. Somatic mosaic IDH1 and IDH2 mutations are associated with enchondroma and spindle cell hemangioma in Ollier disease and Maffucci syndrome . Nat. Genet.43 ( 12 ), 1256 – 1261 ( 2011 ).
- Bibikova M , BarnesB , TsanCet al. High density DNA methylation array with single CpG site resolution . Genomics98 ( 4 ), 288 – 295 ( 2011 ).
- Christgen M , BruchhardtH , HadamitzkyCet al. Comprehensive genetic and functional characterization of IPH-926, a novel CDH1-null tumour cell line from human lobular breast cancer . J. Pathol.217 ( 5 ), 620 – 632 ( 2009 ).
- Whitehead RH , BertoncelloI , WebberLM , PedersenJS . A new human breast carcinoma cell line (PMC42) with stem cell characteristics. I. Morphologic characterization . J. Natl Cancer Inst.70 ( 4 ), 649 – 661 ( 1983 ).
- Ackland M , MichalczykA , WhiteheadR . PMC42, a novel model for the differentiated human breast . Exp. Cell Res.263 ( 1 ), 14 – 22 ( 2001 ).
- Roessler J , AmmerpohlO , GutweinJet al. Quantitative cross-validation and content analysis of the 450k DNA methylation array from Illumina, Inc. BMC Res. Notes 5 ( 1 ), 210 ( 2012 ).
- Kilaru V , BarfieldRT , SchroederJW , SmithAK , ConneelyKN . MethLAB, a graphical user interface package for the analysis of array-based DNA methylation data . Epigenetics7 ( 3 ), 225 – 229 ( 2012 ).
- Wang D , YanL , HuQet al. IMA, an R package for high-throughput analysis of Illumina’s 450K Infinium methylation data . Bioinformatics28 ( 5 ), 729 – 730 ( 2012 ).
- Benjamini Y , HochbergY . Controlling the false discovery rate, a practical and powerful approach to multiple testing . J. R. Stat. Soc. Series B Stat. Methodol.57 ( 1 ), 289 – 300 ( 1995 ).
- Lehmann U , HasemeierB , ChristgenMet al. Epigenetic inactivation of microRNA gene hsa-mir-9–1 in human breast cancer . J. Pathol.214 ( 1 ), 17 – 24 ( 2008 ).
- Kaplan Meier-plotter [cancer survival analysis] . http://kmplot.com
- Györffy B , LanczkyA , EklundACet al. An online survival analysis tool to rapidly assess the effect of 22,277 genes on breast cancer prognosis using microarray data of 1,809 patients . Breast Cancer Res. Treat.123 ( 3 ), 725 – 731 ( 2010 ).
- Coppersmith D , HongSJ , HoskingJR . Partitioning nominal attributes in decision trees . Data Min. Knowl. Discov.3 ( 2 ), 197 – 217 ( 1999 ).
- Rauch T , LiH , WuX , PfeiferGP . MIRA-assisted microarray analysis, a new technology for the determination of DNA methylation patterns, identifies frequent methylation of homeodomain-containing genes in lung cancer cells . Cancer Res.66 ( 16 ), 7939 – 7947 ( 2006 ).
- Bae YK , BrownA , GarrettEet al. Hypermethylation in histologically distinct classes of breast cancer . Clin. Cancer Res.10 ( 18 ), 5998 – 6005 ( 2004 ).
- Krop I , MaguireP , Lahti-DomeniciJet al. Lack of HIN-1 methylation in BRCA1-linked and ‘BRCA1-like’ breast tumors . Cancer Res.63 ( 9 ), 2024 – 2027 ( 2003 ).
- Fackler MJ , McVeighM , EvronEet al. DNA methylation of RASSF1A, HIN-1, RAR-beta, Cyclin D2 and Twist in in situ and invasive lobular breast carcinoma . Int. J. Cancer107 ( 6 ), 970 – 975 ( 2003 ).
- Lehmann U , CelikkayaG , HasemeierB , LängerF , KreipeH . Promoter hypermethylation of the death-associated protein kinase gene in breast cancer is associated with the invasive lobular subtype . Cancer Res.62 ( 22 ), 6634 – 6638 ( 2002 ).
- Bediaga NG , Acha-SagredoA , GuerraIet al. DNA methylation epigenotypes in breast cancer molecular subtypes . Breast Cancer Res.12 ( 5 ), R77 ( 2010 ).
- Waddell N , ArnoldJ , CocciardiSet al. Subtypes of familial breast tumours revealed by expression and copy number profiling . Breast Cancer Res. Treat.123 ( 3 ), 661 – 677 ( 2010 ).
- Jönsson G , NaylorTL , Vallon-ChristerssonJet al. Distinct genomic profiles in hereditary breast tumors identified by array-based comparative genomic hybridization . Cancer Res.65 ( 17 ), 7612 – 7621 ( 2005 ).
- Bertucci F , OrsettiB , NègreVet al. Lobular and ductal carcinomas of the breast have distinct genomic and expression profiles . Oncogene27 ( 40 ), 5359 – 5372 ( 2008 ).
- Huiping C , SigurgeirsdottirJ , JonassonJet al. Chromosome alterations and E-cadherin gene mutations in human lobular breast cancer . Br. J. Cancer81 ( 7 ), 1103 ( 1999 ).
- Shen C-Y , YuJ-C , LoY-Let al. Genome-wide search for loss of heterozygosity using laser capture microdissected tissue of breast carcinoma, an implication for mutator phenotype and breast cancer pathogenesis . Cancer Res.60 ( 14 ), 3884 – 3892 ( 2000 ).
- Horlings HM , WeigeltB , AndersonEMet al. Genomic profiling of histological special types of breast cancer . Breast Cancer Res. Treat.142 ( 2 ), 257 – 269 ( 2013 ).
- Wessels LF , van WelsemT , HartAA , van’t VeerLJ , ReindersMJ , NederlofPM . Molecular classification of breast carcinomas by comparative genomic hybridization a specific somatic genetic profile for BRCA1 tumors . Cancer Res.62 ( 23 ), 7110 – 7117 ( 2002 ).
- Nishizaki T , ChewK , ChuLet al. Genetic alterations in lobular breast cancer by comparative genomic hybridization . Int. J. Cancer74 ( 5 ), 513 – 517 ( 1997 ).
- Kozlowska J , KarpinskiP , SzmidaEet al. Assessment of chromosomal imbalances in CIMP-high and CIMP-low/CIMP-0 colorectal cancers . Tumour Biol.33 ( 4 ), 1015 – 1019 ( 2012 ).
- Fleischer T , FrigessiA , JohnsonKCet al. Genome-wide DNA methylation profiles in progression to in situ and invasive carcinoma of the breast with impact on gene transcription and prognosis . Genome Biol.15 , 435 ( 2014 ).
- Inokawa Y , NomotoS , HishidaMet al. Dynamin 3, a new candidate tumor suppressor gene in hepatocellular carcinoma detected by triple combination array analysis . Onco. Targets Ther.6 , 1417 ( 2013 ).
- Dedeurwaerder S , DesmedtC , CalonneEet al. DNA methylation profiling reveals a predominant immune component in breast cancers . EMBO Mol. Med.3 ( 12 ), 726 – 741 ( 2011 ).
- Ghayad SE , VendrellJA , BiecheIet al. Identification of TACC1, NOV, and PTTG1 as new candidate genes associated with endocrine therapy resistance in breast cancer . J. Mol. Endocrinol.42 ( 2 ), 87 – 103 ( 2009 ).
- Conte N , Charafe-JauffretE , DelavalBet al. Carcinogenesis and translational controls, TACC1 is down-regulated in human cancers and associates with mRNA regulators . Oncogene21 ( 36 ), 5619 – 30 ( 2002 ).
- Ha G-H , KimJ-L , BreuerE-KY . Transforming acidic coiled-coil proteins (TACCs) in human cancer . Cancer Lett.336 ( 1 ), 24 – 33 ( 2013 ).
- Petrova DT , AsifAR , ArmstrongVWet al. Expression of chloride intracellular channel protein 1 (CLIC1) and tumor protein D52 (TPD52) as potential biomarkers for colorectal cancer . Clin. Biochem.41 ( 14 ), 1224 – 1236 ( 2008 ).
- Hagiwara K , ItoH , MurateT , MiyataY , OhashiH , NagaiH . PROX1 overexpression inhibits protein kinase C beta II transcription through promoter DNA methylation . Genes Chromosomes Cancer51 ( 11 ), 1024 – 1036 ( 2012 ).
- Yu X , SongH , XiaTet al. Growth inhibitory effects of three miR-129 family members on gastric cancer . Gene532 ( 1 ), 87 – 93 ( 2013 ).
- Kang M , LiY , LiuWet al. miR-129–122 suppresses proliferation and migration of esophageal carcinoma cells through downregulation of SOX4 expression . Int. J. Mol. Med.32 ( 1 ), 51 ( 2013 ).
- Chen X , ZhangL , ZhangTet al. Methylation-mediated repression of microRNA 129–122 enhances oncogenic SOX4 expression in HCC . Liver Int.33 ( 3 ), 476 – 486 ( 2013 ).
- Wong K-Y , YimRL-H , KwongY-Let al. Epigenetic inactivation of the MIR129–2 in hematological malignancies . J. Hematol. Oncol.6 ( 1 ), 16 ( 2013 ).
- Anwar SL , AlbatC , KrechTet al. Concordant hypermethylation of intergenic microRNA genes in human hepatocellular carcinoma as new diagnostic and prognostic marker . Int. J. Cancer133 ( 3 ), 660 – 670 ( 2013 ).
- Lu C-Y , LinK-Y , TienM-T , WuC-T , UenY-H , TsengT-L . Frequent DNA methylation of MiR-129–122 and its potential clinical implication in hepatocellular carcinoma . Genes Chromosomes Cancer52 ( 7 ), 636 – 643 ( 2013 ).
- Chen X , HuH , GuanXet al. CpG island methylation status of miRNAs in esophageal squamous cell carcinoma . Int. J. Cancer130 ( 7 ), 1607 – 1613 ( 2012 ).
- Huang Y-W , LiuJC , DeatherageDEet al. Epigenetic repression of microRNA-129–122 leads to overexpression of SOX4 oncogene in endometrial cancer . Cancer Res.69 ( 23 ), 9038 – 9046 ( 2009 ).
- Tsai K-W , WuC-W , HuL-Yet al. Epigenetic regulation of miR-34b and miR-129 expression in gastric cancer . Int. J. Cancer129 ( 11 ), 2600 – 2610 ( 2011 ).
- Takagi D , TatsumiY , YokochiTet al. Novel adaptor protein Shf interacts with ALK receptor and negatively regulates its downstream signals in neuroblastoma . Cancer Sci.104 ( 5 ), 563 – 572 ( 2013 ).
- Ricketts CJ , MorrisMR , GentleDet al. Methylation profiling and evaluation of demethylating therapy in renal cell carcinoma . Clin. Epigenetics5 ( 1 ), 16 ( 2013 ).