
Abstract
Aim: Identify epigenetic marks in the vicinity of DMPK (linked to myotonic dystrophy, DM1) that help explain tissue-specific differences in its expression. Materials & methods: At DMPK and its flanking genes (DMWD, SIX5, BHMG1 and RSPH6A), we analyzed many epigenetic and transcription profiles from myoblasts, myotubes, skeletal muscle, heart and 30 nonmuscle samples. Results: In the DMPK gene neighborhood, muscle-associated DNA hypermethylation and hypomethylation, enhancer chromatin, and CTCF binding were seen. Myogenic DMPK hypermethylation correlated with high expression and decreased alternative promoter usage. Testis/sperm hypomethylation of BHMG1 and RSPH6A was associated with testis-specific expression. G-quadruplex (G4) motifs and sperm-specific hypomethylation were found near the DM1-linked CTG repeats within DMPK. Conclusion: Tissue-specific epigenetic features in DMPK and neighboring genes help regulate its expression. G4 motifs in DMPK DNA and RNA might contribute to DM1 pathology.
(A) DMPK (seven RefSeq isoforms) and DMWD (one RefSeq isoform and four ENSEMBL transcripts) at chr19:46,272,548–46,296,787 (~24 kb) from the UCSC Genome Browser [Citation27]. All DNA coordinates are from the human reference genome hg19. Boxed red bars, significantly hypermethylated sites; green bars in a dotted box, significantly hypomethylated sites in the set of Mb and Mt (MbMt) versus 16 types of nonmuscle cell cultures or skeletal muscle versus 14 types of nonmuscle tissues as determined from analysis of RRBS datasets. (B) and (C) RRBS data tracks for cell cultures and tissues, respectively. The tracks use an 11-color, semi-continuous scale. Technical or biological duplicates were analyzed for all of the samples, and some of these are shown. Various cell strains refers to melanocytes, renal cortical epithelial cells, renal epithelial cells, astrocytes (short arrow), choroid plexus epithelial cells, iris pigment epithelial cells, retinal pigment epithelial cells, IMR90 fetal lung fibroblasts, esophageal epithelial cells, small airway epithelial cells and bronchial epithelial cells. Vertical arrowhead above the DMPK 3′UTR in (A) and subsequent figures, location of the DM1-associated CTG repeats in the 3′ UTR of DMPK. Other arrows are mentioned in the text. Note that at this resolution, clustered CpG sites cannot be resolved.
DM: Differentially methylated; ESC: Embryonic stem cell; HMEC: Human mammary epithelial cell; LCL: Lymphoblastoid cell line; Mb: Myoblast; Mt: Myotube; RRBS: Reduced representation bisulfite sequencing.
![Figure 1. Myogenic hypermethylated CpG sites in DMPK and hypomethylated sites in the adjacent DMWD by reduced representation bisulfite sequencing. (A) DMPK (seven RefSeq isoforms) and DMWD (one RefSeq isoform and four ENSEMBL transcripts) at chr19:46,272,548–46,296,787 (~24 kb) from the UCSC Genome Browser [Citation27]. All DNA coordinates are from the human reference genome hg19. Boxed red bars, significantly hypermethylated sites; green bars in a dotted box, significantly hypomethylated sites in the set of Mb and Mt (MbMt) versus 16 types of nonmuscle cell cultures or skeletal muscle versus 14 types of nonmuscle tissues as determined from analysis of RRBS datasets. (B) and (C) RRBS data tracks for cell cultures and tissues, respectively. The tracks use an 11-color, semi-continuous scale. Technical or biological duplicates were analyzed for all of the samples, and some of these are shown. Various cell strains refers to melanocytes, renal cortical epithelial cells, renal epithelial cells, astrocytes (short arrow), choroid plexus epithelial cells, iris pigment epithelial cells, retinal pigment epithelial cells, IMR90 fetal lung fibroblasts, esophageal epithelial cells, small airway epithelial cells and bronchial epithelial cells. Vertical arrowhead above the DMPK 3′UTR in (A) and subsequent figures, location of the DM1-associated CTG repeats in the 3′ UTR of DMPK. Other arrows are mentioned in the text. Note that at this resolution, clustered CpG sites cannot be resolved.DM: Differentially methylated; ESC: Embryonic stem cell; HMEC: Human mammary epithelial cell; LCL: Lymphoblastoid cell line; Mb: Myoblast; Mt: Myotube; RRBS: Reduced representation bisulfite sequencing.](/cms/asset/7e100e8f-3595-476e-8e6b-44872d6964c0/iepi_a_12325062_f0001.jpg)
(A) The significant MbMt DMRs and skeletal muscle DMRs derived from RRBS in the 30-kb region containing SIX5, DMPK and DMWD (chr19:46,267,478–46,297,495). Three of the seven RefSeq isoforms of DMPK and the 0.5-kb 5′ end of BHMG1 upstream of SIX5 are not shown. There were skeletal muscle hypermethylated CpG sites in DMPK but they did not reach the level of significance for an extended DMR, probably due to the low coverage by RRBS. (B) Examples of RRBS tracks used to determine DMRs and to show RRBS coverage of this chromosomal region. Underneath are the CpG islands from the UCSC Genome Browser [Citation27]. (C) Bisulfite-seq profiles for the indicated samples with blue bars above each profile indicating LMRs, regions that have significantly lower methylation than the rest of the genome [Citation39]. Biological duplicates are shown for mid frontal gyrus. (D) Chromatin state segmentation maps [Citation30] are given using the indicated color coding for the type of chromatin; weak transcription (light green) or transcription-elongation type chromatin (dark green). Arrows, black bars and boxed regions are notations mentioned in the text.
DMR: Differentially methylated region; enh: Enhancer; ESC: Embryonic stem cell; Insul: Insulator; LCL: Lymphoblastoid cell line; LMR: Low-methylation region; Mb: Myoblast; Mt: Myotube; NHLF: Normal human lung fibroblast; PBMC: Peripheral blood mononuclear cell; prom: Promoter; RRBS: Reduced representation bisulfite sequencing.
![Figure 2. Epigenetic marks associated with skeletal muscle or heart in the region containing DMPK, DMWD and SIX5. (A) The significant MbMt DMRs and skeletal muscle DMRs derived from RRBS in the 30-kb region containing SIX5, DMPK and DMWD (chr19:46,267,478–46,297,495). Three of the seven RefSeq isoforms of DMPK and the 0.5-kb 5′ end of BHMG1 upstream of SIX5 are not shown. There were skeletal muscle hypermethylated CpG sites in DMPK but they did not reach the level of significance for an extended DMR, probably due to the low coverage by RRBS. (B) Examples of RRBS tracks used to determine DMRs and to show RRBS coverage of this chromosomal region. Underneath are the CpG islands from the UCSC Genome Browser [Citation27]. (C) Bisulfite-seq profiles for the indicated samples with blue bars above each profile indicating LMRs, regions that have significantly lower methylation than the rest of the genome [Citation39]. Biological duplicates are shown for mid frontal gyrus. (D) Chromatin state segmentation maps [Citation30] are given using the indicated color coding for the type of chromatin; weak transcription (light green) or transcription-elongation type chromatin (dark green). Arrows, black bars and boxed regions are notations mentioned in the text.DMR: Differentially methylated region; enh: Enhancer; ESC: Embryonic stem cell; Insul: Insulator; LCL: Lymphoblastoid cell line; LMR: Low-methylation region; Mb: Myoblast; Mt: Myotube; NHLF: Normal human lung fibroblast; PBMC: Peripheral blood mononuclear cell; prom: Promoter; RRBS: Reduced representation bisulfite sequencing.](/cms/asset/5e46834a-3b88-4bd7-9d71-f5cacba8b8b7/iepi_a_12325062_f0002.jpg)
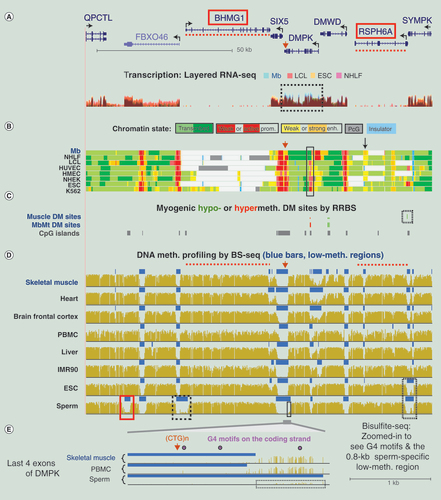
(A) RNA-seq profiles (not strand-specific) for the four indicated, color-coded cell cultures are shown in overlaid format (~128-kb region at chr19:46,199,767–46,327,565). The RNA-seq analysis was done on >200 nt poly(A)+ RNA. Only one DMPK isoform and the 3′ ends of QPCTL and SYMPK are shown. (B) Chromatin state segmentation as in . (C) CpGs that were significantly hypomethylated or hypermethylated in skeletal muscle or MbMt versus nonmuscle samples determined from RRBS datasets. (D) BS-seq profiles indicating regions that had significantly lower methylation relative to the rest of the genome (LMRs) by blue bars. Dotted red lines, positions of the BHMG1 and RSPH6A genes for orientation; boxes in Panel D, LMRs described in the text. (E) Expanded view of the region from the 3′ end of the terminal exon 15 to intron 10 of DMPK (chr19:46,272,873–46,275,370; 2.5 kb). All but the upstream end of this region overlaps a CpG island. Arrowhead, CTG repeat in the 3′ UTR of DMPK; dotted box, 0.8-kb sperm-specific LMR; circles, G-quadruplex (G4) motifs (G3+N1–7G3+N1–7G3+N1–7G3+).
DM: Differentially methylated; ESC: Embryonic stem cell; HUVEC: Human umbilical vein endothelial cell; LCL: Lymphoblastoid cell line; LMR: Low-methylation region; Mb: Myoblast; NHEK: Normal human epidermal keratinocyte; NHLF: Normal human lung fibroblast; K562: Chronic myelogenous leukemia cell line; IMR90: Fetal lung fibroblast cell line; PBMC: Peripheral blood mononuclear cell; RRBS: Reduced representation bisulfite sequencing.
(A) DMPK (four isoforms are shown), SIX5 and DMWD with myogenic DM sites indicated below (chr19:46,265,940–46,298,675). (B) Human DNA sequences orthologous to MyoD binding sites as deduced by MyoD ChIP-seq on murine C12C12 Mb and Mt [Citation47]. Their relative signal strength in the C2C12 ChIP-seq is shown in parentheses. (C) CTCF ChIP-seq with a vertical viewing range of 0–50. Boxed region, tissue-specific CTCF site that displayed low signal in Mb and Mt and is adjacent to the myogenic hypermethylated DMR in DMPK; oval, CTCF site present preferentially in Mb and Mt. (C–F) ChIP-seq profiles for H3 methylation or acetylation as indicated. Triangles, position of the MbMt and skeletal muscle hypermethylated sites in DMPK; dotted lines and boxes, promoter-like and enhancer-like histone modifications, respectively, seen preferentially in Mb, Mt, skeletal muscle tissue and heart. CTCF ChIP-seq data for more samples are given in Supplementary Figure 1. DM: Differentially methylated; ESC: Embryonic stem cell; HMEC: Human mammary epithelial cell; LCL: Lymphoblastoid cell line; Mb: Myoblast; Mt: Myotube; NHLF: normal human lung fibroblasts; PBMC: Peripheral blood mononuclear cell.
![Figure 4. Tissue-specific histone methylation and acetylation in the vicinity of DMPK. (A) DMPK (four isoforms are shown), SIX5 and DMWD with myogenic DM sites indicated below (chr19:46,265,940–46,298,675). (B) Human DNA sequences orthologous to MyoD binding sites as deduced by MyoD ChIP-seq on murine C12C12 Mb and Mt [Citation47]. Their relative signal strength in the C2C12 ChIP-seq is shown in parentheses. (C) CTCF ChIP-seq with a vertical viewing range of 0–50. Boxed region, tissue-specific CTCF site that displayed low signal in Mb and Mt and is adjacent to the myogenic hypermethylated DMR in DMPK; oval, CTCF site present preferentially in Mb and Mt. (C–F) ChIP-seq profiles for H3 methylation or acetylation as indicated. Triangles, position of the MbMt and skeletal muscle hypermethylated sites in DMPK; dotted lines and boxes, promoter-like and enhancer-like histone modifications, respectively, seen preferentially in Mb, Mt, skeletal muscle tissue and heart. CTCF ChIP-seq data for more samples are given in Supplementary Figure 1. DM: Differentially methylated; ESC: Embryonic stem cell; HMEC: Human mammary epithelial cell; LCL: Lymphoblastoid cell line; Mb: Myoblast; Mt: Myotube; NHLF: normal human lung fibroblasts; PBMC: Peripheral blood mononuclear cell.](/cms/asset/e2c63dcd-545c-4547-8a3b-3d302709da2b/iepi_a_12325062_f0004.jpg)
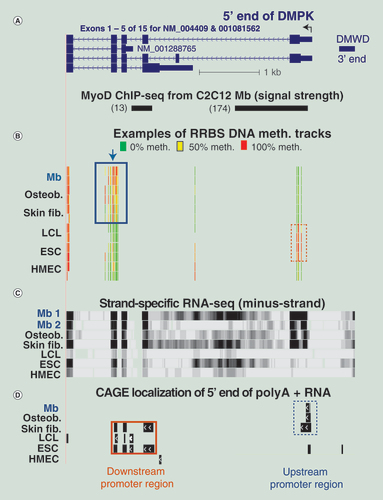
(A) Four of the DMPK isoforms are shown with the C2C12 Mb-inferred MyoD binding sites underneath (chr19:46,281,791–46,286,517). (B) Examples of RRBS tracks are given as in . Arrow, position of the CpG within the ZNF143 binding motif in this region. (C) Strand-specific RNA-seq for the minus-strand RNA profile with a vertical viewing range of 0–200. (D) 5′ ends of poly(A)+ RNA mapped by CAGE from genome-wide profiles. Dashed box, region with more methylation in LCL, ESC and HMEC samples than for the other cell types; solid box, region with more methylation in Mb, osteoblasts and skin fibroblasts than for the other cell types.
CAGE: Cap analysis gene expression; ESC: Embryonic stem cell; HMEC: Human mammary epithelial cell; LCL: Lymphoblastoid cell line; Mb: Myoblast; RRBS: Reduced representation bisulfite sequencing.
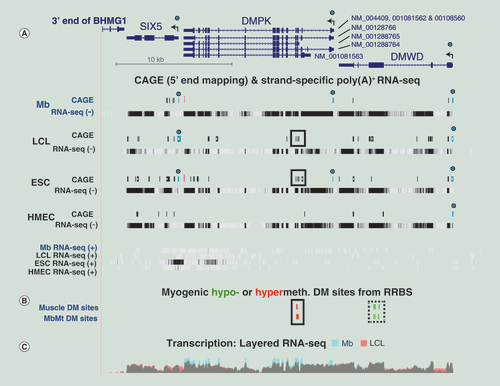
(A) CAGE and minus-strand RNA-seq profiles (-) for DMPK, SIX5 and DMWD with the plus-strand RNA-seq profiles (+) shown below (chr19:46,265,940–46,298,675; ~33 kb). Circles over blue bars in CAGE tracks, 5′ ends corresponding to the canonical RefSeq isoforms; high red bars in CAGE tracks, signal that was stronger for plus-strand than for minus-strand transcripts; boxes around black bars, region of alternative promoter for DMPK. The vertical viewing for strand-specific RNA-seq was 0–30. (B) Muscle and MbMt hypomethylated and hypomethylated sites from RRBS datasets. (C) Overlaid nonstrand-specific RNA-seq profiles for just Mb and LCL samples indicate higher steady-state levels of DMPK in Mb.
CAGE: Cap analysis gene expression; DM: Differentially methylated; ESC: Embryonic stem cell; LCL: Lymphoblastoid cell line; RRBS: Reduced representation bisulfite sequencing.
DMPK is in an 82-kb gene neighborhood with unusually small intergenic regions (e.g., only about 0.5 kb between the 5′ end of the RefSeq isoforms of DMPK and the 3′ end of DMWD and only 0.2 kb between the 3′ ends of SIX5 and BMHG1). This region contains two testis-specific genes (BHMG1 and RSPH6A) and one gene that is expressed at higher levels in testis than in other tissues, according to analyses of mouse RNA [Citation12,Citation64] (DMWD). Based upon epigenetic and RNA-seq profiles, we propose that differential methylation of alternative DMPK promoters and myogenic enhancers in DMPK, DMWD and RSPH6A help upregulate expression specifically from the upstream promoter of DMPK in Mb. The observed opposite patterns of methylation of the two DMPK promoter regions in Mb versus LCL and ESC samples may help direct transcription initiation mostly to the upstream (canonical) DMPK promoter or to the downstream one. In Mb, the DMWD enhancer may also upregulate the more distant DMWD promoter, although to a lesser extent than the canonical DMPK promoter, as suggested by the much higher expression of DMPK than DMWD in Mb (Supplementary Table 1) and the absence of predicted insulators in this region (D). At the 3′ end of DMPK, potential G-quadruplex sequences (G4 motifs) and sperm-specific hypomethylation near the CTG repeats may contribute to repeat expansion. G4 motifs might also increase the pathogenicity of the CTG/CUG repeats at the RNA level.
Mb: myoblasts; ESC: Embryonic stem cell; LCL: Lymphoblastoid cell line; txn: Transcription.
![Figure 7. A model for myogenic transcription control of DMPK involving enhancers in neighboring genes, including in a testis-specific gene. DMPK is in an 82-kb gene neighborhood with unusually small intergenic regions (e.g., only about 0.5 kb between the 5′ end of the RefSeq isoforms of DMPK and the 3′ end of DMWD and only 0.2 kb between the 3′ ends of SIX5 and BMHG1). This region contains two testis-specific genes (BHMG1 and RSPH6A) and one gene that is expressed at higher levels in testis than in other tissues, according to analyses of mouse RNA [Citation12,Citation64] (DMWD). Based upon epigenetic and RNA-seq profiles, we propose that differential methylation of alternative DMPK promoters and myogenic enhancers in DMPK, DMWD and RSPH6A help upregulate expression specifically from the upstream promoter of DMPK in Mb. The observed opposite patterns of methylation of the two DMPK promoter regions in Mb versus LCL and ESC samples may help direct transcription initiation mostly to the upstream (canonical) DMPK promoter or to the downstream one. In Mb, the DMWD enhancer may also upregulate the more distant DMWD promoter, although to a lesser extent than the canonical DMPK promoter, as suggested by the much higher expression of DMPK than DMWD in Mb (Supplementary Table 1) and the absence of predicted insulators in this region (Figure 2D). At the 3′ end of DMPK, potential G-quadruplex sequences (G4 motifs) and sperm-specific hypomethylation near the CTG repeats may contribute to repeat expansion. G4 motifs might also increase the pathogenicity of the CTG/CUG repeats at the RNA level.Mb: myoblasts; ESC: Embryonic stem cell; LCL: Lymphoblastoid cell line; txn: Transcription.](/cms/asset/a353ba3b-fd87-45ac-9cee-9abccc448a19/iepi_a_12325062_f0007.jpg)
First draft submitted: 2 September 2015; Accepted for publication: 19 October 2015; Published online: 12 January 2016
Background
DMPK, dystrophia myotonica protein kinase, encodes a serine/threonine protein kinase implicated in various developmental and physiological functions [Citation1–5]. The most prominent roles of DMPK protein in normal tissues are in skeletal and heart muscle. Its functions include regulating calcium ion homeostasis in myotubes (Mt) [Citation6], sodium ion-channel gating in skeletal muscle tissue [Citation7], promoting Mt formation from myoblasts (Mb) [Citation8], protecting against age-related muscle weakness [Citation1], protecting membrane-bound cardiac β-adrenergic receptors [Citation9] and facilitating atrioventricular conduction [Citation10]. Although DMPK is expressed in diverse tissues, skeletal muscle, cardiac muscle and certain smooth muscles display much higher steady-state levels than most other tissues [Citation11–14].
In the 3′ untranslated region (3′UTR) of DMPK RNA there is a tandem (CTG; CAG) repeat (CTG repeat) whose expansion is responsible for myotonic dystrophy type 1 (DM1), an autosomal dominant disease [Citation15]. This expansion involves a change from about 5–37 copies of CTG in unaffected individuals to 50–3000 copies in patients. It is a multisystem disease with symptoms appearing usually in the 2nd–4th decade and currently has no effective treatment. Frequent symptoms of DM1 [Citation15] are myotonia (delayed relaxation of skeletal muscles after voluntary contraction or electrical stimulation), muscle weakness, cardiac disease, intestinal dysmotility, cataracts, insulin resistance, male infertility, daytime hypersomnolence and balding. In classical DM1, skeletal, cardiac and smooth muscle tissues are the most prominent targets of the disease, a finding that parallels the especially important functions of DMPK protein in these tissues. In the congenital or childhood forms of the disease, which are often severe, there is also early involvement of the CNS.
Many studies indicate that the majority of DM1 symptoms are due to a toxic gain-of-function that involves accumulation of mutant DMPK RNA in ribonuclear foci in the nucleus due to its expanded CUG repeat [Citation16]. Mice with homozygous knockout of Dmpk exhibit much less similarity to DM1 patients’ symptoms than do mice harboring a transgene containing a DMPK 3′ gene fragment with the expanded repeat or transgenic mice with altered genes that are downstream effectors of pathogenic DMPK, namely, MBNL1 knockout mice and CELF1 (CUG-BP1) overexpressing mice [Citation1,Citation7,Citation17]. The expanded repeat in mutant DMPK RNA in nuclear foci sequesters regulatory proteins, especially MBNL1, which controls alternative splicing and alternative polyadenylation of various mRNAs. Given the emphasis on post-transcriptional mechanisms in DM1, only a few publications have described the regulation of transcription of DMPK [Citation18], and none discussed epigenetic control of transcription other than that at its 3′ CTG repeat-containing terminus [Citation19]. Nonetheless, it is important to understand regulation of DMPK’s expression because a mutant DMPK allele has to be expressed to produce the toxic RNA that interferes with RNA processing. Transcription of a DMPK allele with expanded repeats may also contribute to DM1 pathology by additional mechanisms. For example, repeat-associated non-ATG translation of antisense transcripts [Citation16] and decreases in DMPK protein levels may contribute to disease symptoms, even if they are not the main drivers of the disease [Citation20]. Moreover, myotonic dystrophy type 2 (DM2), which is caused by expansion of an intronic CCTG repeat in ZNF9, also results in a toxic MBNL1-sequestering RNA and gives a similar, but nonidentical, clinical presentation from that of DM1. DM2 often involves an even higher repeat expansion than DM1 but generally presents a milder disease phenotype and never is a congenital disease [Citation15]. These findings suggest that the decreases in DMPK protein levels in DM1, that are probably due to the sequestration of DMPK RNA in nuclear foci [Citation15], may contribute to the pathology.
Although the effects of homozygous loss of Dmpk on the skeletal muscle lineage in mice are rather modest, this does not preclude important roles for DMPK/Dmpk protein in skeletal muscle and myogenic progenitor cells or stem cells. For example, the skeletal muscle-specific MYOD transcription factor (TF) plays a crucial role controlling transcription in skeletal muscle formation and maintenance but a substantial muscle phenotype in Myod1-/- mice is seen only when there is a double knockout of both Myod1 and a second myogenic regulatory factor gene [Citation21]. Consistent with losses in DMPK protein making some contribution to DM1 pathology, Dmpk-/- mice exhibit minor changes in the size of head and neck muscle fibers in mature animals, just as DM1 patients often have compromised function of muscles in the same locations [Citation15,Citation22]. In addition, Dmpk-/- mice display abnormal sodium channel gating in skeletal muscle like that inferred from studies of skeletal muscle biopsies, and such changes are linked to myotonia [Citation7,Citation23] and cardiac conduction defects very similar to those of DM1 patients [Citation10]. Importantly, the findings of abnormalities in sodium channel gating in muscle and conduction in heart were seen in both Dmpk+/- and Dmpk-/- mice [Citation7,Citation10]. In addition, DM1-like abnormal calcium homeostasis was observed in Mt from Dmpk-/- mice [Citation6]. To better understand the role of transcription control of DMPK in unaffected individuals and DM1 patients, we have studied the tissue-specific epigenetics of DMPK and its surrounding genes in human cell culture and tissue samples. We found evidence for intragenic and intergenic epigenetic regulation of expression of DMPK specifically in skeletal muscle and heart in a gene neighborhood exhibiting muscle- and testis-specific epigenetic marks.
Materials & methods
Reduced representation bisulfite sequencing (RRBS) data, and DNaseI-hypersensitive site (DHS) profiles were obtained as previously described [Citation24,Citation25]. The human cell culture and tissue sources used for these profiles were given previously [Citation25]. The quality of the Mb (70% confluent) and Mt samples, which we obtained from biopsies and used for RRBS and DHS, was checked by immunostaining, as previously detailed [Citation25]. More than 90% of the cells in Mb preparations were myogenic and that >70% of nuclei in Mt preparations were in multinucleated cells. Mb were differentiated to Mt by serum deprivation in medium with 2% horse serum for 1 day followed by 3–4 days of incubation in medium containing 15% horse serum.
The public databases that we used, which are available at the UCSC Genome Browser [Citation26,Citation27] as part of the ENCODE project [Citation28], are as follows: DNA methylation by RRBS, Richard Myers, HudsonAlpha Institute for Biotechnology [Citation24]; open chromatin by DNaseI HS, Gregory Crawford, Duke University [Citation29]; chromatin state segmentation, histone modifications by ChIP-seq, and CTCF ChIP-seq, Bradley Bernstein, Broad Institute [Citation30]; transcription levels by non-strand-specific RNA-seq using >200 nt poly(A)+ RNA, Barbara Wold, California Institute of Technology [Citation31]; long RNA-seq for poly(A)+ whole-cell RNA by strand-specific analysis using >200 nt poly(A)+ RNA, Tom Gingeras, Cold Spring Harbor Laboratories [Citation32]; RNA subcellular cap analysis gene expression (CAGE) localization, Piero Carninci, RIKEN Omics Science Center [Citation33]; and ChIA-PET, Yijun Ruan, Genome Institute of Singapore [Citation34]). We quantified RNA-seq signal in individual isoforms using the Cufflinks CuffDiff tool [Citation35] on the non-strand-specific RNA-seq data. Tissue histone modification profiles that were used are available at the Epigenome Browser [Citation36] as part of the ROADMAP Epigenomics Project [Citation37]. Website links to these and other publicly available [Citation26,Citation27]. ENCODE and related human profiles that were analyzed in this study are listed in Supplementary Materials & Methods. Included in the links are descriptions of quality control and, where relevant, statistical analyses.
Myogenic hypomethylation and hypermethylation refer to our determination of statistically significant differences between myogenic and nonmyogenic samples as determined by RRBS using fitted binomial regression models at each monitored CpG site and a cutoff of a change in methylation of at least 50% at a significance level of p ≤ 0.01 from RRBS data on 18 types of cell cultures or 15 types of tissues [Citation25]. We also detected myogenic differentially methylated regions (DMRs) from the same RRBS datasets using our UPQ algorithm [Citation38]. In addition, we studied bisulfite-based, single-base resolution profiles at the UCSC Genome Browser [Citation27], which display methylation at all CpGs that can be mapped [Citation39] but such profiles were available for fewer samples than for RRBS and did not include Mb and Mt.
Results
Tissue-specific differential DNA methylation in the vicinity of DM1-linked DMPK & the adjacent DMWD & SIX5 genes
We found that DMPK exon 4 and neighboring intron sequences have a region containing significantly hypermethylated CpG sites in Mb and Mt versus nonmyogenic cells (A, red bars). The differential methylation was determined using fitted regression models to compare RRBS-determined methylomes [Citation24,Citation25] of nine myogenic progenitor cell cultures (Mb and Mt) with those of 16 types of nonmuscle cell cultures (B). Similarly, at the tissue level, overlapping differentially methylated CpG sites were found in analogous comparisons of skeletal muscle tissue with 14 types of normal nonmuscle tissue (C, black box). There were 11 CpG sites hypermethylated in the set of Mb and Mt (MbMt; B, black box) versus nonmuscle cultures. Osteoblasts, skin fibroblasts, and fetal lung fibroblasts (B, gray arrows) displayed intermediate methylation in this region. Significant hypermethylation was observed at two sites in the same region in skeletal muscle tissue. In contrast to the DMPK exon 4 region, the first exon of this gene displayed much more methylation in embryonic stem cells (ESC), leukocytes and five independently generated lymphoblastoid cell lines (LCLs) than in almost all of the other examined samples (B & C, long arrows).
The 3′ end of DMWD, a gene of uncertain function, is only 0.5 kb from the most upstream transcription start site (TSS) of DMPK (A). In exon 3, about 3 kb upstream of the DMPK TSS, DMWD exhibited significant MbMt and skeletal muscle hypomethylation relative to analogous nonmuscle samples (B & C, dotted boxes). There were 18 muscle-specific differentially methylated (DM) CpGs at the tissue stage and five at the progenitor stage (Mb or Mt) as deduced from statistical analysis of RRBS datasets. This region of myogenic hypomethylation in DMWD and the above-mentioned DMPK region of myogenic hypermethylation were the only ones seen in the 30-kb neighborhood containing these genes and the adjacent SIX5 gene using RRBS data (A & B). However, RRBS detects only ~5% of CpGs, although ~90% of CpG islands have at least some coverage [Citation40].
Recently, bisulfite-seq (BS-seq) profiles of DNA methylation at all uniquely mapped CpGs have become available for many human tissues, including skeletal muscle, and for some cell culture samples [Citation39], although not for Mb or Mt. Tracks for BS-seq methylome profiles in the UCSC Genome Browser [Citation27] display individual CpG methylation levels and also identify DNA regions that have significantly lower CpG methylation than most of the rest of the same sample’s genome (low-methylation regions, LMRs; C, horizontal blue bars) [Citation39]. A cluster of two LMRs in DMWD exon 3 observed specifically in skeletal muscle mostly overlapped the RRBS-determined MbMt- and skeletal muscle-hypomethylated DMR (A & C). A less prominent skeletal muscle-associated LMR was in intron 2 of DMWD (C, top; short arrow). An additional large, tissue-specific LMR that spanned DMPK intron 1 through the DMWD 3′ UTR was seen in skeletal muscle, heart and the frontal cortex of brain (C, top; dashed line). This LMR was shorter or not detected in other tested tissues.
The BS-seq profile of DMPK revealed more methylation in intron 2 through exon 4 in skeletal muscle tissue than in most other tissues (C, top; long red arrow). These results are consistent with the RRBS-determined MbMt-hypermethylated DMR in part of this region in DMPK (A). This MbMt or skeletal muscle hypermethylation overlaps chromatin with histone modifications indicative of a weak promoter in several nonmuscle cell cultures but not in Mb (D, black bar), as discussed below.
Another example of tissue-specific DNA methylation in the DMPK vicinity is a heart-specific LMR at the 3′ end of SIX5 (C, heart track; blue bar at far left). SIX5 encodes a homeobox-containing TF. Moreover, in the middle of SIX5, there was a highly methylated region in peripheral blood mononuclear cells (PBMC) relative to most other tissues (C, PBMC track; black box).
Sperm-specific hypomethylation in the vicinity of DMPK & G-quadruplex motifs in DMPK
A tissue-specific gene can be regulated by corresponding tissue-specific enhancers that are within dissimilar genes in their neighborhood [Citation41,Citation42]. Therefore, we examined the epigenetics of the 128-kb region centered on DMPK and containing eight genes. DMPK was the only gene in this neighborhood that had higher steady-state levels of RNA in Mb versus normal human lung fibroblasts (NHLF), ESC and an LCL (A, dotted box and Supplementary Table 1). Immediately upstream of DMWD is RSPH6A, which codes for a testes-specific cilia-associated protein [Citation43]. At the 5′ end of RSPH6A, there was a skeletal muscle hypomethylated DMR, which was deduced from RRBS profiles, and long LMRs specifically in sperm and ESC, which were identified by BS-seq (C & D, dotted box). We also noticed that BHMG1, a newly identified, little-characterized gene that is downstream of DMPK, shows strong testes-specific expression [Citation43]. Like the RSPH6A promoter, the BHMG1 promoter had a long, sperm-specific LMR in its 5′ region (D, dashed box). In addition, at the 3′ end of the BHMG1-upstream FBXO46, a ubiquitously expressed gene encoding a component of an ubiquitin ligase, there was yet another sperm-specific LMR (D, red box). Both the BHMG1 upstream and promoter regions were much less methylated in testis than in other tissues by RRBS profiling (data not shown).
The genes surrounding the murine Dmpk gene, including Rsph6a, are similar to those around the human DMPK. However, a mouse equivalent of BHMG1 was not identified. Nonetheless, two partly overlapping ENSEMBL transcripts with testes-specific expression in the region with strong sequence similarity to BHMG1 were seen in the mouse [Citation27,Citation44].
Importantly, a 0.8-kb sperm-specific LMR (C & 3E, dotted box) that overlapped testis-associated hypomethylation (C, dotted arrow) was observed in the 3′ terminus of DMPK. It was adjacent to a large constitutively unmethylated region spanning the 3′ end of DMPK and the 5′ half of SIX5. Both the constitutive and the sperm/testis-specific regions of low methylation were located in a CpG island (B). About 0.9 kb from the sperm/testis hypomethylation, the DM1-linked CTG repeat is found in the 3′ UTR of DMPK (E). On the coding strand within the sperm LMR, we noticed a low complexity DNA repeat, CGGGGCCGGGGCCGGGGCCGGG, 2 kb from the 3′ end of DMPK. This sequence has the potential to form a highly stable G-quadruplex (G4 motif; Supplementary Table 2, Motif #3), as determined from a quadruplex prediction program (QGRS Mapper, [Citation45]). Downstream, within the 3′ terminal 1 kb of DMPK, we found two other high-scoring G4 motifs that were also present on the coding strand and matched the sequence G3+N1–7G3+N1–7G3+N1–7G3+ (E & Supplementary Table 2). Using circular dichroism spectroscopy, we previously confirmed that all 15 such motifs identified by this program in a macrosatellite repeat region (the facioscapulohumeral muscular dystrophy-linked D4Z4) or nearby sequences could form G-quadruplexes when tested as oligonucleotides ([Citation46] and unpublished results). In the 30-kb region from SIX5 through DMWD there were 16 such G4 motifs, five of which overlap the long CpG island in this region (Supplementary Figure 1A & B).
Tissue-specific transcription control regions predicted from DNaseI hypersensitivity & histone modification
To look for cis-acting transcription regulatory regions in the vicinity of DMPK, we also used genome-wide DNaseI hypersensitivity profiles (DNase-seq), which identify small regions of open chromatin that frequently overlap cis-acting transcription regulatory elements [Citation29], and histone modification ChIP-seq profiles, which can indicate the presence of active promoters and enhancers [Citation30]. At a tissue-specific DHS, which overlapped DMPK’s exon 4 DMR, DNA methylation was usually inversely associated with the DHS signal overlapping the DMR (Supplementary Figure 1C, black arrow). This association was statistically significant (p = 0.009, Kendall’s tau) in the following sample set for which RRBS and DHS data were available: Mb, Mt, osteoblasts, LCL, HMEC, ESC, IMR-90 (fetal lung fibroblasts), hepatocytes, melanocytes and pancreatic islets. In this MbMt hypermethylated DMR, Mb and Mt had very low levels of histone H3 lysine-4 trimethylation (H3K4me3; D, triangle). LCL and ESC samples, which had low methylation in this region, had much promoter-like H3K4me3 signal but little H3 lysine 27 acetylation (H3K27ac; F, triangle). By chromatin state segmentation analysis based upon histone modification, this region appears to be a weak or poised promoter [Citation30] in LCL and ESC samples and transcription-elongation type chromatin in Mb (D, black bar).
In the 5′ region of the canonical DMPK isoforms, the H3K27ac and the H3K4me3 signals were much stronger for Mb, Mt, skeletal muscle, heart, lung, osteoblasts and NHLF than for most other examined samples and predict an active promoter (D, D & F, dotted lines, and data not shown). In contrast, the promoter regions of DMWD and SIX5 have the histone modifications indicating active promoters in most examined samples (D, D & F). Strong enhancer chromatin (both H3K4me1 and H3K27ac) was seen in Mb, Mt and heart (but not in LCL, ESC, HMEC, brain prefrontal cortex, PBMC or liver samples) in DMWD from its 3′ terminus to exon 3 and over part of the DMWD 3′ UTR in skeletal muscle (D, E & F, boxes). However, many of DMWD’s intragenic hypomethylated CpGs in Mb and Mt were adjacent to, but not within, enhancer chromatin, as determined by chromatin state segmentation (A & D, dotted box).
Myogenesis-associated increases & decreases in binding of CTCF
CTCF can function as a transcription factor, a mediator of chromatin looping and insulator activity, and a modulator of pre-RNA splicing [Citation48]. ENCODE CTCF ChIP-seq profiles (Transcription Factor ChIP-seq with Factorbook Motifs [Citation27,Citation49]) showed that CTCF was bound strongly at the exon 4/intron 3 border in DMPK in LCL and ESC samples but only weakly in Mb and Mt (C, box) and that the binding site was likely a CTCF motif, cGGAGGAGCTGCAGCCg. Reduced binding of CTCF to this region was associated with much methylation at the adjacent DMR in Mb and Mt and with intermediate levels of methylation in osteoblasts, skin fibroblasts and astrocytes as seen by RRBS (B, gray arrows; C & Supplementary Figure 1E, box). In addition, tissue-specific gain of another CTCF site within the 3′ terminus of DMWD and 0.5 kb upstream of the DMPK TSS was observed preferentially in Mb and Mt (C, oval).
A third CTCF site in the DMPK/DMWD/SIX5 region was seen at the 3′ end of DMPK (C, arrowhead). It was present in all studied cell cultures and embedded in a region that displayed enhancer or promoter chromatin (B, arrowhead) and little or no DNA methylation in all examined samples ( & D, arrowhead). The CTCF binding sequence at this ChIP-seq-identified site was CGCCCCCTAGCGGC, as determined by a CTCF binding site prediction program [Citation50], and is consistent with a previous report [Citation19]. The sequence is 60 bp upstream of the CTG repeat and overlaps a DHS seen in all examined cell types (Supplementary Figure 1C, arrowhead). Another CTCF sequence (CCCCACCTATCGTT) that is about 0.25 kb downstream from the first site was previously described [Citation19]. However, it is predicted [Citation50] to be a weaker CTCF binding site, did not show CTCF binding by ChIP-seq and did not overlap a DHS according to ENCODE profiles of Mb and other normal cell cultures [Citation26].
ENCODE profiles of 3D chromatin interactions mediated by CTCF (chromatin interaction analysis by paired-end tag sequencing, ChIA-PET [Citation34]) were available for K562 cells (UCSC Genome Browser [Citation26]). These profiles indicate that the constitutive CTCF site at the 3′ end of DMPK can interact with the tissue-specific CTCF site overlapping the exon 4 DMR in DMPK in K562 cells (Supplementary Figure 2E, red boxes). In addition, the K562 cells’ 3′ DMPK CTCF site appears to be interacting with another strong constitutive CTCF site 17 kb distant within the last intron of the testes-specific RSPH6A gene (Supplementary Figure 2E, blue boxes). The constitutive CTCF site in RSPH6A is in weak enhancer chromatin in examined nonmyogenic cell cultures, including K562, and in strong enhancer chromatin region in Mb and Mt (B, black arrow, and Supplementary Figure 2C).
Other transcription factors associated with myogenic differential DNA methylation
A search in the DMPK and DMWD DMRs for predicted TF binding sites (TFBS) using various ENCODE ChIP-seq profiles (Supplementary Figure 1F, triangles; transcription factor ChIP-seq with Factorbook motifs [Citation27]) revealed possible functional relationships between TF binding and DNA methylation. The TF ChIP-seq data were available for certain nonmyogenic cell types and were supplemented by maps of consensus sequences for TFBS that are conserved between humans and rodents (HMR Conserved Transcription Factor Binding Sites [Citation27]). ESC, LCL and K562 ChIP-seq profiles indicated that ZNF143 binds to the exon 4 DMR of DMPK in these cells although it did not bind in HeLa cells. The ZNF143 consensus site (GCACTTCGCCTTCCAGGATGA) within this binding region contains a CpG with an average methylation level of 95% in Mb and Mt (B, arrow) and 49, 7, 2 and 88%, respectively in ESC, LCL, K562 and HeLa cultures [Citation27]. The ZNF143 site is in a small DHS peak (Supplementary Figure 1C, black arrow) seen preferentially in samples with only a small amount of local methylation, as described above. Clustered at this peak are also predicted human/rodent conserved TFBS for STAT5A and TFAP4, both of which contain CpGs and are located in the MbMt hypermethylated DMR in DMPK. Centered in the main cell type-specific DHS peak in this region (Supplementary Figure 1C, gray triangle), there was a CpG-containing binding site for SP4 (TGGAGGCGGGGCTTG). SP4 ChIP-seq profiles were available for ESC and indicated SP4 binding to this site, which was unmethylated in these cells (ENCODE/BS-seq, data not shown). SP4, STAT5A and TFAP4 genes were expressed in Mb, although at lower steady-state levels than in LCL and ESC samples (RNA-seq, Supplementary Table 3). STAT5A and E2F4 TFs are implicated in regulation of myogenesis [Citation51,Citation52]. STAT5A and SP4 binding has been shown to be inhibited by DNA methylation at their binding motifs [Citation53,Citation54]. Similarly, for the myogenic hypomethylated DMR in DMWD, there are predicted, human/rodent-conserved TFBS containing CpG. These include NFE2L1-MAFG heterodimer, CUX1, REST and TP53, all of which are expressed in Mb (Supplementary Table 3) and so might help establish or maintain the myogenic hypomethylation and/or use the hypomethylation for their recruitment in myogenic cells.
Tissue-specific differences in expression of DMPK isoforms & DMWD associated with tissue-specific epigenetics
Unlike DMWD, which has only one RefSeq and UniProtKB isoform, DMPK encodes seven RefSeq gene isoforms, more than ten UniProtKB protein isoforms, and many more documented RNAs [Citation55]. This multiplicity complicates RNA-seq analysis. Analysis of Cufflinks data (Supplementary Table 1) from non-strand-specific RNA-seq [Citation27,Citation56] indicated higher steady-state levels of DMPK RNA in Mb than in the five examined nonmyogenic cell cultures; Mb signal was the strongest in eight of the 19 DMPK isoforms observed (p = 0.008). In contrast, DMWD had similar RNA levels among the six cell cultures, and much less DMWD RNA than DMPK RNA was in Mb. The main DMPK RNA isoforms observed in Mb were splice variants (NM_004409 and NM_001081562, A, top) that include the same first exon. From ChIP-seq profiles for H3K36me3 (seen in the central and 3′ region of actively transcribed genes) and H3K72me2 (observed in the 5′ region of actively transcribed genes), which reflect rates of relative transcription per se [Citation30,Citation57], there appears to be more transcription throughout the DMPK gene body in the skeletal muscle lineage than in nonmuscle cells, with the exception of osteoblasts (Supplementary Figure 3C). These histone profiles indicated preferential transcription of DMWD in Mb, Mt and osteoblasts but with less tissue specificity than for DMPK.
Strand-specific RNA seq [Citation27] confirmed that most of the RNA signal for DMPK, SIX5 and DMWD corresponded to the sense (minus) strand ( & A, RNA-seq tracks). Only ESC had considerable poly(A)+ antisense (AS) RNA in this region, especially downstream of the 3′ end of DMPK extending into SIX5 (A, RNA-seq [+]). SIX5 itself was expressed mostly in ESC (Supplementary Table 1). Total RNA, rather than just poly(A)+ RNA, from Mb revealed signal in the intergenic region between DMPK and SIX5 (data not shown), which is consistent with a previous report [Citation58]. Examination of ENCODE profiles of 5′ CAGE indicated that there was more 5′ cap signal from the plus strand than from the minus strand at the 3′ end of DMPK in Mb and ESC (A, red bars).
CAGE profiles also showed the frequent cell type specific use of alternative promoters for DMPK. Mb and osteoblasts had predominant transcription initiation at the canonical, upstream TSS for DMPK unlike LCL, skin fibroblast, HMEC, fetal lung fibroblast and ESC samples (D & A, CAGE tracks). This result is likely to be related to evidence for strong binding of the myogenic TF MYOD to the canonical 5′ end of DMPK in Mb and Mt (B), as determined by identifying human/mouse orthologous sequences to strong mouse Mb and Mt binding sites from murine MyoD ChIP-seq profiles [Citation47]. The MyoD ChIP-seq profiles were from murine C2C12 Mb and Mt, and a liftover was used to find the orthologous sequences.
The CAGE data indicative of cell-type specificity in DMPK promoter usage are consistent with the lack of methylation in the canonical upstream promoter region in Mb, Mt and osteoblasts and the hypermethylation of the alternative downstream promoter region in these cell types (B & D). Conversely, high methylation of the upstream promoter region specifically in LCL and ESC samples and low methylation of the downstream promoter in these cell types corresponds with their predominant use of the downstream, CpG island-containing promoter. Consistent with the use of both promoter regions in skin fibroblasts, they had an intermediate level of methylation of the downstream promoter region and no methylation at the upstream promoter. HMEC with little DNA methylation at both promoter regions but much at an intermediate position, displayed only low levels of specific initiation at the downstream promoter and none at the upstream promoter (), indicating, not surprisingly, that lack of methylation at the DMPK upstream promoter was not sufficient for it to be turned on.
Discussion
This study is the first reported epigenetic analysis of DMPK that was not restricted to its 3′ terminus where the DM1-associated trinucleotide repeat resides. Our results offer novel insights into the complexity of tissue-specific regulation of this gene and evidence that three neighboring genes as well as DMPK itself contribute to male-specific [Citation15] disease features of this muscular dystrophy. DMPK is expressed at high levels in skeletal muscle and heart and lower levels in various other tissues [Citation13,Citation59]. Understanding the epigenetic factors that determine expression levels in different cell types should help elucidate the varied, but tissue-specific, manifestations of the disease and the tissue-specific factors governing further DMPK trinucleotide repeat expansion [Citation15] in individuals inheriting an expanded DMPK repeat. Here, in the first comparison of Mb, Mt and many types of nonmyogenic cell cultures, we found significantly higher expression in Mb than in LCL, NHEK, NHLF, ESC and HUVEC samples (Supplementary Table 1). However, there was also high expression in osteoblasts and skin fibroblasts ( & Supplementary Figure 3C), which might be related to the occasional bone and skin symptoms of DM1 [Citation60,Citation61]. In addition, we newly report G4 motifs in the vicinity of the CTG repeats of DMPK that may contribute to the pathogenicity and the germline or somatic expansion of these repeats, as described below.
We observed cell type dependent differences in promoter usage and corresponding epigenetic features. DMPK transcription in LCL and ESC samples used mostly a noncanonical, downstream promoter, which had low levels of DNA methylation, rather than the canonical upstream promoter, which was highly methylated (, circles). For Mb and osteoblasts, the situation was reversed. Use of the canonical promoter was associated with higher overall levels of expression. The data suggest that cell type specific DNA differential methylation in alternative promoter regions in conjunction with specific TF binding (e.g., of MYOD, B) is helping to regulate which of these promoters is used for DMPK transcription and thereby changing the primary structure and relative levels of the resulting polypeptide products. The downstream promoter might give rise to isoforms such as NM_00128875, which is predicted to encode an in-phase polypeptide that retains most of the N-terminal protein kinase domain (UCSC Genome Browser, UniProt Structure; [Citation27]). We found that the little-studied, downstream-promoter DMR of DMPK displays cell type specific binding to ZNF143, a transcription factor associated with CTCF chromatin looping sites at promoter and enhancer regions [Citation62]. The ZNF143 consensus sequence in the binding region has a CpG and is only ~80 bp from a constitutive CTCF binding site, which suggests that differential methylation may modulate tissue-specific promoter usage in DMPK partly by altering the chromatin conformation. Understanding the regulation of DMPK promoter usage is relevant to DM1. Some of the many isoforms of DMPK RNA [Citation55,Citation63] might be pathogenic if they contain an expanded DM1 trinucleotide repeat even if they do not encode an active kinase.
DMWD/Dmwd, the 5′ gene neighbor to DMPK/Dmpk in humans and rodents, has an unknown function. The mouse gene is expressed at the highest levels in testis and secondarily in brain and, at low levels in most other tissues (including skeletal muscle) [Citation13]. It has little or no expression in ovary. Histone modification profiles indicated some preferential expression in human skeletal muscle and heart (Supplementary Figure 3C). We found that the 3′ UTR of DMWD (which is 0.5 kb upstream to the DMPK TSS) or the exon 3/intron 3 region of this gene exhibit low DNA methylation and display overlapping or adjacent enhancer chromatin in Mb, Mt, skeletal muscle and heart but not in LCL, ESC, PBMC and liver samples (, & ). Storbeck et al. demonstrated that the promoter activity of the region from 0.9 kb upstream of the canonical DMPK TSS (within the 3′ end of DMWD) to 0.2 kb downstream is weak and not stronger in myogenic than in nonmyogenic cell cultures upon transient transfection using reporter-gene constructs [Citation18]. However, they found preferential expression of the reporter gene in myogenic cells when an extra 1.3 kb from the 3′ end of DMWD is included in the insert driving reporter gene expression. Based on their and our observations, we propose that there is a methylation-sensitive tissue-specific enhancer at the 3′ end of DMWD that preferentially upregulates the adjacent DMPK promoter () and, to a lesser extent, the more distant DMWD promoter in Mb, Mt, skeletal muscle and heart. Reciprocally, DMPKcis-acting regulatory elements might fine-tune DMWD expression.
In most of the DMPK intron 1 region, skeletal and cardiac muscle exhibited low DNA methylation and strong enhancer chromatin or promoter chromatin (which also sometimes indicates enhancer activity [Citation65]; & ). Intron 1 was previously shown to function as a myogenic and cardiac enhancer [Citation18]. As inferred from mouse MyoD ChIP-seq (B) [Citation47], MYOD binding to this intron at orthologous human DNA sequences is strong in Mb and Mt. Because the skeletal muscle lineage-specific MYOD TF is absent from heart, this tissue should be using some cardiac-specific transcription factor(s) to direct enhancer activity to DMPK intron 1.
The 3′ terminus of DMPK contains the DM1-linked CTG repeat and is only 0.4 kb from the 5′ end of SIX5. It is located in a long, constitutively unmethylated DNA sequence that occupies most of a CpG island. The last exon of DMPK overlaps strong enhancer chromatin specifically in Mb and Mt ( & ). CTCF binding sites that flank each side of this exon’s CTG repeat were previously identified by in vitro assays with nuclear extracts [Citation19]. Cho et al. hypothesized that these two sites act as insulators in normal cells and, due to local DNA hypermethylation in DM1 cells [Citation66], have decreased insulator activity in patients’ cells. They proposed that this hypermethylation may contribute to the DM1 pathology [Citation19,Citation58]. In a comparison of DM1 and control fibroblasts, it was found that at the upstream (stronger) CTCF site, H3K9me3 signal is higher in the dystrophic cells while the local H3K4me3 signal is lower in these cells [Citation58]. We found evidence from epigenetic profiles of many nondisease cell types (including Mb and Mt) that only the upstream site detectably binds CTCF in vivo, and both sites reside in either strong enhancer or active promoter chromatin. Given the association of CTCF binding with positively regulating transcription when it binds to enhancer or promoter chromatin regions [Citation30,Citation67], we suggest that CTCF bound at the 3′ end of DMPK near the CTG repeat is unlikely to be acting as an insulator in normal postnatal cells.
Further from DMPK, in the RSPH6A gene body, there was strong enhancer chromatin seen preferentially in Mb versus nonmyogenic cell cultures ( & ). RSPH6A expression is highly specific for testis [Citation43]. Besides DMPK and, to a lesser extent, DMWD there are no other genes in the neighborhood of RSPH6A that are expressed preferentially in the skeletal muscle lineage. Therefore, the skeletal muscle-associated strong enhancer chromatin in the DMPK-proximal end of RSPH6A might contribute to the myogenic upregulation of DMPK (). Consistent with this hypothesis, CTCF ChIA-PET profiles (Supplementary Figure 2E) indicate interactions can occur between the CTG repeat containing 3′ end of DMPK and the myogenic enhancer region of RSPH6A or the downstream promoter of DMPK.
Eriksson et al. postulated that cis effects of DMPK CTG repeat expansion in DM1 might include abnormal regulation in testis of the testis-specific RSPH6A contributing to DM1-linked male infertility [Citation68]. RSPH6A is only 13 kb upstream of DMPK and encodes a ciliary-type protein. We found that the promoter region of RSPH6A was hypomethylated in sperm and ESC. Furthermore, BHMG1, another testis-specific gene, which is located only 5 kb downstream of DMPK, was also hypomethylated in its promoter region as well as at a far-upstream region in sperm and testis. BHMG1, which may encode a TF [Citation43], is expressed specifically in testis [Citation43]. Although broadly expressed, murine Dmwd has higher steady-state levels of RNA in testis than in other tissues, including skeletal muscle [Citation12,Citation64]. This suggests that DMPK is embedded in the middle of a chromosomal domain with three genes preferentially expressed in testis (). Furthermore, we found that DMPK itself has a region with sperm/testis-specific hypomethylation only 0.9 kb from the CTG repeat in the 3′ UTR. DMPK expression in testis is low but higher than in some other nonmuscle tissues, including ovary, according to northern blots [Citation59], and DMPK RNA has been detected in spermatogenic, Sertoli and Leydig cells of normal mouse testis but not in mouse ovary [Citation13].
In the 1980s, we first described a disparate class of DNA sequences with sperm-specific DNA hypomethylation that often contain short tandem oligonucleotide repeats [Citation69]. We found such a repeat 2 kb from the 3′ end of DMPK in its sperm-hypomethylated region (GGGGCCGGGGCCGGGGCCGGG). It has four clustered runs of G3 (G4 motifs) and is predicted [Citation45] to be able to form stable G-quadruplexes in the single-stranded conformation (Supplementary Table 2). Further downstream in the 3′ end of DMPK, two additional strong G4 motifs were found on the coding strand, one of which is within the 3′ UTR and only 45 nt from the CTG repeat (E). G-quadruplexes are a set of distinctive non-B DNA conformations involving G-G Hoogsteen intrastrand base pairing. [Citation70]. A survey of the human genome indicated that the frequency of such strong G4 motifs (G3+N1–7G3+N1–7G3+N1–7G3+) in 3′ UTRs is 0.12–0.15 per kb [Citation71]. We propose that the proximity of G4 motifs to the expanded trinucleotide repeat in DM1 patients is clinically relevant. G-quadruplexes can form in regions of single-stranded DNA during transcription or DNA replication and impede replication if not resolved by G4-specific DNA helicases [Citation70,Citation72]. Somatic DNA rearrangement breakpoints in cancers have a very strong association with G4 motifs in regions that are abnormally hypomethylated, although G4 motifs are generally in regions enriched in DNA methylation in normal tissues [Citation73]. The 3′ DMPK region exhibiting sperm-specific DNA hypomethylation and a G4 motif might be partly responsible for the frequent male germline-linked expansion of intermediate-length CTG repeats at the DMPK 3′ UTR to large, classical DM1-type expansions [Citation15].
The G4 motifs on the coding strand at the 3′ end of DMPK, especially the one within the CTG-repeat-containing 3′UTR, might cooperate with expanded CTG (CUG) repeats to play additional roles in the pathogenesis of DM1 at both the DNA and RNA levels. The myotonia, myopathy and mutant RNA-containing nuclear foci of DM1 are reproduced in transgenic mice that have a transgene containing expanded CTG repeats removed from their normal human DNA sequence context [Citation74]. However, inclusion of human DNA sequences surrounding the repeats gives a more consistent DM1-like pathophysiology [Citation75]. Therefore, DNA sequence and epigenetic features of the 3′ DMPK region [Citation58,Citation76], in which the repeat is located, may modulate pathogenicity. For example, in transgenic DM1 mouse models, CTG repeat expansion is favored by including not just the repeats but also surrounding sequences from the human genome in the transgene [Citation77]. The G4 motifs in the large CpG island in which the DMPK CTG repeats reside could contribute to the high intergenerational instability of CTG repeats in DMPK [Citation70,Citation78]. Furthermore, G4 motifs in RNA within expanded GGGGCC repeats in intron 1 of C9orf72 in patients with frontotemporal dementia/amyotrophic lateral sclerosis are implicated in the abnormal binding of nuclear proteins, nuclear RNA foci formation and abnormal translation [Citation72]. FMR1, the gene linked to the fragile X syndrome, encodes a G-quadruplex-binding protein, and the syndrome is due to amplification of CCG repeats that are prone to G-quadruplex formation [Citation72]. Although the G4 motifs in the DMPK gene’s 3′ CpG island are only near, and not within the repeat, we hypothesize that these motifs in DMPK exacerbate the consequences of the CTG (CUG) repeat expansion and that, at the DNA level, their effects may be modulated by the methylation status of surrounding sequences.
Conclusion
This study of the myotonic dystrophy type 1-linked DMPK gene demonstrates a complex pattern of tissue-specific epigenetics consistent with evidence that normal tissues require careful regulation of DMPK RNA and protein levels [Citation7]. As our analysis indicates, this regulation might include cis-acting regulatory elements in dissimilar neighboring genes, such as a muscle-specific enhancer for muscle-related upregulation of DMPK in the testis-specific RSPH6A gene. The tissue-specific epigenetics of DMPK that we have described is consistent with the importance of this gene to myoblast differentiation [Citation3], insulin signaling in skeletal and cardiac muscles [Citation4], regulation of ion channels in skeletal muscle [Citation7,Citation23], cardiac conduction [Citation9], and with the much higher levels of DMPK protein in heart and skeletal muscle relative to most other tissues [Citation79]. Last, the tissue-specific epigenetics in and around DMPK and the G-quadruplex motifs near the DM1-linked CTG repeat at the 3′ end of DMPK are likely to be important in understanding disease mechanisms for this highly lethal and debilitating disease.
Future perspective
Promising molecular genetics-based therapies for myotonic dystrophy type 1 are being developed and tested that usually involve counteracting toxic mutant DMPK RNA containing pathogenic expansions of the CTG repeat or ameliorating the downstream effects of this RNA. Our findings help elucidate the tissue-specific regulation of DMPK transcription and indicate the need for future studies to compare the N-termini of DMPK protein isoforms in myoblasts, myotubes and nonmuscle cell cultures. They also extend our understanding of how multiple organ systems are affected by DM1, especially in patients with very large disease-associated expansions of the CTG repeat in the 3′ end of DMPK.
In addition, our discovery of potential G-quadruplex sequences (G4 motifs, containing four runs of G residues) near the (CTG) (CAG) repeats in the 3′ UTR of DMPK opens a new avenue of research on G-quadruplexes and DNA repeat diseases. Previously, the disease relevance of G4 motifs to repeat diseases has been studied extensively only for diseases like frontotemporal dementia/amyotrophic lateral sclerosis and the fragile X syndrome, diseases in which the G4 motifs are within the oligonucleotide repeats. Here we propose that the G4 motifs near, but not within, the DM1-linked repeats of DMPK assume unusual DNA conformations during transcription and DNA replication and thereby contribute to the disease-causing trinucleotide repeat expansion and to the toxicity of DMPK RNA containing expanded CUG repeats. The possible synergy of G4 motifs and nearby oligonucleotide repeats on the genome stability and on disease-associated RNA toxicity should be examined.
DMPK, whose 3′ CTG repeat becomes expanded in myotonic dystrophy type 1 is preferentially expressed in myoblasts (Mb) and myotubes (Mt) versus many nonmuscle cell cultures.
This preferential expression is linked to predominant use of the upstream promoter, which has unmethylated DNA in Mb and Mt, rather than a downstream promoter, which is highly methylated in these cells.
The opposite DNA methylation pattern and promoter usage is seen for lymphoblastoid cells and for embryonic stem cell cultures.
Myogenic hypermethylation at the downstream promoter of DMPK is associated with strong decreases in CTCF binding and DNaseI hypersensitivity at this promoter but increases in CTCF binding at the 3′ end of DMWD, which is close to the 5′ end of DMPK.
DMWD, the neighboring gene of uncertain function, has a hypomethylated DNA region in its cell body and adjacent enhancer chromatin that is seen specifically in Mb, Mt and skeletal muscle tissue; this potential enhancer might help upregulate the adjacent DMPK gene in a tissue-specific manner.
RSPH6A and BHMG1, testis-specific genes on either side of DMPK, display sperm/testis-specific DNA hypomethylation.
The testis expression and epigenetic associations of RSPH6A and BHMG1, which surround DMPK, along with a 0.8-kb region of sperm-specific DNA hypomethylation near the myotonic dystrophy-associated CTG repeat in DMPK suggest that this gene is in a neighborhood with specific chromatin structure in the male germline.
A G-quadruplex motif (capable of assuming a non-B DNA intrastrand conformation) that is located only 45 nt from the CTG repeat on the coding strand may predispose the DNA to repeat expansions and, at the RNA level, may contribute to the pathogenicity of the toxic RNA.
Supplemental document 1
Download MS Word (173.7 KB)Supplemental table 2
Download MS Excel (13.8 KB)Supplemental table 3
Download MS Excel (11.6 KB)Supplemental table 4
Download MS Excel (17.3 KB)Acknowledgements
The authors thank M Badoo and the Tulane Cancer Center (COBRE grant NIGMS P20GM103518) for help with the Cufflinks analysis of the ENCODE RNA-seq data.
To view the supplementary data that accompany this paperplease visit thejournal website at: www.tandfonline.com/doi/full/10.2217/epi.15.104
Financial & competing interests disclosure
This research was supported in part by a grant from the NIH to M Ehrlich (NS04885). The authors have no other relevant affiliations or financial involvement with any organization or entity with a financial interest in or financial conflict with the subject matter or materials discussed in the manuscript apart from those disclosed.
No writing assistance was utilized in the production of this manuscript.
Additional information
Funding
References
- Reddy S , SmithDB , RichMMet al. Mice lacking the myotonic dystrophy protein kinase develop a late onset progressive myopathy . Nat. Genet.13 ( 3 ), 325 – 335 ( 1996 ).
- Schulz PE , McIntoshAD , KastenMR , WieringaB , EpsteinHF . A role for myotonic dystrophy protein kinase in synaptic plasticity . J. Neurophysiol.89 ( 3 ), 1177 – 1186 ( 2003 ).
- Harmon EB , HarmonML , LarsenTD , PaulsonAF , PerrymanMB . Myotonic dystrophy protein kinase is expressed in embryonic myocytes and is required for myotube formation . Dev. Dyn.237 ( 9 ), 2353 – 2366 ( 2008 ).
- Llagostera E , CatalucciD , MartiLet al. Role of myotonic dystrophy protein kinase (DMPK) in glucose homeostasis and muscle insulin action . PLoS ONE2 ( 11 ), e1134 ( 2007 ).
- Pantic B , TrevisanE , CittaAet al. Myotonic dystrophy protein kinase (DMPK) prevents ROS-induced cell death by assembling a hexokinase II-Src complex on the mitochondrial surface . Cell Death Dis.4 ( e858 ( 2013 ).
- Benders AA , GroenenPJ , OerlemansFT , VeerkampJH , WieringaB . Myotonic dystrophy protein kinase is involved in the modulation of the Ca2+ homeostasis in skeletal muscle cells . J. Clin. Invest.100 ( 6 ), 1440 – 1447 ( 1997 ).
- Mounsey JP , MistryDJ , AiCW , ReddyS , MoormanJR . Skeletal muscle sodium channel gating in mice deficient in myotonic dystrophy protein kinase . Hum. Mol. Genet.9 ( 15 ), 2313 – 2320 ( 2000 ).
- Bush EW , TaftCS , MeixellGE , PerrymanMB . Overexpression of myotonic dystrophy kinase in BC3H1 cells induces the skeletal muscle phenotype . J. Biol. Chem.271 ( 1 ), 548 – 552 ( 1996 ).
- Llagostera E , AlvarezLopez MJ , ScimiaCet al. Altered beta-adrenergic response in mice lacking myotonic dystrophy protein kinase . Muscle Nerve45 ( 1 ), 128 – 130 ( 2012 ).
- Berul CI , MaguireCT , AronovitzMJet al. DMPK dosage alterations result in atrioventricular conduction abnormalities in a mouse myotonic dystrophy model . J. Clin. Invest.103 ( 4 ), R1 – R7 ( 1999 ).
- Pham YC , ManN , LamLT , MorrisGE . Localization of myotonic dystrophy protein kinase in human and rabbit tissues using a new panel of monoclonal antibodies . Hum. Mol. Genet.7 ( 12 ), 1957 – 1965 ( 1998 ).
- Jansen G , MahadevanM , AmemiyaCet al. Characterization of the myotonic dystrophy region predicts multiple protein isoform-encoding mRNAs . Nat. Genet.1 ( 4 ), 261 – 266 ( 1992 ).
- Sarkar PS , HanJ , ReddyS . In situ hybridization analysis of Dmpk mRNA in adult mouse tissues . Neuromuscul. Disord.14 ( 8–9 ), 497 – 506 ( 2004 ).
- Oude Ophuis RJ , MuldersSA , Van HerpenRE , VanDe Vorstenbosch R , WieringaB , WansinkDG . DMPK protein isoforms are differentially expressed in myogenic and neural cell lineages . Muscle Nerve40 ( 4 ), 545 – 555 ( 2009 ).
- Thornton CA . Myotonic dystrophy . Neurol. Clin.32 ( 3 ), 705 – 719 ( 2014 ).
- Chau A , KalsotraA . Developmental insights into the pathology of and therapeutic strategies for DM1: back to the basics . Dev. Dyn.244 ( 3 ), 377 – 390 ( 2015 ).
- Gomes-Pereira M , CooperTA , GourdonG . Myotonic dystrophy mouse models: towards rational therapy development . Trends Mol. Med.17 ( 9 ), 506 – 517 ( 2011 ).
- Storbeck CJ , SabourinLA , WaringJD , KornelukRG . Definition of regulatory sequence elements in the promoter region and the first intron of the myotonic dystrophy protein kinase gene . J. Biol. Chem.273 ( 15 ), 9139 – 9147 ( 1998 ).
- Filippova GN , ThienesCP , PennBHet al. CTCF-binding sites flank CTG/CAG repeats and form a methylation-sensitive insulator at the DM1 locus . Nat. Genet.28 ( 4 ), 335 – 343 ( 2001 ).
- Harmon EB , HarmonML , LarsenTD , YangJ , GlasfordJW , PerrymanMB . Myotonic dystrophy protein kinase is critical for nuclear envelope integrity . J. Biol. Chem.286 ( 46 ), 40296 – 40306 ( 2011 ).
- Moncaut N , RigbyPW , CarvajalJJ . Dial M(RF) for myogenesis . FEBS J.280 ( 17 ), 3980 – 3990 ( 2013 ).
- Jansen G , GroenenP J , BachnerDet al. Abnormal myotonic dystrophy protein kinase levels produce only mild myopathy in mice . Nat. Genet.13 ( 3 ), 316 – 324 ( 1996 ).
- Franke C , HattH , IaizzoPA , Lehmann-HornF . Characteristics of Na+ channels and Cl- conductance in resealed muscle fibre segments from patients with myotonic dystrophy . J. Physiol.425 , 391 – 405 ( 1990 ).
- Varley KE , GertzJ , BowlingKMet al. Dynamic DNA methylation across diverse human cell lines and tissues . Genome Res.23 ( 3 ), 555 – 567 ( 2013 ).
- Tsumagari K , BaribaultC , TerragniJet al. Early de novo DNA methylation and prolonged demethylation in the muscle lineage . Epigenetics8 ( 3 ), 317 – 332 ( 2013 ).
- UCSC Genome Bioinformatics . http://genome.ucsc.edu/ .
- Rosenbloom KR , ArmstrongJ , BarberGPet al. The UCSC Genome Browser database: 2015 update . Nucleic Acids Res.43 ( database issue ), D670 – D681 ( 2015 ).
- Myers RM , StamatoyannopoulosJ , SnyderMet al. A user’s guide to the encyclopedia of DNA elements (ENCODE) . PLoS Biol.9 ( 4 ), e1001046 ( 2011 ).
- Song L , ZhangZ , GrasfederLLet al. Open chromatin defined by DNaseI and FAIRE identifies regulatory elements that shape cell-type identity . Genome Res.21 ( 10 ), 1757 – 1767 ( 2011 ).
- Ernst J , KheradpourP , MikkelsenTSet al. Mapping and analysis of chromatin state dynamics in nine human cell types . Nature473 ( 7345 ), 43 – 49 ( 2011 ).
- Trapnell C , WilliamsBA , PerteaGet al. Transcript assembly and quantification by RNA-Seq reveals unannotated transcripts and isoform switching during cell differentiation . Nat. Biotechnol.28 ( 5 ), 511 – 515 ( 2010 ).
- Jiang L , SchlesingerF , DavisCAet al. Synthetic spike-in standards for RNA-seq experiments . Genome Res.21 ( 9 ), 1543 – 1551 ( 2011 ).
- Valen E , PascarellaG , ChalkAet al. Genome-wide detection and analysis of hippocampus core promoters using DeepCAGE . Genome Res.19 ( 2 ), 255 – 265 ( 2009 ).
- Li G , FullwoodMJ , XuHet al. ChIA-PET tool for comprehensive chromatin interaction analysis with paired-end tag sequencing . Genome Biol.11 ( 2 ), R22 ( 2010 ).
- Trapnell C , RobertsA , GoffLet al. Differential gene and transcript expression analysis of RNA-seq experiments with TopHat and Cufflinks . Nat. Protoc.7 ( 3 ), 562 – 578 ( 2012 ).
- Epigenome Browser . http://epigenomebrowser.org .
- Zhou X , WangT . Using the Wash U Epigenome Browser to examine genome-wide sequencing data . Curr. Protoc. Bioinformatics. doi:10.1002/0471250953.bi1010s40 ( 2012 ) ( Epub ahead of print ).
- Lacey M R , BaribaultC , EhrlichM . Modeling, simulation and analysis of methylation profiles from reduced representation bisulfite sequencing experiments . Stat. Appl. Genet. Mol. Biol.12 ( 6 ), 723 – 742 ( 2013 ).
- Song Q , DecatoB , HongEEet al. A reference methylome database and analysis pipeline to facilitate integrative and comparative epigenomics . PLoS ONE8 ( 12 ), e81148 ( 2013 ).
- Meissner A , MikkelsenTS , GuHet al. Genome-scale DNA methylation maps of pluripotent and differentiated cells . Nature454 ( 7205 ), 766 – 770 ( 2008 ).
- Carvajal JJ , RigbyPW . Regulation of gene expression in vertebrate skeletal muscle . Exp. Cell Res.316 ( 18 ), 3014 – 3018 ( 2010 ).
- Chandra S , TerragniJ , ZhangGet al. Tissue-specific epigenetics in gene neighborhoods: myogenic transcription factor genes . Hum. Mol. Genet. doi:10.1093/hmg/ddv198 ( 2015 ) ( Epub ahead of print ).
- GeneCards: The Human Gene Database . www.genecards.org/ .
- Pohl AA , SugnetCW , ClarkTA , SmithK , FujitaPA , ClineMS . Affy exon tissues: exon levels in normal tissues in human, mouse and rat . Bioinformatics25 ( 18 ), 2442 – 2443 ( 2009 ).
- Kikin O , D’antonioL , BaggaPS . QGRS Mapper: a web-based server for predicting G-quadruplexes in nucleotide sequences . Nucleic Acids Res.34 ( Web Server issue ), W676 – W682 ( 2006 ).
- Tsumagari K , QiL , JacksonKet al. Epigenetics of a tandem DNA repeat: chromatin DNaseI sensitivity and opposite methylation changes in cancers . Nucleic Acids Res.36 ( 7 ), 2196 – 2207 ( 2008 ).
- Cao Y , YaoZ , SarkarDet al. Genome-wide MyoD binding in skeletal muscle cells: a potential for broad cellular reprogramming . Dev. Cell18 ( 4 ), 662 – 674 ( 2010 ).
- Marshall AD , BaileyCG , RaskoJE . CTCF and BORIS in genome regulation and cancer . Curr. Opin. Genet. Dev.24 , 8 – 15 ( 2014 ).
- Wang J , ZhuangJ , IyerSet al. Factorbook.org: a Wiki-based database for transcription factor-binding data generated by the ENCODE consortium . Nucleic Acids Res.41 ( Database issue ), D171 – D176 ( 2013 ).
- Ziebarth JD , BhattacharyaA , CuiY . CTCFBSDB 2.0: a database for CTCF-binding sites and genome organization . Nucleic Acids Res.41 ( Database issue ), D188 – D194 ( 2013 ).
- Klover P , ChenW , ZhuBM , HennighausenL . Skeletal muscle growth and fiber composition in mice are regulated through the transcription factors STAT5a/b: linking growth hormone to the androgen receptor . FASEB J.23 ( 9 ), 3140 – 3148 ( 2009 ).
- Parakati R , DimarioJX . Dynamic transcriptional regulatory complexes, including E2F4, p107, p130, and Sp1, control fibroblast growth factor receptor 1 gene expression during myogenesis . J. Biol. Chem.280 ( 22 ), 21284 – 21294 ( 2005 ).
- Tsuji-Takayama K , SuzukiM , YamamotoMet al. The production of IL-10 by human regulatory T cells is enhanced by IL-2 through a STAT5-responsive intronic enhancer in the IL-10 locus . J. Immunol.181 ( 6 ), 3897 – 3905 ( 2008 ).
- Le Francois B , SooJ , MillarAMet al. Chronic mild stress and antidepressant treatment alter 5-HT1A receptor expression by modifying DNA methylation of a conserved Sp4 site . Neurobiol. Dis. doi:10.1016/j.nbd.2015.07.002 ( 2015 ) ( Epub ahead of print ).
- Thierry-Mieg D , Thierry-MiegJ . AceView: a comprehensive cDNA-supported gene and transcripts annotation . Genome Biol.7 ( Suppl 1, S12 ), 11 – 14 ( 2006 ).
- Terragni J , ZhangG , SunZet al. Notch signaling genes: myogenic DNA hypomethylation and 5-hydroxymethylcytosine . Epigenetics9 ( 6 ), 842 – 850 ( 2014 ).
- Steger D J , LefterovaM I , YingLet al. DOT1L/KMT4 recruitment and H3K79 methylation are ubiquitously coupled with gene transcription in mammalian cells . Mol. Cell. Biol.28 ( 8 ), 2825 – 2839 ( 2008 ).
- Cho DH , ThienesCP , MahoneySE , AnalauE , FilippovaGN , TapscottSJ . Antisense transcription and heterochromatin at the DM1 CTG repeats are constrained by CTCF . Mol. Cell20 ( 3 ), 483 – 489 ( 2005 ).
- Jansen G , BachnerD , CoerwinkelM , WormskampN , HameisterH , WieringaB . Structural organization and developmental expression pattern of the mouse WD-repeat gene DMR-N9 immediately upstream of the myotonic dystrophy locus . Hum. Mol. Genet.4 ( 5 ), 843 – 852 ( 1995 ).
- Som PM , RothschildMA , SilversAR , NortonKI . A painless retroauricular mass in a patient with myotonic dystrophy: computed tomographic documentation of the bone changes that occur in the skull base . Skull Base Surg.7 ( 4 ), 223 – 225 ( 1997 ).
- Campanati A , GiannoniM , BurattiLet al. Skin features in myotonic dystrophy type 1: an observational study . Neuromuscul. Disord.25 ( 5 ), 409 – 413 ( 2015 ).
- Bailey SD , ZhangX , DesaiKet al. ZNF143 provides sequence specificity to secure chromatin interactions at gene promoters . Nat. Commun.2 , 6186 ( 2015 ).
- Groenen PJ , WansinkDG , CoerwinkelM , VanDen Broek W , JansenG , WieringaB . Constitutive and regulated modes of splicing produce six major myotonic dystrophy protein kinase (DMPK) isoforms with distinct properties . Hum. Mol. Genet.9 ( 4 ), 605 – 616 ( 2000 ).
- Eriksson M , AnsvedT , EdstromLet al. Independent regulation of the myotonic dystrophy 1 locus genes postnatally and during adult skeletal muscle regeneration . J. Biol. Chem.275 ( 26 ), 19964 – 19969 ( 2000 ).
- Pekowska A , BenoukrafT , Zacarias-CabezaJet al. H3K4 tri-methylation provides an epigenetic signature of active enhancers . EMBO J.30 ( 20 ), 4198 – 4210 ( 2011 ).
- Lopez Castel A , NakamoriM , TomeSet al. Expanded CTG repeat demarcates a boundary for abnormal CpG methylation in myotonic dystrophy patient tissues . Hum. Mol. Genet.20 ( 1 ), 1 – 15 ( 2011 ).
- Dubois-Chevalier J , OgerF , DehondtHet al. A dynamic CTCF chromatin binding landscape promotes DNA hydroxymethylation and transcriptional induction of adipocyte differentiation . Nucleic Acids Res.42 ( 17 ), 10943 – 10959 ( 2014 ).
- Eriksson M , AnsvedT , AnvretM , CareyN . A mammalian radial spokehead-like gene, RSHL1, at the myotonic dystrophy-1 locus . Biochem. Biophys. Res. Commun.281 ( 4 ), 835 – 841 ( 2001 ).
- Zhang XY , LoflinPT , GehrkeCW , AndrewsP A , EhrlichM . Hypermethylation of human DNA sequences in embryonal carcinoma cells and somatic tissues but not in sperm . Nucleic Acids Res.15 ( 22 ), 9429 – 9449 ( 1987 ).
- Maizels N , GrayLT . The G4 genome . PLoS Genet.9 ( 4 ), e1003468 ( 2013 ).
- Huppert J L , BugautA , KumariS , BalasubramanianS . G-quadruplexes: the beginning and end of UTRs . Nucleic Acids Res.36 ( 19 ), 6260 – 6268 ( 2008 ).
- Simone R , FrattaP , NeidleS , ParkinsonGN , IsaacsAM . G-quadruplexes: emerging roles in neurodegenerative diseases and the non-coding transcriptome . FEBS Lett.589 ( 14 ), 1653 – 1668 ( 2015 ).
- De S , MichorF . DNA secondary structures and epigenetic determinants of cancer genome evolution . Nat. Struct. Mol. Biol.18 ( 8 ), 950 – 955 ( 2011 ).
- Mankodi A , LogigianE , CallahanLet al. Myotonic dystrophy in transgenic mice expressing an expanded CUG repeat . Science289 ( 5485 ), 1769 – 1773 ( 2000 ).
- Dansithong W , WolfCM , SarkarPet al. Cytoplasmic CUG RNA foci are insufficient to elicit key DM1 features . PLoS ONE3 ( 12 ), e3968 ( 2008 ).
- Brouwer JR , HuguetA , NicoleA , MunnichA , GourdonG . Transcriptionally repressive chromatin remodelling and CpG methylation in the presence of expanded CTG-repeats at the DM1 Locus . J. Nucleic Acids2013 , 567435 ( 2013 ).
- Seznec H , Lia-BaldiniAS , DurosCet al. Transgenic mice carrying large human genomic sequences with expanded CTG repeat mimic closely the DM CTG repeat intergenerational and somatic instability . Hum. Mol. Genet.9 ( 8 ), 1185 – 1194 ( 2000 ).
- Brock G J , AndersonNH , MoncktonDG . Cis-acting modifiers of expanded CAG/CTG triplet repeat expandability: associations with flanking GC content and proximity to CpG islands . Hum. Mol. Genet.8 ( 6 ), 1061 – 1067 ( 1999 ).
- Lam LT , PhamYC , NguyenTM , MorrisGE . Characterization of a monoclonal antibody panel shows that the myotonic dystrophy protein kinase, DMPK, is expressed almost exclusively in muscle and heart . Hum. Mol. Genet.9 ( 14 ), 2167 – 2173 ( 2000 ).