
Abstract
Background: Tumor epigenetic defects are of increasing relevance to clinical practice, because they are ‘druggable’ targets for cancer therapy using chromatin-remodeling agents (CRAs). New evidences highlight the importance of the microenvironment on the epigenome regulation and the need to use culture models able to preserve tissue morphology, to better understand the action of CRAs. Methods & methods: We studied the epigenetic response induced by culturing and CRAs in a preclinical model, preserving ex vivo the original tissue microenvironment and morphology, assessing different epigenetic signatures. Our overall findings suggest that culturing and CRAs cause heterogeneous effects on the genes methylation; CRAs affect the global DNA methylation and can trigger an active DNA demethylation; the culture induces alterations in the histone deacetylase expression. Conclusion: Despite the limited number of cases, these findings can be considered a proof of concept of the possibility to test CRAs epigenetic effects on ex vivo tissues maintained in their native tissue architecture.
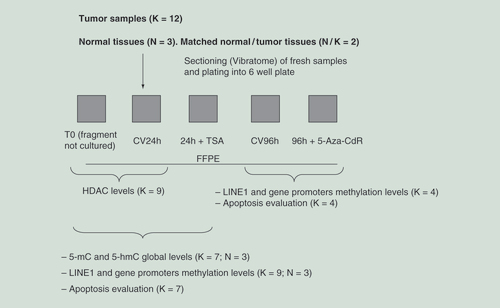
5-Aza-CdR: 5-aza-2′deoxycytidine; 5-mC: 5-methylcytosine; 5-hmC: 5-hydroxymethylcytosine; CV: Control vehicle; FFPE: Formalin-fixed, paraffin-embedded; TSA: Trichostatin A.
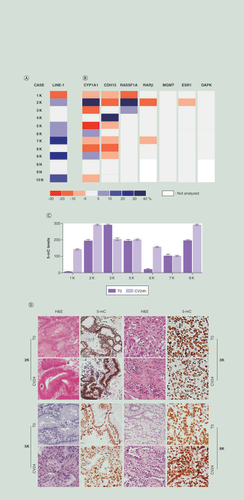
(A & B) Differences of methylation levels observed in LINE1 (A) and gene promoters (B) in neoplastic (1–9K) and non-neoplastic (6,9 and 13N) tissues obtained from lung surgery after 24 h (CV24) of organotypic culture. All CV24 samples were compared with uncultured tissues (T0). The boxes represent the differences of methylation expressed as percentages. The color scale is defined in the bottom. Methylation differences exceeding ±5% were considered informative. (C & D) 5-mC levels by immunohistochemistry observed at T0 and CV24. (C) Global methylation changes in CV24 compared with T0. Results were scored by multiplying the percentage of positive cells (0–100%) for the staining intensity (scale of 0-absent staining to 3-strong staining). Maximum value = 300. Bars represent mean ± standard error of the mean. (D) Representative images of four cases stained with H&E and a 5-mC antibody.
Original magnification: ×200.
5-mC: 5-methylcytosine; H&E: Hematoxylin and Eosin.
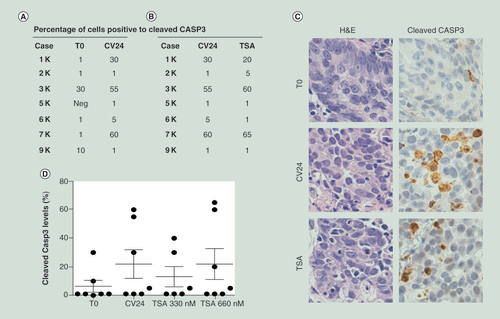
Percentage of cells positive to cleaved Casp 3 protein assay evaluated by immunohistochemistry in organotypic models at 24 h of culture (CV24) compared with uncultured tissues (T0) (A) and after treatment with TSA (B) compared with control vehicle (CV24). (C) Representative case (1K) stained with H&E and antibody against the cleaved Casp3. Original Magnification: ×40. (D) Cleaved protein positive cells (expressed as percentages) in tissue slices after 24 h of TSA treatment compared with T0 and CV24. Bars represent mean ± standard error of the mean.
H&E: Hematoxylin and Eosin; TSA: Trichostatin A.
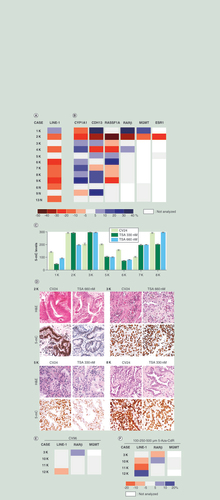
(A & B) Differences of methylation levels observed in LINE1 (A) and gene promoters (B) in neoplastic (1–9K) and non-neoplastic (6, 9 and 13N) tissue slices after 24 h of TSA treatment. All TSA-treated samples were compared with the vehicle (CV24). The boxes represent the differences of methylation expressed as percentages. The color scale is defined in the bottom. Methylation differences exceeding ±5% were considered informative. (C & D) 5-mC levels by immunohistochemistry observed at T0 and after TSA treatment (330 and 660 nM). (C) Global methylation changes before and after TSA treatment. All data were scored by multiplying the percentage of positive cells (0–100%) for the staining intensity (scale of 0-absent staining to 3-strong staining). Maximum value = 300. Bars represent mean ± standard error of the mean. (D) Representative images of four cases, stained with H&E and a 5-mC antibody. Original magnification: ×200. (E & F) Differences of methylation levels expressed as percentages in LINE-1 and in RARβ and MGMT promoters observed after 96 h of culture (CV96) (E) and 96 h of treatment with 5-Aza-CdR (F). The cultured samples were compared with uncultured tissues (T0) (E) and the 5-Aza-CdR treated samples were compared with vehicle (CV96) (F).
5-mC: 5-methylcytosine; H&E: Hematoxylin and Eosin; TSA: Trichostatin A.
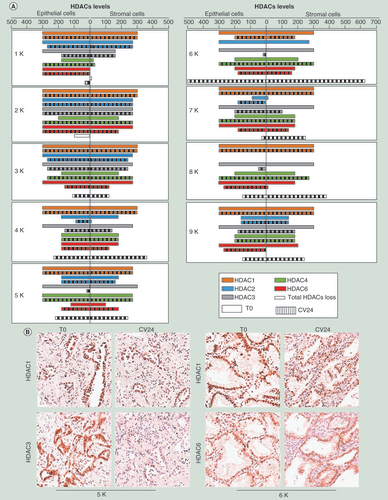
(A) HDAC1–4 and 6 expression levels observed by immunohistochemistry in uncultured tissues (T0, solid bars) and after 24 h of culture (CV24, dashed bars) in epithelial and stromal components of the tumor cases (1–9K). The values represented in the scale bars (maximum value = 300) are obtained by multiplying the percentage of positive cells (0–100%) for the staining intensity (scale of 0-absent staining to 3-strong staining). HDACs total loss was shown for each case. For each sample, the score value represents the mean of two independent experiments with a standard deviation ≤20. (B) Two representative cases at T0 and after 24 h culture stained for HDAC1, HDAC3 and HDAC6.
Original magnification: ×200.
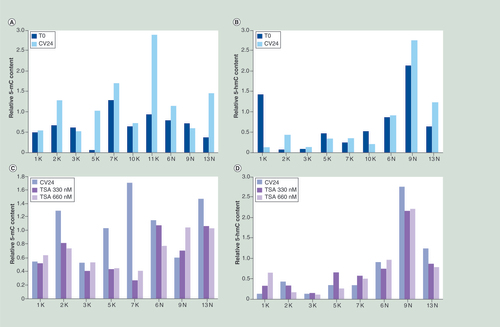
Relative content of 5-mC and 5-hmC in the organotypic cultures after 24 h of culture without treatment (A & B) and after 24 h of TSA treatment (C & D) obtained by slot blot DNA analysis. The experiment was performed by hybridization with specific 5-mC and 5-hmC antibodies, followed by densitometry quantification. In all cases the methylation and the hydroxymethylation levels were normalized compared with the DNA amount, evaluated by α-ssDNA antibody. In particular, we determined the 5-hmC and 5-mC levels by normalizing the intensity of the spot obtained with the anti-5-hmC or anti-5-mC, with that from the anti-ssDNA used as loading control. Accordingly, the quantification of 5-hmC and 5-mC is a relative value. T0: Uncultured samples, CV24: Control after 24 h of culture. The values are the means of two replicates.
5-mC: 5-methylcytosine; 5-hmC: 5-hydroxymethylcytosine; TSA: Trichostatin A.
Epigenetics refers to variations of gene expression without any change in the DNA sequence, including the addition of chemical groups that covalently bind to the DNA and the histones. The most important changes are the methylation of cytosine, methylation, acetylation and ubiquitination of the histone tails. The epigenetic modifications are heritable during cell divisions and primarily regulate the physical DNA accessibility to the molecular complexes designate to transcription, controlling gene expression [Citation1–3].
The alterations of the epigenetic pathways are very frequently present in cancer and now considered as hallmarks of tumorigenesis, together with genetic/genomic variations. The knowledge of the epigenetic changes is of increasing relevance in clinical practice focused to discover novel therapeutic targets, such as the epigenetic regulatory enzymes, ‘druggable’ targets for cancer therapy [Citation4,Citation5].
In the past few years, several drugs with epigenetic activity have received approval for the treatment of cancer patients, the ‘epigenetic cancer therapy’ [Citation6–8], leading to an increased interest on their modes of action. The main ‘epigenetic drug’ classes, the HDAC inhibitors and the DNMT inhibitors, have proven chromatin remodeling properties, however, they show substantial limitations in their epigenetic specificity [Citation5–8] and, moreover, for a number of drugs, not all the molecular targets are yet known. In addition, an increasing body of evidence highlights that, despite the proven clinical benefit of the epigenetic drugs, a direct link between the clinical response and the specific epigenetic modification induced by the treatment has not yet been fully elucidated [Citation4].
The microenvironment plays a significant role in human cancer progression although its influence on tumor epigenetics remains unclear [Citation9,Citation10]. There are only two reports on epigenetic changes in 3D culture models [Citation11,Citation12] and no studies have yet reported on the chromatin remodeling agents (CRAs) effects on ex vivo structurally intact tissues. DesRochers et al. [Citation11] documented, in 3D tissue cultures, that the epigenetic regulation of the E-cadherin is dynamic and sensitive to the induction of complex homotypic cell–cell interactions. Moreover, Amatangelo et al. [Citation12], investigating on 2D and 3D human epithelial ovarian cancer cultures the effect of a specific inhibitor of the histone methyltransferase EZH2, observed inhibition of cell growth, invasion and apoptosis induction in the 3D culture only. Both studies highlight the importance of the microenvironment and 3D architecture on tumor epigenetic modifications.
The importance of the microenvironment in tumor biology suggests the need to use culture models able to preserve the complex tissue architecture to better understand the mode of action of CRAs.
We investigated, in a preclinical model characterized by organotypic cultures [Citation13,Citation14], the epigenetic response induced by culturing, HDAC inhibitor Trichostatin A (TSA) and DNMT inhibitor 5-aza-2′deoxycytidine (5-Aza-CdR). The organotypic culture preserves ex vivo the original tissue microenvironment and the morphology, cell viability, 3D architecture and tumor heterogeneity. Recently, this model has been independently validated to predict the clinical response to anticancer drugs [Citation15]. The epigenetic response to culture and CRAs was evaluated in cells from non-neoplastic and neoplastic tissues maintaining their original structure. In organotypic cultures obtained from lung surgery, we assessed: the global DNA methylation and hydroxymethylation levels; the methylation profile of ‘long interspersed nuclear elements’ LINE1 and the methylation status of a panel of genes with tissue-specific expression or with tumor suppressor activity; the expression pattern of several HDACs.
Materials & methods
Samples
Fresh tumor (n = 12) and adjacent nontumor (n = 3) lung tissues were recovered immediately after surgical resection at the Division of Pathology, Fondazione IRCCS Ca’ Granda Ospedale Maggiore Policlinico, Milano, Italy. Tumor samples were composed of an epithelial neoplastic component (adenocarcinoma n = 9; metastatic colonic adenocarcinoma n = 1; squamous cell carcinoma n = 2) and a supporting stroma which was made up of vessels, fibroblasts and inflammatory cells. Adenocarcinomas were subtyped according to 2014 WHO classification. Clinical pathological features are shown in .
The patients did not receive chemotherapy and/or radiotherapy before surgery. Informed consent was obtained from all patients and approved by Institutional Ethical Committee of the IRCCS Fondazione Ospedale Maggiore Policlinico (Milan, Italy).
Organotypic tissue slices preparation, culturing & treatments
In order to prepare the organotypic tissue cultures, fresh tissue samples were immediately cut into serial thin slices (400 μm) using a vibratome VT1200 (Leica Microsystems, Wetzlar, Germany). The tissue slices were cultured as previously described by our group [Citation13]. Tissue slices were treated with 330, 660 nM TSA (Sigma Aldrich, St. Louis, MO, USA) for 24 h or with 100, 250, 500 μM 5-Aza-CdR (Sigma Aldrich, St. Louis, MO, USA) for 96 h. 5-Aza-CdR was dissolved at the concentration of 50 mM in 0.45% NaCl containing 10 mM sodium phosphate (pH 6.8), while for TSA a 3.30 mM solution in absolute ethanol was prepared. Tissue slices treated with vehicle were included as control. At the each time point (T0, after 24 h or 96 h of culture and treatment), tissue slices were collected and formalin-fixed and paraffin-embedded (FFPE) for further analyses.
Morphological & immunohistochemical analysis
All FFPE samples were analyzed for morphologic integrity assessment by Hematoxylin and Eosin (H&E) staining. Immunohistochemistry (IHC) analysis was performed using antibodies against 5-methylcytosine (5-mC, 1:400; ab10805; Abcam, Cambridge, UK), HDAC1 (1:1000; NBP1–78101; Novus Biologicals, Littleton, CO, USA), HDAC2 (1:1000; NBP2–16790; Novus Biologicals), HDAC3 (1:1000; NB110–57033; Novus Biologicals), HDAC4 (1:400; NBP2–16793; Novus Biologicals), HDAC6 (1:200; NBP2–03269; Novus Biologicals).
Apoptosis was analyzed using anticleaved caspase-3 (Casp3) antibody (1:4000; #9661; Cell Signaling, Boston, MA, USA). The Casp3 score was calculated as the percentage of positive cells in the sample. A two-score system for the percentage of positive cells and the intensity of staining was used to quantify the reactivity of 5-mC and HDACs levels. The intensity of staining was expressed in a scale of 0 (absent staining) to 3 (strong staining). Two investigators independently examined all slides and, when discrepancies occurred, the cases were reviewed until a consensus was reached. Representative images were obtained using an LMD108 system (Leica Microsystems, Wetzlar, Germany). For each IHC analysis, we included two negative and one positive controls: a tissue slide with only the secondary antibody and one with only the primary antibody (negative controls) and, in agreement with manufacturer’s instruction, a tissue slide positive for the analyzed protein (positive control).
DNA isolation, conversion & pyrosequencing
Genomic DNA was purified from five 10 µm thin FFPE slices using the QIAamp DNA Mini Kit (Qiagen, Limburg, The Netherlands), according to the supplier’s protocol. Sodium bisulphite conversion of DNA (400 ng) was performed using the EZ DNA Methylation-Direct™ Kit (Zymo Research Corporation, Orange, CA, USA). PCR of the promoters of the following genes: CYP1A1, MGMT, RARβ, CDH13, RASSF1A, ESR1 and DAPK1 were performed using 100–170 ng of bisulphite-treated DNA and 10 pmol of forward and reverse primers. Pyrosequencing assays were carried out using the Pyro Mark ID instrument (Qiagen, Limburg, The Netherlands) as previously described [Citation16,Citation17]. Raw data were analyzed using the Q-CpG software v1.0.11 (Biotage, Uppsala, Sweden), which calculates the ratio of converted C (T) to unconverted C at each CpG site, giving the percentage of methylation. Primer sequences and genomic positions are provided in .
PyroMark® Q96 CpG LINE-1 kit (Qiagen, Limburg, The Netherlands) was used to analyze the LINE1 retrotransposable elements methylation levels, according to manufacturer’s protocol. Specifically, the methylation levels were determined by the quantification of methylation of four CpG sites in position 331–305 of LINE1 (Gene Bank accession number X58075).
DNA slot blotting
For each sample, 500 and 300 ng of DNA were analyzed to evaluate the 5-hydroxymethylcytosine (5-hmC) and 5-mC, respectively. DNA was added to the denaturation buffer (0.4 mM NaOH, 10 mM EDTA) in a final volume of 200 μl and denatured for 10 min at 100° C. Samples were rapidly chilled for 5 min on ice and then applied to a positively charged nylon membrane (Amersham Hybond–N+, GE Healthcare, Little Chalfont, UK) using a 24-well slot blot vacuum manifold (Hybri-slot manifold, Bethesda Research Laboratories, USA). The membrane was twice washed in 2× SSC buffer and air-dried. Membranes were probed with monoclonal antibodies specific to 5-mC (1:500) and to 5-hmC (1:2000) (Monoclonal antibody hydroxymethyl and methylcytosine detection kit BI-KMCY-0050, Eurogentec Kaneka, Osaka, Japan). As loading control, the same membranes were probed with a rabbit polyclonal antibody (1:1000) raised against single-stranded DNA (α-ssDNA, Demeditec Diagnostics, Kiel-Wellsee, Germany). Subsequently, membranes were blotted with either a mouse (α-5mC and α-5hmC membranes) or a rabbit (α-ssDNA membranes) IgG antibody (1:5000, Santa Cruz Biotechnology, Dallas, Texas, USA) conjugated to horseradish peroxidase. Following treatment with enhanced chemiluminescence substrate, membranes were scanned on G:BOX Chemi XT4 (Syngene, Cambridge, UK) imaging system. Spot intensity was quantified using GeneTools Gel Analysis software (Syngene). Intersample differences in global 5-hmC and 5-mC levels were calculated by densitometric analysis of slot blots. 5-hmC and 5-mC values were normalized to the α-ssDNA loading control. Values are the means of two technical replicates. This method was previously described [Citation18].
Statistical analysis
For the statistic evaluations, differences among samples were analyzed using the unpaired Student’s t-test and Prism 4.0 (GraphPad Inc, La Jolla, CA, USA) and the correlations were evaluated by the linear regression test. Statistical significance was assumed for a probability value (p) less than 0.05.
Results
The organotypic cultures were harvested after tissue sectioning immediately after surgery. Briefly, the tumors were sliced by vibratome at 400 μm thickness and cultured in 6-well plates for up to 96 h. The schematic overview of the experimental design is summarized in .
Tissue composition and its variability in the serial slices were assessed histologically and epithelial/stroma percentages were scored in cultures, in relation to uncultured samples (control T0). In 12 out of 13 cases, the percentage of neoplastic (i.e., epithelial) cells displayed a maximum variation of 20% compared with T0. Only the case K3 showed, in part of the serial sections (T0 vs 24 h of culture), a larger variation. The validity of using a 20% cut off has been proposed and validated in previous studies applying molecular approaches [Citation19].
The culture modifies the epigenetics of specific genes & of LINE1
Several epigenetic studies [Citation20–28] carried out on primary or established cell lines, demonstrated that the procedures of tissue dissociation (e.g., enzymatic treatment), the components of the culture medium (e.g., growth factors) as well as the ex vivo status can modify the epigenome.
To evaluate the effect of the in vitro condition on the epigenetics of cells maintained in their original organ architecture (organotypic culture), we quantitatively assessed the methylation of LINE1, which is an index of the global genome stability, and of a number of gene promoters, in organotypic cultures obtained from three normal (N), eight non-small-cell lung cancer (1,3–9 K) and one colorectal lung metastasis (2K) specimens (). Of these, two were normal-tumor pairs (6N-6K and 9N-9K).
It is important to highlight that our model allows to analyze, for the first time, the real effect of the ex vivo culturing. Indeed, the epigenetic modifications in primary and established cell lines can be also due to additional effects such as the tissue dissociation and the cells selection.
For each sample, the methylation value represents the mean of at least two independent experiments with a standard deviation ≤3%. Given that, the pyrosequencing has an analytical sensitivity of 5% in detecting CpGs methylation [Citation29], we considered as informative a methylation variation exceeding ±5%.
In a subset of cases, the overall methylation was also evaluated by IHC with 5-mC antibody.
In all experiments, we compared the T0 to the sample after 24 h of culture (CV24), using sequential tissue slices.
At 24 h of culture and in absence of drugs, among the cases with an appreciable methylation variation (seven out of twelve) we found an increase of LINE1 methylation (range: +8/+25%) in six out of seven (A & Supplementary Table 1).
This trend did not reflect the behavior of the gene promoters. Indeed, we observed that the promoter methylation of the investigated genes, both with tissue-specific expression (CYP1A1) and tumor suppressor activity (MGMT, RARβ, CDH13, RASSF1A, ESR1 and DAPK1) variably changed (B). In particular, two genes often showed changes exceeding ±5% of the methylation range: CDH13 was frequently demethylated (six out of seven cases, range: -5/-13%), whereas CYP1A1 showed a heterogeneous response (six out of nine cases were demethylated, range: -6/-25%, whereas three displayed increase of methylation, range: +6/+39%) (B & Supplementrary Table 1). However, the demethylated promoters at T0, rarely modified their methylation status (Supplementary Table 1).
We studied CYP1A1 methylation because the enhancer is methylated in normal lung and its demethylation can be associated with smoking habit [Citation30,Citation31].
In addition, we noted a different behavior of the tumor compared with the nontumor counterpart. The samples 6K and 9K showed LINE1 (+8 and +23%, respectively), CYP1A1 (+9 and +6%, respectively) and CDH13 (-5% in 9K) variations of methylation whereas, the corresponding non-neoplastic tissues (6N and 9N), did not display methylation changes ( & Supplementary Table 1). Despite the limited number of samples, we noted that, when cultured, normal tissues were epigenetically more stable compared with the cancer samples ( & Supplementary Table 1).
In seven cases (1–3K, 5–7K and 8K) we evaluated the global methylation by IHC with 5-mC antibody. Epithelial tumor cells displayed methylation changes in five cases. In detail: 1K, 2K, 6K and 8K displayed increase and 3K decrease of the immunoreactivity (C & D). Variations in LINE1s and/or promoters methylation were not correlated with the immunohistochemical changes.
Finally, using caspase 3 cleavage assay, we observed an induction of apoptosis in epithelial tumor cells after 24 h of organotypic culture in three out of seven cases (A, C & D). These data are in agreement with those obtained with in vitro primary or established cell lines cultures [Citation32].
The epigenetic response to the chromatin remodeling agents
Several evidences demonstrated the epigenetic activity of the HDAC and DNMT inhibitors on primary or established cell lines [Citation33–43]. In these culture models the link between the treatment and the epigenetic changes of specific targets is well documented, although this action is much less evident in clinical practice [Citation4]. This is possibly ascribed to the relatively simple model represented by in vitro cell cultures compared with the complexity of the in vivo system. In order to evaluate the effects of CRAs on cells maintained in their tissue architecture, we analyzed, in our ex vivo model, the epigenetic changes of the LINE1 and the gene promoters listed above after treatment with the HDAC inhibitor TSA (cases 1–9K and 6N, 9N and 13N) and the DNMT inhibitor 5-Aza-CdR (cases 3K and 10–12K).
Importantly, the demethylation of LINE1 and all the promoters analyzed in this study after treatment with CRAs, was previously described in tumor cell lines [Citation34,Citation35,Citation37–43].
In the TSA experiments, we compared the untreated sample after 24 h of culture with the sample treated with TSA (330 and 660 nM) for 24 h, using sequential tissue sections.
After 24 h of culture in presence of TSA, we observed that the neoplastic and non-neoplastic samples showed an overall LINE1 demethylation (eight out of nine cases exceeding ±5% of the methylation variation, range: -10/-29%), as expected for HDAC inhibitor treatment, including cases in which the culture triggered an increased methylation (A & Supplementary Table 2). This suggests a homogeneous effect of the drug on the repetitive DNA sequences in the organotypic culture model, irrespective to the changes induced by culture. In the same culture conditions, the gene promoters responded to TSA (330 or 660 nM) in a more variable manner (B & Supplementary Table 2), showing demethylation for some promoters and increase of methylation for others (B). Remarkably, we found an unexpected increase of methylation in some gene promoters, in particular CYP1A1 (range: +7/+25%) and CDH13 (range: +6/+33%). This could be explained by the overall deregulation of cells epigenetics induced by TSA, which can result in down but also in upregulation of specific genes [Citation44,Citation45].
The study of the global methylation by IHC evidenced changes in all cases: 1K, 2K, 5K, 6K and 8K showed demethylation, whereas 3K and 7K displayed an increased methylation (C & D). It is notable that in the cases 2K, 3K and 8K, the global methylation variations induced by culture were opposite, compared with that induced by TSA (C & C).
It was reported that CRAs lead to apoptosis in several types of cancer cell lines, including lung cancer [Citation46,Citation47]. Differently, in our experimental setting, we noticed variable levels of apoptosis irrespective of culturing conditions and TSA treatment (). It is peculiar that, in cell maintained in their organ architecture, culture condition per se induced apoptosis powerfully then CRAs.
Finally, in cases 3K, 10–12K, we assessed the effect of DNMT inhibitor 5-Aza-CdR on the DNA methylation of LINE1, MGMT and RARβ promoters.
The 5-Aza-CdR demethylation activity depends on passive methylation loss and is not due to the direct inhibition of DNMT, and necessarily needs a longer treatment compared with that with the TSA (96 h vs 24 h) [Citation48]. Therefore, the organotypic culture is not the ideal model for investigating such a treatment.
Nevertheless, we analyzed serial tissue slices, comparing the untreated sample after 96 h of culture with the sample treated with 5-Aza-CdR (100–250–500 µM) for 96 h. Although after 96 h a significant amount of necrosis was generally present, we observed changes of methylation in both LINE1 and RARβ promoter (E & F).
The culture conditions can remodel the HDACs expression status
To evaluate the possible correlation between the levels of HDACs and the epigenetic response to culture and TSA, we analyzed the expression status of the main TSA substrates: HDAC 1, 2, 3, 4 and 6. We evaluated, by IHC analysis, the levels of the HDACs basal (T0) and after 24 h of culture in tumor epithelial and stromal cells. We have chosen to investigate HDAC expression by IHC, instead of the mRNA evaluation by RT-PCR, since IHC allowed us to distinguish the distribution of the HDAC enzymes within the tissue composition (epithelial vs stromal cells). We observed that the culture triggered a strong and sample-specific response of the HDACs expression. An overview of all cases, considering the entire panel of the analyzed HDACs, showed a reduction of the HDACs 2 (4K and 6K), 3 (1K and 4–9K) and 6 (3K and 7–9K) in both tumor and stroma cells, and an increase of the HDAC 4 (1–3K and 6–8K), whereas HDAC 1 was unchanged (). In particular, cases 4–6, and 8K showed a strong reduction principally of the HDAC 2 and/or 3 (A). Interestingly, the case 2K, which had the higher response to culture and TSA treatment (based on variation of methylation in LINE1 and promoters), showed the most stable levels of HDACs expression after 24 h of culture (). We observed a similar HDACs status at T0 and after 24 h of culture comparing tumor epithelial and stromal cells in almost all cases. We did not find significant correlation between the HDACs expression status and the epigenetic response (i.e., variation of methylation of LINE1 and promoters), probably due to the elevated variability of the sample response.
Culturing & chromatin remodeling treatment can increase the 5-hydroxymethylation global level
In order to better understand the effect of culture and chromatin remodeling treatment (TSA) on DNA methylation, we analyzed the global levels of 5-mC and 5-hmC. The 5-hmC is considered an intermediate of active DNA demethylation mediated by TETs enzymes family [Citation49–51]. However, it was recently reported that this modification could be also produced during passive demethylation [Citation52].
We performed slot blot experiments using specific antibodies for 5-mC and 5-hmC, followed by densitometry quantification, on 10 tumor and 3 non-tumor samples (1–3, 5, 7, 10 and 11K, 6, 9 and 13N).
In all cases, the methylation and hydroxymethylation levels have been normalized and compared with the DNA amount. To assess the validity of our method, we applied the regression curve to the results obtained by the slot blot analysis with α-ssDNA, 5-mC and 5-hmC antibodies of a scalar dilutions of brain DNA and we found significant R2 values (5-mC R2 = 0.915 and 5-hmC R2 = 0.924, Supplementary Figure 1).
After 24 h of culture, in absence of the CRA, we observed a generalized increasing of the DNA methylation (eight out of ten cases) in both non-tumoral and tumor samples (A). Differently, the levels of 5-hmC varied in a sample specific way, with an increase in six samples (2, 3, 7K and 6, 9 and 13N) and a decrease in the others (B).
The treatment with TSA for 24 h modified the levels of both 5-mC and 5-hmC ( C & D). In particular, we observed a reduction of 5-mC in almost all the neoplastic and non-neoplastic samples. Interestingly, after the CRA treatment, the level of methylation in tumor samples was significantly lower than in non-tumoral samples (mean methylation 0.52 vs 1.06, respectively; p = 0.000067). Regarding the hydroxymethylation, we observed an appraisable increase of 5-hmC in three out of five tumors samples but not in non-neoplastic specimens.
Notably, we found a lower level of hydroxymethylation in tumor compared with nontumoral samples (mean hydroxymethylation 0.37 vs 1.35, respectively; p = 0.00001).
Our overall results indicate a frequent (five out of eight cases) effect of the drug on DNA methylation and suggest that the culture and the TSA treatment can trigger an increment of 5-hmC that could be caused by active DNA demethylation.
Discussion
Differently from genetic alterations, epigenetic changes, although heritable, are reversible, thus presenting opportunities for therapeutic strategies designed to reverse transcriptional abnormalities involved in tumorigenesis. The main ‘epigenetic drugs’, HDAC and DNMT inhibitors, have proven chromatin remodeling properties but show substantial limitations in the epigenetic specificity and, to date, their mode of action in vivo is largely unclear.
Several epigenetic studies on primary or established cell lines showed that culturing and CRAs treatments can modify the epigenome, commonly leading to a global demethylation [Citation20–28,Citation33–43]. However, cell lines models lose the tissue architecture, the tumor microenvironment and the spatial distribution of cancer and stromal cells within the tumor. Consequently, the influence of these crucial issues on the epigenetic response to environment changes and drug treatments is lost.
New evidences [Citation11,Citation12] highlighted the relevance of the microenvironment on the epigenetics and bring to light the need to use culturing models that are able to preserve the tissue morphology, to better understand the effect of the culturing and CRAs on the epigenome.
We studied the epigenetic response induced by the culture and the treatments with TSA and 5-Aza-CdR, in a preclinical model based on organotypic cultures from neoplastic and non-neoplastic specimens, able to preserve the morphology of the tissue of origin, including the spatial distribution of cancer and stromal cells within the tumor.
It is important to note that the organotypic culture allowed us to analyze for the first time, the real effect of the ex vivo culturing, since the epigenetic variations in primary cell lines can be also due to other additional effects such as tissue dissociation and cells selection.
Comparing to other in vitro models, such as primary and established cell lines, in organotypic cultures we found that culturing frequently induced an unexpected increase of the overall and LINE1 DNA methylation, whereas treatment with CRAs often led to a general DNA demethylation (IHC experiments), including LINE1. However, the culture and treatment with CRAs may cause heterogeneous effects on gene promoters methylation, since the samples responded in a specific way, showing demethylation of some promoters and increased methylation of others. Moreover, we explored the presence of the active demethylation, not previously investigated in 3D ex vivo condition, and we observed that culturing and TSA treatment trigger cytosine hydroxymethylation, that is an intermediate of the cytosine active demethylation [Citation49–51]. However, we cannot exclude that the increase of the 5-hmC level can be also due to passive demethylation mechanisms [Citation52].
Finally, we found that culturing can modify the HDACs expression pattern.
These overall results suggest an individual and case-specific epigenetic response of the samples, probably due to the original genetic and epigenetic status of each tissue and to heterogeneity in tumor composition. This individual response was also evidenced by the different ability of the tissues to trigger the active DNA demethylation, highlighted by increased 5-hmC levels, and to modify the HDACs expression.
Notably, we found an increased methylation for some regions, also after treatment with TSA. Similar data, showing the downregulation of active genes after the CRAs treatment associated with epigenetic changes (enrichment of silenced chromatin markers), have been already described. Rodriguez et al. [Citation44] reported that upon 5-azacytidine and TSA treatment, transcriptional changes were accompanied by the loss of the CCCTC-binding factor at the boundaries of the different histone methylation domains, suggesting that drug treatment might also affect the locus structure and organization. Consequently, expression domains are disrupted and the spreading of the silencing marks over the promoter regions of active genes of the domain can result in their transcriptional downregulation. These authors emphasized the importance of studying epigenetics in the context of chromatin domains rather than isolated genes, because transcriptional output for a given gene after drug treatment depends not only on its basal chromatin modifications, but also on the chromatin signatures of the neighboring genes. This central concept is further integrated by our observations that the epigenetic profiles and the CRAs response are peculiar for each sample and probably influenced by the specific environmental context of each specimen.
Our overall findings on non-neoplastic tissues show a major epigenetic stability compared with tumor counterpart. Although more cases are needed to confirm these data, our observation is consistent with the new concept of the ‘epigenetic vulnerability’ of the tumor cells, based on the finding that epigenetic inhibitors cause a dramatic effect on malignant cells, whereas their normal counterparts remain generally unaltered. This evidence suggests that, in normal cells, the epigenetic regulators can function in a multilayered and redundant manner, allowing an ‘epigenetic homeostasis’. Differently, in cancer cells, a disturbance of the epigenetic balance, however slight, can be sufficient to result in a cell catastrophe, because the alteration in the expression of several cancer genes is often due to epigenetic defects [Citation53].
Conclusion & future perspective
This study is the first report on the epigenetic effects of culturing and CRAs on normal and cancer cells maintained in their native tissue architecture.
We think that the different responses of the organotypic cultures to treatments and culturing could be related to the specific and unique genomic/epigenomic constitution of each sample that comprises the germline and tumor profiles, and to the impact of the tissue microenvironment on tumor biology.
Our data, together with those of the literature, evidence that the epigenetic landscape can be very susceptible to the environment conditions and can change very quickly. In our opinion, the organotypic cultures, based on their characteristics, can represent a preclinical model more appropriate, comparing with cell lines, for epigenetic studies.
Although our findings were obtained from a small number of cases, they can be considered as a proof of concept on the value to test CRAs epigenetic effects on ex vivo tissues. Therefore, the organotypic cultures can be a useful and feasible approach to study the response of the tumor to epigenetic drugs.
Table 1. Clinical features of tumor samples.
Table 2. PCR and pyrosequencing primers for methylation analysis.
Background
Alterations of epigenetic pathways are hallmarks of tumorigenesis, together with genetic and genomic variations.
Tumor epigenetic defects are of increasing relevance to clinical practice, because they are important ‘druggable’ targets for cancer therapy using chromatin-remodeling agents (CRAs).
New evidences highlight the importance of the microenvironment in the epigenome regulation and stress the need to use culture models that are able to preserve tissue morphology to better understand the mode of action of CRAs.
Results
We studied the epigenetic response induced by culture conditions and CRAs treatment, in a preclinical model of organotypic cultures, preserving ex vivo the original tissue microenvironment and morphology, from non-neoplastic and neoplastic specimens.
We assessed different epigenetic signatures: the methylation profile of the LINE1; the methylation profile of a panel of tumor suppressor genes; the expression pattern of the histone deacetylase; the global DNA methylation and hydroxymethylation.
Organotypic cultures highlighted important differences compared with other ex vivo models, such as primary and established cell lines.
Culturing frequently induced an overall increase of LINE1 methylation, whereas CRAs caused LINE1 demethylation. In addition, culture and CRAs caused heterogeneous effects on the genes methylation. The samples displayed an individual and specific response, showing demethylation of some promoters and an increased methylation of others.
Our overall findings support that CRA drug treatments affect the global DNA methylation and can trigger an active DNA demethylation.
Finally, we noted that the culture-induced alterations in the histone deacetylase expression pattern.
Conclusion
We reported original data on the impact of the microenvironment and native tissue architecture on the epigenetic changes triggered by culturing and CRAs.
Our overall data suggest that CRAs can work in a gene promoter specific manner.
The variable responses of the organotypic cultures to treatments and culturing could be related to the specific and unique genomic/epigenomic constitution of each sample that comprises the germline and tumor profiles, and to the impact of the tissue microenvironment on tumor biology.
Despite the limited number of cases, our findings can be considered a proof of concept of the possibility to test CRAs epigenetic effects on ex vivo tissues maintained in their native tissue architecture.
Author contributions
SM Sirchia conceived, designed, conducted the study and wrote the manuscript. M Miozzo, S Bosari and S Tabano contributed to study design and manuscript preparation. A Faversani, D Rovina, Maria V Russo, L Paganini, F Savi and C Augello performed laboratory experiments, data interpretation and contributed to figure preparation and manuscript reviewing. F Savi and A Del Gobbo performed pathological and immunohistochemical evaluations. L Rosso provided samples and contributed to data interpretation. All authors read and approved the manuscript.
Ethical conduct of research
The authors state that they have obtained appropriate institutional review board approval or have followed the principles outlined in the Declaration of Helsinki for all human or animal experimental investigations. In addition, for investigations involving human subjects, informed consent has been obtained from the participants involved.
Supplemental Figure
Download JPEG Image (996.2 KB)
Supplemental Document
Download MS Excel (32.5 KB)Supplemental Document
Download MS Excel (20 KB)Supplementary data
To view the supplementary data that accompany this paper please visit the journal website at: http://www.tandfonline.com/doi/full/10.2217/epi.15.111
Financial & competing interests disclosure
This work was supported by grant from the Fondazione IRCCS Ca’ Granda, Ospedale Maggiore Policlinico: “5X1000” (Grant Number 519-01) to M Miozzo. The authors have no other relevant affiliations or financial involvement with any organization or entity with a financial interest in or financial conflict with the subject matter or materials discussed in the manuscript apart from those disclosed.
No writing assistance was utilized in the production of this manuscript.
Additional information
Funding
References
- Esteller M . Cancer epigenomics: DNA methylomes and histone-modification maps . Nat. Rev. Genet.8 ( 4 ), 286 – 298 ( 2007 ).
- Jones PA , BaylinSB . The epigenomics of cancer . Cell128 ( 4 ), 683 – 692 ( 2007 ).
- Esteller M . Epigenetics in cancer . N. Engl. J. Med.358 ( 11 ), 1148 – 1159 ( 2008 ).
- Rius M , LykoF . Epigenetic cancer therapy: rationales, targets and drugs . Oncogene31 ( 39 ), 4257 – 4265 ( 2012 ).
- Miozzo M , VairaV , SirchiaSM . Epigenetic alterations in cancer and personalized cancer treatment . Future Oncol.11 ( 2 ), 333 – 348 ( 2015 ).
- Egger G , LiangG , AparicioA , JonesPA . Epigenetics in human disease and prospects for epigenetic therapy . Nature429 ( 6990 ), 457 – 463 ( 2004 ).
- DeWoskin VA , MillionRP . The epigenetics pipeline . Nat. Rev. Drug Discov.12 ( 9 ), 661 – 662 ( 2013 ).
- Fandy TE , HermanJG , KernsPet al. Early epigenetic changes and DNA damage do not predict clinical response in an overlapping schedule of 5-azacytidine and entinostat in patients with myeloid malignancies . Blood114 ( 13 ), 2764 – 2773 ( 2009 ).
- Spencer VA , XuR , BissellMJ . Extracellular matrix, nuclear and chromatin structure, and gene expression in normal tissues and malignant tumors: a work in progress . Adv. Cancer Res.97 , 275 – 294 ( 2007 ).
- Spencer VA , XuR , BissellMJ . Gene expression in the third dimension: the ECM-nucleus connection . J. Mammary Gland Biol. Neoplasia15 ( 1 ), 65 – 71 ( 2010 ).
- DesRochers TM , ShamisY , Alt-HollandAet al. The 3D tissue microenvironment modulates DNA methylation and E-cadherin expression in squamous cell carcinoma . Epigenetics7 ( 1 ), 34 – 46 ( 2012 ).
- Amatangelo MD , GaripovA , LiH , Conejo-GarciaJR , SpeicherDW , ZhangR . Three-dimensional culture sensitizes epithelial ovarian cancer cells to EZH2 methyltransferase inhibition . Cell Cycle12 ( 13 ), 2113 – 2119 ( 2013 ).
- Vaira V , FedeleG , PyneSet al. Preclinical model of organotypic culture for pharmacodynamic profiling of human tumors . Proc. Natl Acad. Sci. USA107 ( 18 ), 8352 – 8356 ( 2010 ).
- Faversani A , VairaV , MoroGPet al. Survivin family proteins as novel molecular determinants of doxorubicin resistance in organotypic human breast tumors . Breast Cancer Res.16 ( 3 ), R55 ( 2014 ).
- Majumder B , BaraneedharanU , ThiyagarajanSet al. Predicting clinical response to anticancer drugs using an ex vivo platform that captures tumor heterogeneity . Nat. Commun.6 , 6169 ( 2015 ).
- Sirchia SM , TabanoS , MontiLet al. Misbehaviour of XIST RNA in breast cancer cells . PLoS ONE4 ( 5 ), e5559 ( 2009 ).
- Lesma E , SirchiaSM , AnconaSet al. The methylation of the TSC2 promoter underlies the abnormal growth of TSC2 angiomyolipoma-derived smooth muscle cells . Am. J. Pathol.174 ( 6 ), 2150 – 2159 ( 2009 ).
- Nestor CE , OttavianoR , ReddingtonJet al. Tissue type is a major modifier of the 5-hydroxymethylcytosine content of human genes . Genome Res.22 ( 3 ), 467 – 477 ( 2012 ).
- Dijkstra JR , TopsBB , NagtegaalID , van KriekenJH , LigtenbergMJ . The homogeneous mutation status of a 22 gene panel justifies the use of serial sections of colorectal cancer tissue for external quality assessment . Virchows Arch.467 ( 3 ), 273 – 278 ( 2015 ).
- Migeon BR , Jan de BeurS , AxelmanJ . Frequent derepression of G6PD and HPRT on the marsupial inactive X chromosome associated with cell proliferation in vitro . Exp. Cell Res.182 ( 2 ), 597 – 609 ( 1989 ).
- Catania J , FairweatherDS . DNA methylation and cellular ageing . Mutat. Res.256 ( 2–6 ), 283 – 293 ( 1991 ).
- Hornsby PJ , YangL , RajuSG , MaghsoudlouSS , LalaDS , NallasethFS . Demethylation of specific sites in the 5′-flanking region of the CYP17 genes when bovine adrenocortical cells are placed in culture . DNA Cell Biol.11 ( 5 ), 385 – 395 ( 1992 ).
- Allegrucci C , WuYZ , ThurstonAet al. Restriction landmark genome scanning identifies culture-induced DNA methylation instability in the human embryonic stem cell epigenome . Hum. Mol. Genet.16 ( 10 ), 1253 – 1268 ( 2007 ).
- Duranthon V , WatsonAJ , LonerganP . Preimplantation embryo programming: transcription, epigenetics, and culture environment . Reproduction135 ( 2 ), 141 – 150 ( 2008 ).
- Novak P , JensenTJ , GarbeJC , StampferMR , FutscherBW . Stepwise DNA methylation changes are linked to escape from defined proliferation barriers and mammary epithelial cell immortalization . Cancer Res.69 ( 12 ), 5251 – 5258 ( 2009 ).
- Locke WJ , ClarkSJ . Epigenome remodelling in breast cancer: insights from an early in vitro model of carcinogenesis . Breast Cancer Res.14 ( 6 ), 215 ( 2012 ).
- Lazaraviciute G , KauserM , BhattacharyaS , HaggartyP , BhattacharyaS . A systematic review and meta-analysis of DNA methylation levels and imprinting disorders in children conceived by IVF/ICSI compared with children conceived spontaneously . Hum. Reprod. Update20 ( 6 ), 840 – 852 ( 2014 ).
- Hiura H , OkaeH , ChibaHet al. Imprinting methylation errors in ART . Reprod. Med. Biol.13 ( 4 ), 193 – 202 ( 2014 ).
- Xie H , TubbsR , YangB . Detection of MGMT promoter methylation in glioblastoma using pyrosequencing . Int. J. Clin. Exp. Pathol.8 ( 1 ), 636 – 642 ( 2015 ).
- Anttila S , HakkolaJ , TuominenPet al. Methylation of cytochrome P4501A1 promoter in the lung is associated with tobacco smoking . Cancer Res.63 ( 24 ), 8623 – 8628 ( 2003 ).
- Tekpli X , ZienolddinyS , SkaugV , StangelandL , HaugenA , MollerupS . DNA methylation of the CYP1A1 enhancer is associated with smoking-induced genetic alterations in human lung . Int. J. Cancer131 ( 7 ), 1509 – 1516 ( 2012 ).
- Ishaque A , Al-RubeaiM . Measurement of apoptosis in cell culture . In : Animal Cell Biotechnology: Methods and Protocols (Volume 24) . PörtnerR ( Ed. ). Humana Press , New York City, NY, USA , 285 – 299 ( 2007 ).
- Sirchia SM , RenM , PiliRet al. Endogenous reactivation of the RAR tumor suppressor gene epigenetically silenced in breast cancer . Cancer Res.62 ( 9 ), 2455 – 2461 ( 2002 ).
- Nakajima M , IwanariM , YokoiT . Effects of histone deacetylation and DNA methylation on the constitutive and TCDD-inducible expressions of the human CYP1 family in MCF-7 and HeLa cells . Toxicol. Lett.144 ( 2 ), 247 – 256 ( 2003 ).
- Yu J , ZhangH , GuJet al. Methylation profiles of thirty four promoter-CpG islands and concordant methylation behaviours of sixteen genes that may contribute to carcinogenesis of astrocytoma . BMC Cancer4 , 65 ( 2004 ).
- Sirchia SM , RamoscelliL , GratiFRet al. Loss of the inactive X chromosome and replication of the active X in BRCA1-defective and wild-type breast cancer cells . Cancer Res.65 ( 6 ), 2139 – 2146 ( 2005 ).
- Fang MZ , ChenD , SunY , JinZ , ChristmanJK , YangCS . Reversal of hypermethylation and reactivation of p16INK4a, RARbeta, and MGMT genes by genistein and other isoflavones from soy . Clin. Cancer Res.11 ( 19 Pt 1 ), 7033 – 7041 ( 2005 ).
- Mahesh S , SaxenaA , QiuX , Perez-SolerR , ZouY . Intratracheally administered 5-azacytidine is effective against orthotopic human lung cancer xenograft models and devoid of important systemic toxicity . Clin. Lung Cancer11 ( 6 ), 405 – 411 ( 2010 ).
- Sappok A , MahlknechtU . Ribavirin restores ESR1 gene expression and tamoxifen sensitivity in ESR1 negative breast cancer cell lines . Clin. Epigenetics3 ( 1 ), 8 ( 2011 ).
- da Costa Prando E , CavalliLR , RainhoCA . Evidence of epigenetic regulation of the tumor suppressor gene cluster flanking RASSF1 in breast cancer cell lines . Epigenetics6 ( 12 ), 1413 – 1424 ( 2011 ).
- Koutsimpelas D , PongsapichW , HeinrichU , MannS , MannWJ , BriegerJ . Promoter methylation of MGMT, MLH1 and RASSF1A tumor suppressor genes in head and neck squamous cell carcinoma: pharmacological genome demethylation reduces proliferation of head and neck squamous carcinoma cells . Oncol. Rep.27 ( 4 ), 1135 – 1141 ( 2012 ).
- Ren JZ , HuoJR . Correlation between T-cadherin gene expression and aberrant methylation of T-cadherin promoter in human colon carcinoma cells . Med. Oncol.29 ( 2 ), 915 – 918 ( 2012 ).
- Karlic H , HerrmannH , VargaFet al. The role of epigenetics in the regulation of apoptosis in myelodysplastic syndromes and acute myeloid leukemia . Crit. Rev. Oncol. Hematol.90 ( 1 ), 1 – 16 ( 2014 ).
- Rodriguez J , MuñozM , VivesL , FrangouCG , GroudineM , PeinadoMA . Bivalent domains enforce transcriptional memory of DNA methylated genes in cancer cells . Proc. Natl Acad. Sci. USA.105 ( 50 ), 19809 – 19814 ( 2008 ).
- Rubinstein JC , TranN , MaS , HalabanR , KrauthammerM . Genome-wide methylation and expression profiling identifies promoter characteristics affecting demethylation-induced gene up-regulation in melanoma . BMC Med. Genomics3 , 4 ( 2010 ).
- Choi YH . Induction of apoptosis by trichostatin A, a histone deacetylase inhibitor, is associated with inhibition of cyclooxygenase-2 activity in human non-small cell lung cancer cells . Int. J. Oncol.27 ( 2 ), 473 – 479 ( 2005 ).
- You BR , ParkWH . Trichostatin A induces apoptotic cell death of HeLa cells in a Bcl-2 and oxidative stress-dependent manner . Int. J. Oncol.42 ( 1 ), 359 – 366 ( 2013 ).
- Christman JK . 5-Azacytidine and 5-aza-2′-deoxycytidine as inhibitors of DNA methylation: mechanistic studies and their implications for cancer therapy . Oncogene21 ( 35 ), 5483 – 5495 ( 2002 ).
- Tahiliani M , KohKP , ShenYet al. Conversion of 5-methylcytosine to 5-hydroxymethylcytosine in mammalian DNA by MLL partner TET1 . Science324 ( 5929 ), 930 – 935 ( 2009 ).
- Ito S , D’AlessioAC , TaranovaOV , HongK , SowersLC , ZhangY . Role of Tet proteins in 5mC to 5hmC conversion, ES-cell selfrenewal and inner cell mass specification . Nature466 ( 7310 ), 1129 – 1133 ( 2010 ).
- Xu W , YangH , LiuYet al. Oncometabolite 2-hydroxyglutarate is a competitive inhibitor of α-ketoglutarate-dependent dioxygenases . Cancer Cell19 ( 1 ), 17 – 30 ( 2011 ).
- Al-Mahdawi S , VirmouniSA , PookMA . The emerging role of 5-hydroxymethylcytosine in neurodegenerative diseases . Front. Neurosci.8 , 397 ( 2014 ).
- Dawson MA , KouzaridesT . Cancer epigenetics: from mechanism to therapy . Cell150 ( 1 ), 12 – 27 ( 2012 ).