
Abstract
Aim: DNA methylation is the best known epigenetic mark. Cancer and other pathologies show an altered DNA methylome. However, delivering complete DNA methylation maps is compromised by the price and labor-intensive interpretation of single nucleotide methods. Material & methods: Following the success of the HumanMethylation450 BeadChip (Infinium) methylation microarray (450K), we report the technical and biological validation of the newly developed MethylationEPIC BeadChip (Infinium) microarray that covers over 850,000 CpG methylation sites (850K). The 850K microarray contains >90% of the 450K sites, but adds 333,265 CpGs located in enhancer regions identified by the ENCODE and FANTOM5 projects. Results & conclusion: The 850K array demonstrates high reproducibility at the 450K CpG sites, is consistent among technical replicates, is reliable in the matched study of fresh frozen versus formalin-fixed paraffin-embeded samples and is also useful for 5-hydroxymethylcytosine. These results highlight the value of the MethylationEPIC BeadChip as a useful tool for the analysis of the DNA methylation profile of the human genome.

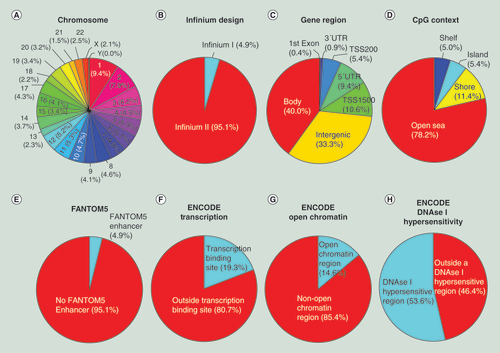
(A) Chromosome location; (B) Infinium design chemistry (Infinium I, II); (C) UCSC gene region feature category (TSS200, TSS1500, 5′UTR, 1stExon, body, 3′UTR); (D) location of the CpG relative to the CpG island (open sea, island, shore, shelf); (E) FANTOM5 associated enhancer regions; (F) ENCODE project annotation for transcription binding site; (G) open chromatin, and (H) DNase I hypersensitive regions.
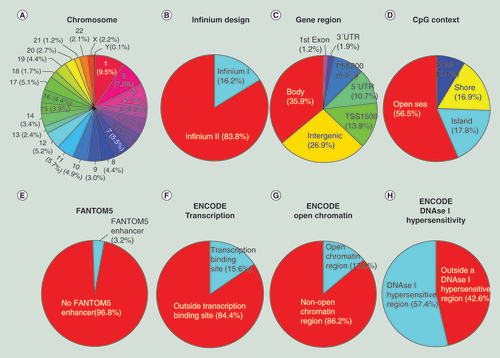
(A) Chromosome location; (B) Infinium design chemistry (Infinium I, II); (C) UCSC gene region feature category (TSS200, TSS1500, 5′UTR, 1st Exon, Body, 3′UTR); (D) location of the CpG relative to the CpG island (open sea, island, shore, shelf); (E) FANTOM5 associated enhancer regions; (F) ENCODE project annotation for transcription binding site; (G) open chromatin and (H) DNase I hypersensitive regions.
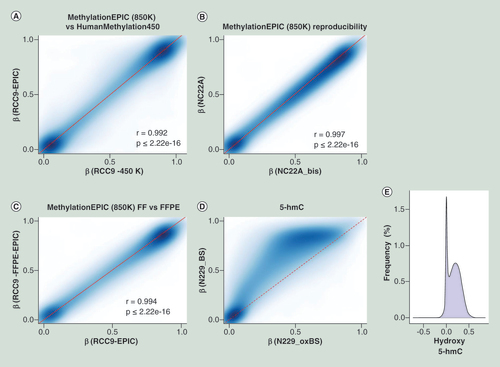
Comparison of methylation values from HumanMethylation450 and their corresponding shared CpG sites present on MethylationEPIC microarray (A) for a renal tumor sample (RCC9). Assay reproducibility (B) of methylation measurements when using technical replicates on a normal colon (NC22A) sample. Correlation plot (C) of the methylation values obtained from a FFPE sample (RCC9-FFPE) when compared with its match biopsy of the same tumor that was preserved as FF (RCC9). 5-hmC value representation (D), where the same sample was treated as per conventional bifsulfite conversion or as per oxBS. Differences on oxBS with bifsulfite conversion are due to the level of 5-hydroxymethylation, where the absence of 5-hmC has been modeled as a discontinue red line. Frequency of hydroxymethylaton values (E) as a result of subtracting the oxBS values (due to 5-mC) from the BS values (due to 5-mC + 5-hmC) for each CpG site included on the 850K array.
5-hmC: 5-hydroxymethylation; FF: Fresh frozen; FFPE: Formalin-fixed paraffin-embedded; oxBS: Oxidative bisulfite conversion.
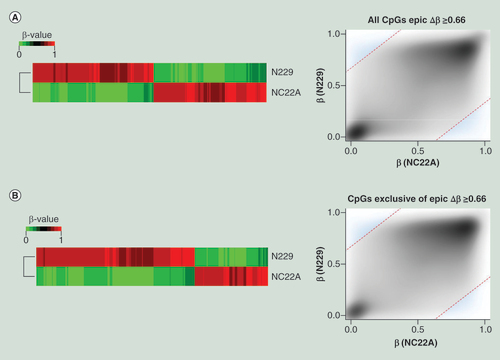
(A) Differentially methylated CpG sites (Δβ ≥0.66 ) on MethylationEPIC BeadChip microarray from a normal colon sample (NC22A), and normal sorted brain neurons (N229). Heatmap representation of differentially methylated CpG sites (left) and methylation values distribution (right) of samples where methylation differences threshold has been denoted as a discontinued red line (Δβ ≥0.66), and those values considered as differentially methylated have been highlighted in blue. (B) Differentially methylated CpG sites (Δβ ≥0.66), among the newly added 413,759 CpG sites of the MethylationEPIC BeadChip microarray, for a normal colon sample (NC22A), and normal sorted brain neurons (N229). Heatmap representation of differentially methylated CpG sites (left) and methylation values distribution (right) of samples where methylation differences threshold has been denoted as a discontinued red line (Δβ ≥0.66), and those values considered as differentially methylated have been highlighted in blue.
DNA methylation is the most recognized epigenetic mark in the human genome. The presence of 5-methylcytosine is usually associated with the transcriptional silencing of the underlying DNA sequence, while its absence permits expression if the right transcription factors are present. DNA methylation plays a major role in the determination of tissue-specific expression of genes, the silencing of endoparasitic sequences, chromosomal stability, parental-determined monoallelic expression (imprinting) and X-chromosome inactivation in females [Citation1]. These highly regulated DNA methylation patterns are altered in human disorders, particularly undergoing a massive distortion in cancer cells [Citation2–5]. The aberrant landscape of DNA methylation in tumors is very complex, however two features are striking: promoter CpG island hypermethylation associated inactivation of coding and noncoding tumor suppressor genes as well as an overall hypomethylation of the cancer genome, as has been recently shown by the existence of DNA hypomethylation blocks. Our understanding of the DNA methylation patterns in human cancer has clinical relevance in two forms: firstly it provides biomarkers to complement the classical diagnosis and prognosis indicators that predict chemosensitivity to anticancer drugs; and secondly, by itself being a target for new drugs, such as those that target DNA methyltransferases in the context of hematological malignancies [Citation6–8]. Importantly, the relevance of DNA methylation in cancer has fostered studies in other prevalent human diseases, such as dementia and cardiovascular pathologies, with focus expanding from DNA methylation events that occur in the affected tissue, as well as to the constitutive DNA methylation variants that can represent risk factors for a particular disease, using epigenetic-wide association studies (EWAS) [Citation9,Citation10]. In this regard, it is imperative to have robust and accessible techniques for acquiring extensive DNA methylation profiles from distinct cells and tissue types such that the resulting profiles are interchangeable and permit the easy data mining and comparison of results among scientists with varied interests in laboratories across the world.
Bisulfite genomic sequencing of multiple clones is the ‘gold standard’ for the determination of the CpG methylation status of a DNA sequence. This strategy combined now with deep-sequencing chemistry, has allowed the completion of whole-genome bisulfite sequences for the human genome [Citation11–15]. However, obtaining full human DNA methylomes requires a large effort in time and budget and thus are still scarce and associated with a high level of ultraspecialization. Perfectly annotated DNA microarrays with great genomic coverage are required to detect SNPs genome-wide and are used extensively in genome-wide asssociation studies (GWAS). User-friendly DNA methylation microarrays have been modeled after these and now have become widely adopted. Among these, the Illumina Infinium HumanMethylation450 BeadChip 450,000 CpG site platform (450K; Illumina Inc., CA, USA) for DNA methylation studies [Citation16] has reached a predominant place in the market and the scientific arena, being not only the platform selected for The Cancer Genome Atlas (TCGA) studies [Citation17], but also for numerous studies interrogating tumors outside these consortiums [Citation18,Citation19], the aging process [Citation13] or interindividual variability [Citation20]. The versatility of the described microarray has also been shown by its capacity to determine 5-methylcytosine DNA patterns from formalin-fixed paraffin-embedded samples [Citation21] and for the recently identified 5-hydroxymethylcytosine mark [Citation22,Citation23].
However, there is room for improvement. This is particularly true for sequences, such as enhancers, that impact the transcription while lying distal to the transcription start site [Citation24]. The existence of chromosomal territories in the interphase nucleus is now widely accepted, as is the looping and contact of DNA elements interspersed at great genomic distance. Such loops are of great relevance for transcription given that they afford the proximity and communication between gene promoters and their enhancers [Citation25] or super enhancers [Citation26,Citation27]. The implementation of chromatin conformation capture (3C)-based methods associated with deep sequencing, such as 4C [Citation28] or the Hi-C methodology [Citation29], have greatly expanded our knowledge in this area. Given that methylation status can affect the binding of cognate transcription factors [Citation30], it is highly probable that DNA methylation differences in enhancer sequences exert a major role in cell and tissue functionality and that altered profiles could contribute to human diseases. The launch of a new 853,307 CpG (850K) site platform for DNA methylation studies (MethylationEPIC BeadChip Infinium) appears to be a promising tool to address these issues, as it incorporates 333,265 CpG sites located in enhancer regions identified by the ENCODE [Citation31,Citation32] and FANTOM5 [Citation33] projects. Herein, we have validated the 850K DNA methylation microarray from a biological and technical standpoint. Our results show that the novel platform is able to reproduce the 450K DNA methylation data in a reliable manner, and is also useful in the context of formalin-fixed paraffin-embedded samples as well as in the assessment of 5-hydroxymethylcytosine. Thus, the 850K DNA methylation microarray will be a valuable tool to understand the relevance of enhancer DNA methylation to human cell biology and an essential accompanying partner for the ongoing and future international genomic projects to study disease onset.
Results & discussion
Genomic & functional classification of the over 850,000 cytosine sites in the human DNA
The widely used 450K DNA Methylation array (Infinium HumanMethylation450 BeadChip) includes 485,577 cytosine positions in human DNA distributed among all 22 autosomal and 1 sex chromosome pair. When correlated to RNA transcripts, 74.4% of CpGs correspond to coding messenger RNA genes, 0.85% are associated to noncoding RNAs (miRNAs and long noncoding RNAs) and 24.6% sites do not possess an associated transcript. Analysis of genomic distribution shows 30.9% of the sites are in CpG islands, 23% in CpG shores (sequences 2 kb upstream and downstream from CpG island), 9.7% in CpG shelves (sequences 2 kb upstream and downstream from shore regions) and 36.3% are located outside these regions (‘open sea’). Following a functional classification, 41% of the CpGs are located in proximal promoters (CpG sites located within 200 bp or 1500 bp upstream of transcription start sites, exon 1 and in 5′UTRs), 3.2% correspond to 3′UTRs, 30.9% to gene bodies and 24.6% to intergenic regions. A carefully annotated description of the 450K DNA methylation microarray has been previously published [Citation16].
The recently developed MethylationEPIC BeadChip Infinium microarray interrogates the methylation status of 853,307 CpG sites. There are 439,562 CpGs from the 482,421 CpGs included in the 450K microarray (91.1%), that are also present in the 850K DNA methylation microarray. The complete list of CpGs shared by both microarrays is shown in Supplementary Table 1. The 42,076 CpG sites (8.9%) that were included in the 450K microarray that are not present in the 850K microarray are listed in Supplementary Table 2. Most importantly, the MethylationEPIC BeadChip Infinium includes 413,745 new CpG sites not included in the 450K microarray that interrogate the DNA methylation status of other sequences of the genome, which are shown in Supplementary Table 3. The MethylationEPIC BeadChip Infinium also interrogates 2880 CNG (C stands for cytosine; N stands for any nucleotide; G stands for guanine) sites that are present in the 450K DNA methylation microarray (Supplementary Table 4), while 211 CNG sites from the 450K microarray are not included in the 850K platform. No new CNG sites are added in the EPIC platform. The 850K microarray also includes 59 SNP sites that are used for quality control processes (Supplementary Table 5). The degree of CpG site overlap between the 450K and the 850K DNA methylation microarrays is summarized in .
The 413,745 CpG newly added positions in the 850K microarray are localized among all 22 autosomal chromosomes in addition to the X and Y sex chromosomes (A). Chromosome 1 harbors the most positions (39,087, 9.4%) and chromosome Y the fewest (179, 0.04%). According to the manufacturer’s technical notes, most (95.1%) of them used the Infinium Design II, while only 4.9% used Infinium Design I (B). Following a functional classification, 25.8% of the CpGs are located in proximal promoters (CpG sites located within 200 bp [5.4%] or 1500 bp [10.6%] upstream of transcription start sites, exon 1 [0.4%] and in 5′UTRs [9.4%]), 0.9% correspond to 3′UTRs, 40% to gene bodies and 33.3% to intergenic regions (C). Relative to CpG context, 5.4% of the sites are in CpG islands, 11.4% in CpG shores, 5% in CpG shelves and, most importantly, the vast majority (78.2%) are located outside these regions (‘open sea’) (D). The observation that the newly included CpGs in the 850K DNA methylation microarray are mainly located in sequences with poor CpG content, in addition to its intergenic location (33.3%), fits with the concept that these CpG sites were incorporated from the human enhancer regions provided by the ENCODE [Citation31,Citation32] and FANTOM5 [Citation33] projects. For example, 4.9% of all the CpG sites are derived from a FANTOM5 defined enhancer (E). With respect to ENCODE regulatory elements, 19.3% of the CpGs are located within a known transcription factor binding site identified by ChIP-Seq (Chromatin Immunoprecipitation and Sequencing) (F), 14.6% are in ‘open’ chromatin regions defined by FAIRE-Seq (Formaldehyde-Assisted Isolation of Regulatory Elements Sequencing) (G) and 53.6% of the CpGs correspond to DNase hypersensitive regions identified by DNase-seq (H).
The genomic and functional context of all the 853,307 CpGs included in the MethylationEPIC BeadChip Infinium assay, including those ‘exported’ from the 450K microarray (439,562) with those newly incorporated in the 850K microarray (413,745 CpGs) was analyzed next in whole. All 22 autosomal chromosomes in addition to the X and Y sex chromosomes are present, with chromosome 1 harboring the most positions (9.5%) and chromosome Y the fewest (0.1%) (A). Considering Infinium design, most CpGs used Design II (83.8%), whereas 16.2% used Design I (B). To quantify the possible false CpG methylation calling due to the presence of a SNP, we analyzed how many 850K CpG probes have an SNP within their last ten bases and with a Minor Allele Frequency (MAF) ≥5% according to the 1000 Human Genome Project database [Citation34]. We observed that 8.8% of the CpG sites had an associated SNP with the described features (Supplementary Table 6). According to associated RNA transcripts, 623,483 CpGs (73.1%) correspond to classic coding messenger RNA genes, while 21,446 (2.5%) are linked to noncoding RNAs (9961 for miRNAs and 11,485 for long noncoding RNAs). For 229,824 (26.9%) sites there are no annotated transcripts associated with the described CpG location. Addressing the issue of functional classification, 35.2% of the CpGs are located in proximal promoters (CpG sites located within 200 bp [9.4%] or 1500 bp [13.9%] upstream of transcription start sites, exon 1 [1.2%] and in 5′UTRs [10.7%]), 1.9% correspond to 3′UTRs, 35.9% to gene bodies and 26.9% to intergenic regions (C). As a function of CpG landmarks, 17.8% of the sites are in CpG islands, 16.9% in CpG shores and 8.8% in CpG shelves, but most of the CpG sites (56.5%) are not in any of these sequences (‘open sea’) (D). If we combine the two classifications described above, we can determine that for the 300,554 CpG sites located in proximal promoters, 102,892 CpGs (34.2%) are in CpG islands, 84,491 (28.1%) in CpG shores and 18,393 (6.1%) in CpG shelves, while 94,778 (31.5%) are in other regions of the genome without any enrichment of CpG content (open sea) (). Related to regulatory regions, 3.2% of the CpG sites are within FANTOM5 described enhancer regions (E), covering 36.3% of the described FANTOM5 enhancers with at least one CpG site. The included FANTOM5 enhancers are within a CpG island, shelf or shore in 26.6% of cases, whereas the remaining 73.4% are outside these CpG sequence categories. In addition, 15.6% of the CpGs are located within a known transcription factor binding site (F), 13.8% are in open chromatin regions (G) (covering 38.7% of overlapped open chromatin regions annotated in the ENCODE project) and 57.4% correspond to CpGs within DNase I hypersensitive regions (H). 779 CpGs are located in defined imprinting regulatory sites [Citation35,Citation36]. Other detailed information about the CpGs included in the 850K array can be found at the manufacturer website [Citation37].
Validation of the 850K DNA methylation microarray: concordance with 450K microarray data, same sample reproducibility, performance in formalin-fixed paraffin-embeded samples, 5-hydroxymethylcytosine determination & clustering analysis
To prove the utility and reliability of the Infinium MethylationEPIC BeadChip for the analysis of DNA methylation, we performed five different tests. First, we provided a technical validation of the 850K DNA methylation microarray data by studying a primary renal tumor (RCC9), and comparing the obtained results from the well established and fully standardized 450K platform. We observed that DNA methylation data obtained with the new 850K microarray was highly correlated with the methylation levels detected at each CpG site using the 450K microarray (Pearson correlation coefficient r = 0.992; p ≤ 2.22e-16) (A). We also performed a replication experiment by hybridizing twice the same sample (normal colon NC22A) to the 850K microarray. We found that the methylation levels detected at CpG sites derived from each experiment were highly correlated and completely interchangeable (Pearson correlation coefficient r = 0.997; p ≤ 2.22e-16) (B). Given the excellent performance of the 450K microarray for formalin-fixed paraffin-embedded (FFPE) samples [Citation21], we wondered about the reliability of the 850K microarray to determine the DNA methylation patterns in this type of archival material. To address this issue, we hybridized to the platform the same DNA sample obtained from fresh tissue (primary renal tumor RCC9) or derived after the formalin-fixing paraffin-embedding procedure (RCC9-FFPE). We observed that the methylation levels detected at each CpG site derived from each sample were highly correlated (Pearson correlation coefficient r = 0.994; p ≤ 2.22e-16) (C). Cellular heterogeneity is a potential limitation of this part of the study, but as the FFPE section was close to the fresh-frozen section significant cellular heterogeneity is not expected. We also sought to demonstrate that the newly developed 850K DNA methylation microarray was also valuable for the study of 5-hydroxymethylcytosine patterns, as has been shown for the 450K platform [Citation22,Citation23]. To accomplish this aim, we carried out oxidation of DNA purified from sorted neurons (N229), a tissue particularly enriched for 5-hydroxymethylcytosine [Citation15,Citation38], using the TrueMethyl Array Kit (Cambridge Epigenetix, Cambridge, UK) where the final eluted fraction followed the MethylationEPIC processing according to the kit instructions for Infinium arrays. Using this approach, we were able to determine the 5′- hydroxymethylcytosine patterns in the sorted neurons (D & E). The genomic distribution of 5-hydroxymethylcytosine, their functional annotation and genomic feature enrichment are shown in Supplementary Figure 1. Finally, we assessed the ability of the 850K microarray to identify differential methylated CpG sites to allow for the study of various biological and biomedical phenomena. For this purpose, we used unsupervised DNA clustering on the 850K methylation data from tissues of varying developmental origin, such as colon mucosa (NC22A) and neurons (N229), and were able to discriminate the two normal tissues based on their methylation profiles (). Overall, 1468 CpG sites displayed differential methylation levels with delta beta values higher than 66% between these two cell types ( & Supplementary Table 7). If we lowered the threshold to a 33% delta value, 73,774 CpG sites are distinct between these normal tissues (Supplementary Table 8). For these differentially methylated CpGs, 6.2% and 12.6% were located in FANTOM5 enhancers and open chromatin regions defined by ENCODE, respectively. Most importantly, 40.5% (at delta beta value of 66%) ( & Supplementary Table 9) and 55.6% (with delta beta value of 33%) (Supplementary Table 10) of these differentially methylated sites corresponded to the newly incorporated CpGs in the 850K, a fraction that due to its enrichment in enhancer sequences could represent a powerful tool to dissect cellular and tissue lineages among different experimental conditions and clinical entities. The complete 850K and 450K data from all the described samples are available for download from NCBI GEO [Citation39].
Materials & methods
Samples
Samples included in the study were all from human origin including a primary normal colon (NC22A) that was hybridized twice to validate technical reproducibility, primary sorted neurons (N229), as well as a biopsy of a renal cancer (RCC9) which was divided in two pieces, one was stored as fresh-frozen (FF) tissue embedded in optimal cutting temperature (OCT) compound stored at -80°C, while the other piece was formalin-fixed for 8 h followed by paraffin-embedding (FFPE) and stored at room temperature (RCC9-FFPE). The corresponding Institutional Review Board approved the use of the described samples.
DNA extraction
All samples were extracted using column-based DNA extraction method (FFPE, E.Z.N.A. FFPE DNA kit, Omega Bio-Tek Inc., GA, USA; FF, DNeasy Blood & Tissue Kit; Qiagen, Hilden, Germany) following manufacturer’s instructions. All DNA samples were treated with RNaseA for 1 h at 45ºC, quantified by the fluorometric method (Quant-iT PicoGreen dsDNA Assay, Life Technologies, CA, USA), and assessed for purity by NanoDrop (Thermo Scientific, MA, USA) 260/280 and 260/230 ratio measurements. DNA integrity of FF samples was checked by electrophoresis in a 1.3% agarose gel.
Quality check of FFPE DNAs
All DNAs from FFPE blocks were checked for their suitability for FFPE restoration, as indicated by the Infinium HD FFPE QC Assay (Illumina Inc.), by performing a quantitative PCR with 2 ng of FFPE DNA. ΔCq was calculated by subtracting the average value of Cq of the interrogated sample from the Cq value of a standard provided by the manufacturer. All FFPE samples had a ΔCq <5, which is the recommended threshold for suitability for FFPE restoration.
Hydroxymethylation
Site-specific oxidation was carried out on 1 µg of gDNA of the sorted neurons in order to convert 5-hydroxymethyl cytosines (5-hmC) into its formyl derivative 5-formylcytosine (5-fC) [Citation22] using TrueMethyl Array Kit (Cambridge Epigenetix) following manufacturer’s instructions. Briefly, DNA was cleaned using provided magnetic beads and divided into two aliquots. Both aliquots were denatured, and 1 µl of oxidant solution was added to one of the aliquots (Ox-BS) while the other one (BS) underwent a mock-up oxidation process by adding 1 µl of ultrapure H20. After incubating both aliquots at 40°C for 30 min, and centrifuging to eliminate precipitates, a bisulfite conversion reaction was performed with the supernatant using supplied reagents. Desulfonation and cleanup process were applied using provided reagents before eluting the DNA with 10 µl of elution buffer. The eluate was then transferred directly to MethylationEPIC processing following kit instructions for Infinium arrays.
Bisulfite conversion
Three hundred nanograms of FFPE DNA, or 600 ng of FF DNA were randomly distributed on a 96-well plate, and processed using the EZ-96 DNA Methylation kit (Zymo Research Corp., CA, USA) following the manufacturer’s recommendations for Infinium assays.
FFPE restoration
Bisulfite-converted DNA (bs-DNA) from FFPE samples was processed as previously described [Citation21]. The DNA was denatured with NaOH for 10 min at room temperature. An 1-h reaction at 37°C was then performed with PPR (Primer Pre Restore) reagent and AMR (Amplification Mix Restore reagent) reagents supplied by the kit manufacturer, in which DNA repair is accomplished. DNA was cleaned with a ZR-96 DNA Clean & Concentrator-5 kit (Zymo Research Corp.) and eluted in 13 µl of ERB. Cleaned DNA was then denatured for 2 min at 95°C, followed by ligation incubation at 37°C for 1 h with RST and CMM reagents. The resulting material was cleaned with ZR-96 DNA Clean & Concentrator-5 kit (Zymo Research Corp.) and eluted in 10 µl of DiH20.
Array hybridization
MethylationEPIC beadarray shares the Infinium HD chemistry Assay (Illumina Inc.) used to interrogated the cytosine markers with HumanMethylation450 beadchip. Thus, the applicable protocol for MethylationEPIC is the same as for HumanMethylation450, which is the Infinium HD Methylation Assay Protocol.
Eight microliter of restored FFPE bs-DNA, 4 µl of FF bs-DNA or 7 µl of samples that underwent oxidation protocol were used to process them following the Illumina Infinium HD Methylation Assay Protocol, as previously described [Citation16]. The only difference was that the hybridization volume of processed sample used to load the microarray was 26 µl instead of the 15 µl used in the case of HumanMethylation450.
Data normalization & statistics
The resulting raw data (IDATs) were normalized (control normalization) and background corrected using the methylation module (1.9.0) available on GenomeStudio (v2011.1) software. All statistical calculation were performed under R statistical environment (v.3.1.1). The complete 850K and 450K data from all the described samples are available for download from NCBI GEO [Citation39].
Marker classification
CpG markers present on MethylationEPIC were classified based on its chromosome location, the infinium chemistry used to interrogate the marker (Infinium I, Infinium II) and the feature category gene region as per UCSC annotation (TSS200, TSS1500, 5′UTR, 1st Exon, Body, 3′UTR). Related to this last classification, categories included TSS200 as the region between 0 and 200 bases upstream from the transcriptional start site (TSS); TSS1500 category, 200–1500 bases upstream TSS; 5′UTR included the region between the TSS and the start site (ATG); CpGs within the first exon of a gene were considered as 1st Exon category; CpGs downstream the first exon including intronic regions until the stop codon, were classified as gene body; CpGs located downstream the stop codon until the poly A signal were considered as 3′UTR; and CpGs that were not classified in any of the previous categories were annotated as intergenic. When multiple genes or TSS were associated with a CpG site, category prioritization was applied following a 5′-prime to 3′-prime criteria (TSS200 > TSS1500 > 5′UTR > 1st Exon > Body > 3′UTR > Intergenic). Additional criteria included the location of the marker relative to the CpG island (open sea, island, shore, shelf), fantom 5-associated enhancer regions and regulatory regions described on ENCODE project [Citation32,Citation33] such as transcription binding site sequences, open chromatin regions and digital DNase I hypersensitivity clusters.
Conclusion
Our results validate the Infinium MethylationEPIC BeadChip (850K) as a highly reliable genomic platform for the study of DNA methylation patterns and levels in the human genome. Most importantly, in addition to showing great correlation with previous DNA methylation platforms, high reproducibility and suitability to study formalin-fixed paraffin-embeded samples and 5-hydroxymethylcytosine, it also represents an extremely valuable tool to decipher how DNA methylation changes in unexplored territories, such as enhancer sequences, contribute to cell homeostasis and human diseases.
5-methylcytosine is the most recognized epigenetic mark in the human genome.
The obtention of full human DNA methylomes requires a large effort in time and budget.
User-friendly DNA methylation microarrays, such as the Illumina Infinium HumanMethylation450 BeadChip (450K; Illumina Inc., CA, USA), have become widely adopted, but many potentially important regulatory CpG sites are not interrogated.
This study investigates whether the newly developed MethylationEPIC BeadChip (850K) can be a reliable tool for more comprehensive DNA methylation analyses.
Results & discussion
The recently developed EPIC microarray interrogates the methylation status of 853,307 CpG sites, adding 413,745 CpG positions in comparison to the 450K.
The new CpGs in the 850K microarray are enriched in regulatory regions provided by the ENCODE and FANTOM5 projects such as enhancers, transcription factor binding sites, ‘open’ chromatin regions and DNase I hypersensitive regions.
DNA methylation data obtained with the new 850K microarray was highly correlated with the methylation levels detected using the 450K microarray.
Replication experiments by hybridizing twice at 850K the same sample detected completely interchangeable CpG methylation values.
Methylation levels detected from the same DNA sample obtained from fresh tissue or formalin-fixing paraffin-embedding were highly correlated.
The 850K array was useful to determine 5′-hydroxymethylcytosine patterns in sorted neurons.
850K data permit unsupervised DNA clustering to discriminate different biological samples.
Material & methods
The samples included in the study were all from human origin including fresh-frozen and formalin-fixed paraffin-embedding.
DNA extraction, bisulfite conversion, site-specific oxidation and array hybrydization to the 450K and 850K microarrays was performed according to the manufacturer instructions (Illumina Inc.).
The complete 850K and 450K data are available for download from NCBI GEO.
Supplemental data
Download PDF (391.3 KB)Supplemental data
Download MS Excel (153.7 MB)Supplemental data
Download MS Excel (15.6 MB)Supplemental data
Download MS Excel (12 MB)Supplemental data
Download MS Excel (137.9 MB)Supplemental data
Download MS Excel (673 KB)Supplemental data
Download MS Excel (15.5 KB)Supplemental data
Download MS Excel (27.6 MB)Supplemental data
Download MS Excel (619.7 KB)Supplemental data
Download MS Excel (28.4 MB)Supplemental data
Download MS Excel (251.7 KB)Supplementary data
To view the supplementary data that accompany this paper please visit the journal website at: http://www.tandfonline.com/doi/full/10.2217/epi.15.114
Financial & competing interests disclosure
This project has received funding from the European Research Council (ERC) under the European Union’s Horizon 2020 research and innovation program (grant agreement No 640696) and under the European Community’s Seventh Framework Programme (FP7/2007–2013)/ERC grant agreement no. 268626 and from Ministerio de Economía y Competitividad (MINECO), co-financed by the European Development Regional Fund, ‘A way to achieve Europe’ ERDF, under grant no. SAF2014-55000-R, the Instituto de Salud Carlos III (ISCIII) by the Spanish Cancer Research Network (RTICC) no. RD12/0036/0039, the Cellex Foundation, the AGAUR 2014SGR633 grant and the Health and Science Departments of the Catalan government (Generalitat de Catalunya). ME is an ICREA Research Professor. The authors have no other relevant affiliations or financial involvement with any organization or entity with a financial interest in or financial conflict with the subject matter or materials discussed in the manuscript apart from those disclosed.
No writing assistance was utilized in the production of this manuscript.
Additional information
Funding
References
- Law JA , JacobsenSE . Establishing maintaining and modifying DNA methylation patterns in plants and animals . Nat. Rev. Genet.11 ( 3 ), 204 – 220 ( 2010 ).
- Jones PA , BaylinSB . The epigenomics of cancer . Cell128 ( 4 ), 683 – 692 ( 2007 ).
- Feinberg AP . An epigenetic approach to cancer etiology . Cancer J.13 ( 1 ), 70 – 74 ( 2007 ).
- Weidman JR , DolinoyDC , MurphySK , JirtleRL . Cancer susceptibility: epigenetic manifestation of environmental exposures . Cancer J.13 ( 1 ), 9 – 16 ( 2007 ).
- Esteller M . Epigenetics in cancer . N. Engl. J. Med.358 ( 11 ), 1148 – 1159 ( 2008 ).
- Ushijima T , AsadaK . Aberrant DNA methylation in contrast with mutations . Cancer Sci.101 ( 2 ), 300 – 305 ( 2010 ).
- Baylin SB , JonesPA . A decade of exploring the cancer epigenome – biological and translational implications . Nat. Rev. Cancer11 ( 10 ), 726 – 734 ( 2011 ).
- Heyn H , EstellerM . DNA methylation profiling in the clinic: applications and challenges . Nat. Rev. Genet.13 ( 10 ), 679 – 692 ( 2012 ).
- Heyn H , SayolsS , VidalE , MoranS , EstellerM . Linkage of DNA methylation quantitative trait loci to human cancer risk . Cell Rep.7 ( 2 ), 331 – 338 ( 2014 ).
- Ongen H , AndersenCL , BramsenJBet al. Putative CIS-regulatory drivers in colorectal cancer . Nature512 ( 7512 ), 87 – 90 ( 2014 ).
- Lister R , PelizzolaM , DowenRHet al. Human DNA methylomes at base resolution show widespread epigenomic differences . Nature462 ( 7271 ), 315 – 322 ( 2009 ).
- Berman BP , WeisenbergerDJ , AmanJFet al. Regions of focal DNA hypermethylation and long-range hypomethylation in colorectal cancer coincide with nuclear lamina-associated domains . Nat. Genet.44 ( 1 ), 40 – 46 ( 2011 ).
- Heyn H , LiN , FerreiraHJet al. Distinct DNA methylomes of newborns and centenarians . Proc. Natl Acad. Sci. USA109 ( 26 ), 10522 – 10527 ( 2012 ).
- Heyn H , VidalE , SayolsSet al. Whole-genome bisulfite DNA sequencing of a DNMT3B mutant patient . Epigenetics7 ( 6 ), 542 – 550 ( 2012 ).
- Lister R , MukamelEA , NeryJRet al. Global epigenomic reconfiguration during mammalian brain development . Science341 ( 6146 ), 1237905 ( 2013 ).
- Sandoval J , HeynH , MoranSet al. Validation of a DNA methylation microarray for 450,000 CpG sites in the human genome . Epigenetics6 ( 6 ), 692 – 702 ( 2011 ).
- Weisenberger DJ . Characterizing DNA methylation alterations from The Cancer Genome Atlas . J. Clin. Invest.124 ( 1 ), 17 – 23 ( 2014 ).
- Sandoval J , Mendez-GonzalezJ , NadalEet al. A prognostic DNA methylation signature for stage I non-small-cell lung cancer . J. Clin. Oncol.31 ( 32 ), 4140 – 4147 ( 2013 ).
- Villanueva A , PortelaA , SayolsSet al. DNA methylation-based prognosis and epidrivers in hepatocellular carcinoma . Hepatology61 ( 6 ), 1945 – 1956 ( 2015 ).
- Heyn H , MoranS , Hernando-HerraezIet al. DNA methylation contributes to natural human variation . Genome Res.23 ( 9 ), 1363 –13 72 ( 2013 ).
- Moran S , VizosoM , Martinez-CardúsAet al. Validation of DNA methylation profiling in formalin-fixed paraffin-embedded samples using the Infinium HumanMethylation450 Microarray . Epigenetics9 ( 6 ), 829 – 833 ( 2014 ).
- Stewart SK , MorrisTJ , GuilhamonPet al. oxBS-450K: a method for analysing hydroxymethylation using 450K BeadChips . Methods72 , 9 – 15 ( 2015 ).
- Field SF , BeraldiD , BachmanM , StewartSK , BeckS , BalasubramanianS . Accurate measurement of 5-methylcytosine and 5-hydroxymethylcytosine in human cerebellum DNA by oxidative bisulfite on an array (oxBS-array) . PLoS ONE10 ( 2 ), e0118202 ( 2015 ).
- Pennacchio LA , BickmoreW , DeanA , NobregaMA , BejeranoG . Enhancers: five essential questions . Nat. Rev. Genet.14 ( 4 ), 288 – 295 ( 2013 ).
- Shlyueva D , StampfelG , StarkA . Transcriptional enhancers: from properties to genome-wide predictions . Nat. Rev. Genet.15 ( 4 ), 272 – 286 ( 2014 ).
- Whyte WA , OrlandoDA , HniszDet al. Master transcription factors and mediator establish super-enhancers at key cell identity genes . Cell153 ( 2 ), 307 – 319 ( 2013 ).
- Hnisz D , AbrahamBJ , LeeTIet al. Super-enhancers in the control of cell identity and disease . Cell155 ( 4 ), 934 – 947 ( 2013 ).
- van de Werken HJ , LandanGet al. Robust 4C-seq data analysis to screen for regulatory DNA interactions . Nat. Methods9 ( 10 ), 969 – 972 ( 2012 ).
- Jin F , LiY , DixonJRet al. A high-resolution map of the three-dimensional chromatin interactome in human cells . Nature503 ( 7475 ), 290 – 294 ( 2013 ).
- Perini G , DiolaitiD , PorroA , Della ValleG . In vivo transcriptional regulation of N-Myc target genes is controlled by E-box methylation . Proc. Natl Acad. Sci. USA102 ( 34 ), 12117 – 12122 ( 2005 ).
- ENCODE Project Consortium . An integrated encyclopedia of DNA elements in the human genome . Nature489 ( 7414 ), 57 – 74 ( 2012 ).
- Siggens L , EkwallK . Epigenetics chromatin and genome organization: recent advances from the ENCODE project . J. Intern. Med.276 ( 3 ), 201 – 214 ( 2014 ).
- Lizio M , HarshbargerJ , ShimojiHet al. Gateways to the FANTOM5 promoter level mammalian expression atlas . Genome Biol.16 , 22 ( 2015 ).
- The 1000 Genomes Project Consortium . AbecasisGR , AutonAet al.An integrated map of genetic variation from 1,092 human genomes . Nature491 ( 7422 ), 56 – 65 ( 2012 ).
- Skaar DA , LiY , BernalAJ , HoyoC , MurphySK , JirtleRL . The human imprintome: regulatory mechanisms, methods of ascertainment, and roles in disease susceptibility . ILAR J.53 ( 3–4 ), 341 – 358 ( 2012 ).
- Court F , TayamaC , RomanelliVet al. Genome-wide parent-of-origin DNA methylation analysis reveals the intricacies of human imprinting and suggests a germline methylation-independent mechanism of establishment . Genome Res.24 ( 4 ), 554 – 569 ( 2014 ).
- Infinium MethylationEPIC BeadChip Kit Support . http://support.illumina.com/array/array_kits/infinium-methylationepic-beadchip-kit/downloads.html .
- Kriaucionis S , HeintzN . The nuclear DNA base 5-hydroxymethylcytosine is present in Purkinje neurons and the brain . Science324 ( 5929 ), 929 – 930 ( 2009 ).
- Series GSE75073 . www.ncbi.nlm.nih.gov/geo/query/acc.cgi?token=obmtwsegxncbfyb&acc=GSE75073 .