
Abstract
Bisulfite treatment-based methylation microarray (mainly Illumina 450K Infinium array) and next-generation sequencing (reduced representation bisulfite sequencing, Agilent SureSelect Human Methyl-Seq, NimbleGen SeqCap Epi CpGiant or whole-genome bisulfite sequencing) are commonly used for base resolution DNA methylome research. Although multiple tools and methods have been developed and used for the data preprocessing and analysis, confusions remains for these platforms including how and whether the 450k array should be normalized; which platform should be used to better fit researchers’ needs; and which statistical models would be more appropriate for differential methylation analysis. This review presents the commonly used platforms and compares the pros and cons of each in methylome profiling. We then discuss approaches to study design, data normalization, bias correction and model selection for differentially methylated individual CpGs and regions.
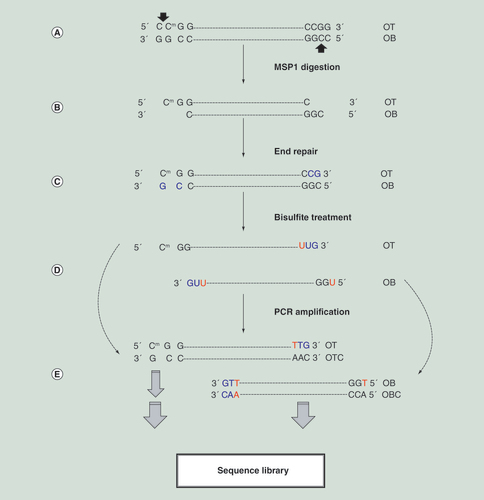
(A) Original DNA with CCGG motif at both ends. In human cytosine methylation occurs at CpG site (marked with m) and non-CpG cytosine is generally not methylated. The arrows point to the MSP1 cut sites, which is methylation independent. (B) After MSP1 digestion, DNA fragments are generated with sticky ends. Fragments in right sizes (generally 40–250 bps) for sequencing are selected. (C) The end repair adds CG (in blue, generally not methylated) from media that are not part of human sequence and needs to be removed in the analysis step. (D) The bisulfite treatment converts unmethylated cytosine to uracil but the methylated cytosine remains as cytosine. (E) The PCR amplification step converts/interprets uracil (U) as thymine (T). The amplification is based upon the original top and bottom strands, which are no longer complementary and generate their respective offspring sequences. For single end sequencing, only OT and OB sequences are used, however, for pair end sequencing all four strands are generated. Analysis need to group them correctly.
OB: Original bottom strand; OBC: Original bottom strand complementary; OT: Original top strand; OTC: Original top strand complementary.
Background
DNA methylation, as one of the major epigenetic mechanisms, plays a significant role in regulation of gene expression, organism development, X chromosome inactivation and genetic imprinting in vertebrates. Changes in methylation patterns and levels have been shown to be associated with various diseases such as cancers and genetic disorders. The easy access and relative stability of DNA make methylation experiments increasingly attractive in research and clinical settings as potential diagnostic and prognostic markers. For example, DNA methylation markers from stool can be utilized for early colorectal cancer detection [Citation1–3] and tumor methylation patterns can be used to predict treatment response or outcomes [Citation4,Citation5].
Several technologies have been developed to investigate genome-wide DNA methylation changes, which can be classified into two major categories: region-based and single-base resolution technologies. The former is represented by methyl-DNA immunoprecipitation (MeDIP) [Citation6,Citation7] and methyl-CpG binding domain MBD2 protein (MBD-seq) [Citation8,Citation9], which use antibody and methylated-CpG binding protein, respectively, to pull down the genomic regions that are methylated for sequencing. The end result is the enrichment peaks in the genomes. The bioinformatics analysis for this approach is very different from the base resolution technologies and it is not discussed in this review. The base resolution technologies all use bisulfite treatment to create an artificial C/T transition which converts unmethylated cytosine to thymine while methylated cytosine remains unchanged [Citation6,Citation10–11]. Bisulfite treated DNA can be interrogated either by methylation microarray [Citation12,Citation13] or next-generation sequencing [Citation6,Citation10–11]. While the content of microarray (such as Illumina’s 450k microarray) is fixed, the sequencing based technology offers flexibility of capturing all CpGs by whole-genome methylation sequencing (WGBS), targeting CpGs in the CpG rich regions by MSP1 digestion (reduced representation bisulfite sequencing or RRBS) or more selectively pulling down the genomic regions by capture kits such as Agilent’s SureSelect Human Methyl-Seq or NimbleGen’s SeqCap Epi Enrichment System.
The number of publications on this topic has increased in recent years about the performance, data processing and analysis of the different DNA methylation platforms, particularly for the Illumina’s 450k microarray and RRBS due to their cost-effective, high resolution and quantitative measure. However, as an emerging field, there have been no established or standard ways for data acquisition, normalization and further analysis and interpretation, which causes confusions in the field. In this paper, we compare and contrast these single-base resolution platforms, discuss the issues about data normalization and statistical model selection, and draw conclusions when possible in order to provide guidance to investigators.
Overview of the single base resolution platforms
Infinium methylation microarray
Two microarray platforms have been used, Methylation27K and Methylation450K from Illumina. Human Methylation27K contains 27,578 CpG loci and targets >14,000 genes (hg18 genome). These CpGs are selected within 1 kb upstream and 0.5 kb downstream of a gene transcription start site (TSS). On average, there are about two CpGs for these selected genes. This platform was phased out in 2010 but many datasets from this platform are deposited into public database such as Gene Expression Omnibus (GEO) that can be used for further analysis and mining.
Human Methylation450K contains approximately 480k CpG sites, covering 99% RefSeq genes (hg19) and 96% CpG islands (CGIs). These CpGs basically cover all probe-designable RefSeq genes (including miRNA), promoter regions, CGIs, CGI shores, some known differentially methylated regions (DMRs) between tumor and normal and across different tissues, and selected CGIs outside of coding regions.
The Illumina 450K chip has two probe designs: Infinium I and II. Infinium I targets each CpG with two bead types, one for methylated C and another for unmethylated C (converted to T). The two bead types are labeled by the same dye. The assumption for this design is that methylation status is the same within a 50 bp sequence. These probes can have 0–10 CpG sites and are designed either all methylated or unmethyated to match the bisulfite converted sample sequence at the target site. For the type II design, CpGs are measured using one bead type but labeled with two different dye colors for methylated (green) and unmethylated (red) cytosines. The design II does not have the 50 bp sequence assumption of design I, but may still contain up to four CpGs in a probe body. The 27k platform only has design I probes while the 450k platform contains both design I and II with II dominant (2/3 probes). The two different designs lead to various technical issues that need to be addressed in data preprocessing as detailed in the ‘Data preprocessing, normalization, & batch effect’ section. This platform requires 500 ng–1 µg input DNA.
Bisulfite DNA methylation sequencing
Four common bisulfite methylation sequencing methods are summarized in . WGBS is similar to whole-genome DNA sequencing targeting the whole genome. In human genome, with about 28 million CpGs, at least 1 billion of 100 bp end reads are needed to get approximately 30× average coverage (about four lanes of HiSeq run with 300 million reads) for WGBS. Although all CpGs may be theoretically sequenced, in practice some sites are not covered or have low coverage (1–10×). Methylation estimates at these poorly covered sites are generally not reliable and CpGs with sufficient coverage for downstream analysis are generally (minimum 10× coverage for example) in the range of 15–20 million [Citation14]. WGBS is too costly for most studies and is mainly used for a specific question where comprehensive DNA methylation profile is needed.
RRBS () uses Msp1 to pull a subset of DNA sequences to be sequenced. Msp1 is a restriction endonuclease that cuts DNA into fragments between the two Cs at CCGG sites, which are enriched in CpG islands and promoter regions. The enzyme is insensitive to methylation status of Cs so that all CCGG sites are potentially cut. DNA fragments from the digestion can be in a wide range of lengths; however, only the fragments in 40–220 bp are suitable for sequencing [Citation15]. Because CCGG sites are more enriched in CpG islands, promoter or genic region of the genome, RRBS biases toward these regions. RRBS generally captures approximately 80% of CpG islands and 60% of the promoter regions. It is the most time and cost–effective sequencing method for DNA methylation profiling of CpG islands and promoter regions [Citation11]. The required DNA amount is generally minimal (~500 ng). A drawback of the approach is that some genes have no or sparse CCGG motif and therefore they are not covered.
Agilent’s SureSelect Human Methyl-Seq [Citation16] is a target enrichment protocol for the genomic regions where methylation is known to impact gene regulation: CpG islands, CpG island shores, undermethylated regions, promoters and differentially methylated regions. It uses baits to capture 84 Mb of the human genome that includes 3.7 million CpGs for the same set of genes as the 450K array. To get that many CpGs, it is recommended to generate pair-end reads at 100 with high depth (100–150 million of reads). The required input DNA amount (3 µg) is quite high for many occasions.
SeqCap Epi CpGiant [Citation17] is a readily available capture kit to interrogate greater than 5.5 million CpG sites. In order to capture bisulfite converted DNA, probes are designed to hybridize both strands of fully methylated, partially methylated and fully unmethylated derivatives of the genomic target and then pool them together. The unique design and long probes make the system very efficient to capture more CpGs at even lower sequence depth than the Agilent’s SureSelect Human Methyl-Seq system (four samples per HiSeq 2000 lane [Citation18]). The protocol uses less input DNA (~1 µg) likely as the result of postbisulfite capture. Similarly, the platform targets the same set of genes as the 450K (99% of RefSeq genes).
Data preprocessing, normalization & batch effect
Infinium methylation microarray data
The basic data preprocessing for Illumina27K and 450k platforms is similar and comprises the following steps: bead-level signal intensity extraction; signal intensity adjustment; average beta or methylation ratio calculation, which is obtained from signal intensities using the equation:
detection p-value calculation; normalization within and/or across samples; and batch effect correction if any. Step 1–4 are generally processed with Illumina’s GenomeStudio methylation module. Optionally, background subtraction and/or control probe normalization can be used in the above steps. R package ‘minfi’ can also perform the similar tasks for the 450K platform. It has been widely observed that the data from the two probe designs (Infinium I and Infinium II) of the 450K microarray has a strong probe design bias. More specifically, Bibikova et al. [Citation19] noted a clear difference in the average beta value distributions from the two probe designs, in other words, a compression in the average beta value distribution of Infinium II probes compared with that of the Infinium I. Similarly, Dedeurwaerder et al. [Citation12] reported that the average beta values from the Infinium II probes demonstrated a narrower dynamic range than those from Infinium I probes, suggesting that Infinium II probes are less sensitive to detect the extreme methylation values close to 0 or 1. Several algorithms have been developed to correct the bias and these algorithms use different assumptions and can perform differently as detailed below.
Microarray data normalization algorithms
The purpose of normalization is to correct a systematic technical bias introduced during an assay. In addition to the biases between samples or different batches, the 450K microarray has its unique probe I and II bias. There are a number of normalization algorithms available for the 450K microarray (). The peak adjustment is initially proposed to correct this bias [Citation12], which uses methylation M value (log ratio of methylated vs unmethylated signal intensity) and rescales design II probe data to the peak positions of design I probes. It is a normalization method within a sample, which is implemented in R package IMA [Citation20]. Another approach, Subset Quantile Normalization (SQN) [Citation21], first selects a subset of probes from design I as reference and then adjusts design II probes (using CpGs in the similar regions as in design I) in the same percentiles to the same value. The procedure is carried out on a batch of samples so it performs normalization both within and across samples at the same time. Similarly, the approach, Subset-quantile Within Array Normalization or SWAN [Citation22] assumes probes with the same or similar CpG density in the array perform similarly and the algorithm randomly selects a number of design I and II probes with 1, 2 and 3 underlying CpGs to calculate the quantile of these probes and then adjust the intensities of the remaining probes. The SWAN is included in R package minfi [Citation23] as a normalization option. Beta MIxture Quantile dilation (BMIQ) procedure [Citation24] applies a three-state beta-mixture model to assign probes to methylation states, subsequent transformation of probabilities into quantiles and finally a methylation-dependent dilation transformation to preserve the monotonicity and continuity of the data and adjusts the beta-values of type II design probes into the statistical distribution of type I design probes. This normalization is within a sample for probe I/II biases [Citation24] so further normalization across samples may be necessary in some cases. Methylumi [Citation25] and lumi [Citation26] R packages provide convenient raw data processing, quality control (QC) and normalization functions. While Methylumi mainly deals with background and dye bias correction through normal-exponential model and normalization control probes, lumi conducts multiple step background correction, dye bias correction on pooled two channel signal intensities by a smooth quantile method. Both methods perform the normalization across samples.
Microarray data normalization performances
With an array of normalization methods, researchers might have hard time to choose a method to use for their data. Several papers compared the relative performances of multiple methods. Using known methylation sites (such as imprinted genes, inactivated X chromosome and SNP genotyping included on the array) as accuracy measures, Pidsley [Citation27] demonstrated the most effective and best performers were simple quantile normalization on methylated and unmethylated signals from probe I and II separately. By evaluating the reduction of technical variability, elimination of probe design bias and removal of batch effect before and after normalization, another study compared quantile normalization alone, quantile normalization + BMIQ, BMIQ alone [Citation24], SWAN [Citation22] and SQN [Citation21] and obtained the similar conclusion as Pidsley et al. that the most effective method was the global quantile normalization at signal intensity followed by BMIQ probe bias adjustment [Citation28]. Studies also showed the raw data without any normalization were generally highly reproducible (according to technical replicates) in a well-controlled experiment (for an example, all samples are processed at the same time and in the same way). While some normalization approaches could slightly improve data reproducibility, others may introduce more variability into the data. In the case of good data quality, different normalizations had little impact on association results when biological signals were strong. However, when the association signals were weak, different normalizations could have dramatic impacts on results [Citation29,Citation30]. The unfavorable performance in some of the complicated and segmented quantile normalization approaches may be related to the validity of underlying assumption. For example, SWAN [Citation22] assumes that probes with same or similar CpG density on the array perform similarly; however, CpGs in the same genomic location are more likely similar. In determining whether there is a need or which normalization should be used for study data, investigators need to judge on a case-by-case basis. Although a clear benefit is obtained to correct probe I and II bias for 450K array by methods such as BMIQ [Citation24] or peak-based correction [Citation12], across-sample normalization for 450K array should not be applied blindly like the gene expression microarray [Citation31]. In our experience, when a clear systematic bias is observed, more often an indication of batch effects, normalization along with batch correction is definitely needed. The best performers [Citation27,Citation28] described in the previous section along with the batch correction function ‘Combat’ [Citation32] work very well [Citation29]. Of note, the steps should limit to the same or similar tissue types.
Data preprocessing for next-generation bisulfite sequencing data
The analysis of next-generation bisulfite sequencing data has been described previously [Citation33–35]. In short, the basic analytical steps comprise sequence read quality assessment and clean-up; alignment to reference genome; CpG methylation status extraction and annotations. The bisulfite treatment makes methylation sequencing data challenging. First, because of C/T conversion, bisulfite sequence reads are not complementary to reference genome and special alignment tools are needed; second, the C/T conversion reduces the sequence read complexity from four letters to three letters, which increases the chance of misalignment; third, while a T in a sequence read can align to C in reference sequence, the opposite is not true; fourth, pair-end sequencing from bisulfite sequencing generates four possible strands (original forward, complementary to original forward, original reverse and complementary to original reverse), the alignment needs to distinguish and group them correctly for methylation state extraction; and last, unique to RRBS, Msp1 generates sticky ends that need to be repaired by an artificial cytosine from the media before A-tail and adapter annealing. These Cs need to be removed or discarded during methylation calculation ().
The available analytical tools for bisulfite sequence data analysis can be classified into two major categories in terms of alignment strategies. The first and the most common one is to convert all Cs to Ts in the forward reference genome and Gs to As in the reverse reference genome and then align similarly converted sequence reads to both reference genomes. This algorithm is represented by BISMARK [Citation36], BS-SEEKER2 [Citation37], BRAT-BW [Citation38], LAST [Citation39], MethylCoder [Citation40], although each may use a different basic aligner and indexing algorithm [Citation35]. The second one does not convert reference explicitly but enumerate all C-to-T combinations within a user-defined seed length of the read within the program. This is implemented in BSMAP [Citation41]. The initial release of BSMAP was very slow even for RRBS but the subsequent RRBSMAP [Citation42] reduces the search space from whole genome to the genomic regions with CCGG motif, which increase its speed dramatically.
Two issues are not adequately addressed for RRBS: RRBS reads are generally short (mostly at 50 bases) to accommodate the short fragments less than 50 bps. However, a fraction of reads can still be contaminated by sequence adapters. This makes adapter trimming an indispensable step before alignment. When adapter sequence within a read is as short as a few bases, adapter trimming can be less specific and true biological bases can be trimmed off. Secondly, Msp1 cut DNA between two Cs at CCGG motif and generates sticky ends, which is followed by end repair, A-tailing and adapter ligation before bisulfite conversion. The end repair incorporates artificial CG at the end of a read. When an RRBS fragment is shorter than a sequence read, the incorporated Cs (generally not methylated) will remain and become part of DNA fragment sequence, which can bias a methylation estimate at these positions. This issue can be addressed by a standalone program Trim Galore [Citation43] or handled automatically in the later version of SAAP-RRBS [Citation44]. The tool, BSeQC [Citation45], can also be used, which takes aligned SAM/BAM and generates a new file with the incorporated bases removed.
Quality control matrix & procedures
The QC steps for DNA Illumina microarray have been described previously, which include embedded control probe assessment, bisulfite conversion, number of detectable CpGs by detection of p-value or exclusion of CpGs with overlap SNPs [Citation46]. Only the key points relevant to next-generation sequencing are discussed here. Like other next-generation sequencing data, the first level of QC is at read level. This includes base quality score, per base sequence content, duplication rate and over-represented sequences. FastQC is often used [Citation47]. However, bisulfite-treated sequence reads are different from normal genomic sequencing and several QC measures do not apply. Unlike normal sequencing where A/G/T/C are in the similar proportion for per-base content, the bisulfite sequence reads are T rich C poor in read 1 and A rich G poor in read 2 (pair end sequencing only). The read duplicate rate is generally higher for RRBS as sequence reads are generated from fixed Msp1 cut sites. As targeted fragment sizes are normally in 40–220 bases long, there can be a number of reads longer than fragment sizes, which causes the reads contaminated with sequence adapters.
After sequence level QC, the next is for alignment matrix. RRBS generally has a slightly lower alignment rate compared with the two bait capture based approaches (60–90% vs > 90%), more likely due to incomplete adapter removal. Very low alignment rates often indicate poor sample quality, other DNA contamination or poor library preparation. Bisulfite treatment is an important step for bisulfite sequencing and the efficiency can be estimated by calculating the percentage of non-CpG context cytosine converted to thymine in the human genome (may not be appropriate for some tissues or species where significant non-CpG methylation occurs), which is generally greater than 99.5%. These QC steps are integrated as part of analytical pipeline of SAAP-RRBS (or SAAP-BS) [Citation48]. Specialized QC tools are also available such as MethyQA and BSeQC [Citation45,Citation49].
Additional QC is necessary before jumping into correlative analysis with phenotypical data. CpGs with low coverage (<10× for example) should be excluded. After multiple samples are merged for a project, samples or CpGs with low call rates should also be dropped (<90% for example). The final dataset needs to be evaluated for global methylation profiles for further potential issue check (bad samples, batch effects or sample mix-up). The commonly used approaches include a density plot, principal components analysis or unsupervised clustering for samples [Citation48].
Statistical analysis for phenotype association
Dimension reduction & unsupervised clustering
High-throughput methylation data contains a lot of CpG sites that have no or little variation among study subjects and are not informative for downstream analyses. Nonspecific CpG filtering (i.e., not considering clinical phenotype) is a common dimension reduction procedure performed prior to cluster analysis for class discovery. This filtering step not only reduces the data dimension but also helps to zoom in and visualize the most important CpGs. Such analysis is conducted using average beta value from microarray or methylation ratio from bisulfite sequencing, which are equivalent and both represent the proportion of methylation at a CpG site ranging from 0 to 1. This ratio data are considered in beta distribution across study samples or replicates (although this needs to be further evaluated as this observation is mostly from methylation distribution across CpGs within an individual), and many argue that the commonly used variance (or standard deviation) filtering method bias features with mean values near 0.5 and different sets of features selected would affect sample clustering for class discovery. To assess the impact of different CpG selection methods in unsupervised clustering, Wang et al. [Citation50] evaluated eight approaches and four combinations from the eight on both simulated and real datasets. Although the complex methods (Transformed Quantile Goodness-of-fit, Transformed Moment Goodness-of-fit and Beta Quantile Goodness-of-fit) showed better feature selections for a simulated data, their performances were quite variably (sometimes very poor) in the real datasets, suggesting that filtering methods are sensitive to the underlying DNA methylation distributions and the better performers for the simulated data are optimized for the targeted beta distribution. Surprisingly, the most commonly used and simple method of standard deviation filtering on beta values was very robust and consistent to different real datasets and it would suffice for most occasions.
Differentially methylated CpGs identification
The most common goal of DNA methylation profiling is to find differentially methylated CpGs (DMCs) between two groups of samples. The average beta value from microarray and methylation ratio from methylation sequence data are equivalent, thus the same statistics can be applied. The average beta from microarray is derived from signal intensity of methylated and unmethylated probes; they can be optionally transformed to M value as some argue that it might be more sensitive to the sites with low variance [Citation51]. The advantage of methylation sequencing is the direct counting of methylated and unmethylated cytosines, which is more precise and accurate than the signal intensity. The count data can be used for DMC detection directly instead. The pros and cons of these are discussed in details.
The debate of Beta versus M value
The M value is the logit transformation of average beta value or directly from signal intensities
initially proposed for Illumina 27K Methylation microarray [Citation51]. The study observed obvious heteroscedasticity between highly methylated, unmethylated, and intermediate methylated CpG sites and showed that using M-value improved detection of differentially methylated CpGs in highly methylated and unmethylated sites [Citation51]. A note is that the conclusion was obtained from a couple of samples with two technical replicates each by t statistics. In a later study using seven datasets with many biologic replicates, little difference was observed in DMC selection for relatively large sample sizes by using either M or β-values, and M-values only showed some benefit with a limited sample size [Citation52]. However, the benefit of M value is complicated by its nonbiological meaningful value and for most studies it may not be worth the effort.
Statistical methods for both microarray & sequencing
The beta value from microarray and the methylation ratio from bisulfite sequencing are equivalent and the same statistics methods can be used. IMA (Illumina Methylation Analyzer for 450K) [Citation20] is specifically developed for 450K array data. It conducts a CpG level or region-level analysis by first summarizing all CpGs in the region into a single value by mean or median according to the microarray-associated annotations (such as CpG Island, TSS200, TS1500, 1st exon, CpG island shore). For the two group study design, IMA allows users to choose the moderated t statistics ‘limma’ [Citation53], Student T statistics or Wilcoxon rank sum test. Minfi [Citation23] is also for 450K array, which uses linear regression or an F-test to test association between the methylation of an individual CpG and continuous or categorical variable, respectively. When the categorical variable has two levels or groups of samples, it is equivalent to t statistics. When a sample size is <10, Minfi has an option to use the ‘limma’ [Citation53]. The ‘limma’ is widely used for gene expression microarray, which uses an empirical Bayes moderated t-test where the standard errors have been shrunk toward a common value. CpGassoc [Citation54] is developed for methylation microarray but can be used for methylation sequencing ratio data. The major advantage of the package is to handle a large dataset through parallel computing and perform a permutation test for multiple testing adjustment [Citation54]. COHCAP operates on either methylation microarray or bisulfite sequencing data using methylation ratio as input. The package has an option of Fisher’s exact test, t-tests and ANOVA [Citation55]. Attentions are needed for sequence ratio data: unlike the microarray data where all CpGs have certain variance, a number of CpGs from sequencing data can be either totally methylated (all 1s) or not methylated (all 0s) across all samples or in a group of samples in comparison. The constant values can lead to failure of statistic tests or even worse return of an odd result if this occurs only in one group of samples. The constant CpGs can be filtered out in the QC step or they should be handled properly in statistical modeling; methylation ratio from sequencing is normalized for sequence coverage at different CpG sites; however, this removes the accuracy information as the sites with higher sequence coverage have more accurate estimate. To take an advantage of the information, count-based models discussed below are more preferred; it has been argued that the methylation data are bounded between 0 and 1 with beta distribution and beta regression or logistic regression can be used. However, evidence shows that beta regression only works well if the data are really beta distributed [Citation56]. The outcome of beta regression is not as good as beta-binomial model in sensitivity although it is better than binomial model (logistic regression) in type I error control [Citation57]. The beta distribution observation is mostly derived from the density distribution of CpGs in the genome for an individual. However, for an individual CpG across a population of samples, which is the test statistics applied to, the distribution is much more complex and likely a mixture of distribution. With a sufficient sample size, a study should evaluate per CpG distribution and use the model that work well for majority of CpGs. When there is a doubt, nonparametric rank based regression may be a safer alternative [Citation56].
Count-based models for bisulfite sequencing read coverage
Bisulfite sequencing generates read coverage for a methylated or unmethylated cytosine, which can be analyzed directly. It is in fact a preferred method as methylation estimate accuracy depends on coverage; the higher the coverage is, more accurate the methylation estimate. Several count-based analysis models have been applied or proposed; however, the count-based models are not all better and some perform even worse than the ratio-based statistics. Fisher’s or chi-squared test: one of the most straightforward approaches to test for differential methylation between groups (e.g., cases and controls) is to sum the counts across subjects within a group for a given CpG site, which results in a 2 × 2 contingency table (methylated Cs/unmethylated Cs × case/control) [Citation58–62]. This approach has several issues. Fisher’s or chi-squared test is for independent observations. However, read coverage from an individual is not independent. The sequencing depth for each individual in a group in most cases is different and the pooling leads to individuals with a higher sequencing coverage having a larger influence on the test statistic unless normalized first. Furthermore, the test (after pooling) does not take biologic variability of methylation levels into consideration. Indeed, several studies have found that the approach can significantly inflate significant associations [Citation57,Citation63–64]. Clustered data analysis [Citation63]: this algorithm is developed to overcome the drawback of the Fisher’s or chi squared test by first calculating design effects and using that to adjust methylation proportion between cases and controls. The authors demonstrated the improvement of this algorithm for type I error control. However, the test still pools sequence reads together and cannot incorporate any covariates. When there are biological replicates, methylKit uses logistic regression instead of Fisher’s test for DMCs [Citation61]. The advantage is to allow covariates in the model. However, it has the similar issues as the Fisher’s or chi-squared test. Beta-binomial model is the model proposed more recently for sequencing count data [Citation57,Citation64–65]. This model has the flexibility of beta in modeling the distribution of methylation levels across replicate samples and takes into account the uncertainty associated with different coverages at the same time. From simulated and real datasets, this method appears having better control for type I error rate.
Differentially methylated region identification
CpG methylation in the genome often occurs in clusters and CpGs in the same region are correlated and perform a similar function. Identification of these correlated regions not only reduces data dimensions but also increases detection power by borrowing nearby CpG information. Several DMR identification algorithms have been developed (). In general these approaches take two steps: first to identify DMCs using one of the statistics discussed above and then to aggregate the CpGs with the similar statistics into a DMR according to the defined threshold of distance and DMC statistics. Some algorithms conduct a smoothing step before DMC detection, which smooth out outlier CpGs and utilize CpGs with a low coverage [Citation66].
Bumphunter [Citation68] is an R package for finding ‘bumps’ in genomic data. The key steps include logit transformation of methylation data, linear regression of an interested variable with potential covariates, smoothing of regression beta coefficients, DMR identification above lower threshold and permutation for DMR confidence assessment. The method customized for 450K array is part of R minfi package [Citation23]. MethylKit uses a sliding window approach or intersects with predefined genomic regions such as CpG island, promoter, etc. to aggregate methylated and unmethylated C counts and then conduct differential methylation testing through logistic regression (with biological replicates in each comparison group) or Fisher’s exact test (single sample without replicates in each comparison group) [Citation61]. BSmooth [Citation66] is developed for WGBS to smooth methylation profiles and identify DMRs. By smoothing the procedure reduces outliers from CpGs with low coverage. DMRs are identified by grouping CpGs with t statistics above thresholds and with minimum number of CpGs. BiSeq [Citation67] is mainly for targeted bisulfite sequencing such as RRBS. It starts with defining CpG clusters by finding CpG sites that are frequently covered across samples (e.g., >20 CpGs and apart <100 bp). CpGs in these clusters are then smoothed to take advantage of CpGs with low coverage and avoid missing values for CpGs not covered. The differential methylation is modeled through beta regression on the smoothed methylation level at each CpG and test for a group effect using the Wald test. Hidden Markov Model is used by several pipelines for low or high methylation region detection in the genome [Citation69,Citation70]; however, these methods are only appropriate to compare a pair of samples at a time as for a study with biological replicates in each condition, they need to be pooled first where biological variability is lost. MOABS identifies DMCs using beta-binomial hierarchical model and groups these into DMRs using a Hidden Markov Model [Citation65]. Radmeth [Citation57] identifies DMCs by beta-binomial regression and detects DMRs by jointing neighboring DMCs with p-value below user-defined threshold where regional statistics (such as log odds ratio and mean methylation difference) are the average of individual CpG sites in the region. Methylsig [Citation64] uses the same statistics for DMC detection as Radmeth; however, it provides an option of local information utilization for improved performance, particularly when a sample size is small. A tiled window (default 25 bp) is used for DMR detection. An issue with the sliding window approach is that the window definition is very arbitrary and if it is too small DMRs could be too fragmented and many of them actually belong to the same region. For purely merging DMCs into DMRs, an underlying DMC statistic independent tool Comb-p can be used to combine spatially correlated p-values into segmented regions [Citation71].
No systematic and independent evaluation is available on the performance of these DMR methods. As almost all depend on the first step DMC detection, one can speculate that the DMR result would correlate with the sensitivity and specificity of the underlying DMC method of each approach. A general conclusion from count data DMR detection methods is that the Fisher’s exact or logistic regression performed poorly [Citation57,Citation64–65]. Utilizing CpG local information may improve performance as a result of better estimate of variances and group methylation levels [Citation64]. For the smoothing methods, care is needed for the regions with low or sparse coverage as the detected DMRs can disagree with original CpG level data dramatically when selecting candidate individual CpG markers for validation or potential marker development. There can be a large discrepancy for the DMRs from the different algorithms due to DMC level statistics and how DMRs are demarcated. Fisher’s or chi-squared test should be avoided as they generate more false positives [Citation64]. Our evaluation also shows the linear models on methylation ratio or beta-binomial model are generally more conservative and more specific.
Genomic information gleaned beyond CpG methylation
Although the goal of the base resolution platforms is to interrogate CpG methylation level, additional information can be obtained from these platforms. The 450K array has been shown recently that it can be used for copy number change estimate [Citation72]. The study shows that the microarray platform can detect copy number alterations with the similar sensitivity as the SNP microarray platform; particularly for longer aberrations greater than 10 mb (sensitivity of 94 and 97% for copy gain and loss, respectively).
The major advantage of sequencing is the base call, not only on CpGs but also all bases in the captured genomic regions. The information can be used to get non-CpG methylation, call SNPs [Citation73,Citation74], estimate allele-specific methylation [Citation75] and make copy number change calls by genomic coverage [Citation76,Citation77]. Growing evidence shows non-CpG methylation plays a critical role in several cell types or tissues such as brain where it performs gene expression regulation function [Citation78,Citation79]. High confidence SNP calls (accurate >97%) from the bisulfite sequences or copy change can be used synergistically with DNA methylation for tumor diagnosis or monitoring cancer patients after tumor resection and detecting residual disease in plasma cell free DNA [Citation77]. For nonmetastatic cancers, the hypomethylation and DNA copy change could detect cancer with 68 and 94% sensitivity, respectively, with only 10 million reads. For residual cancer detection after liver cancer resection, plasma hypomethylation or copy number analysis could reach promising 87% sensitivity and 88% specificity [Citation77].
Study design considerations
Study design is the most important step for a successful research project with many aspects to be considered. In addition to clearly defined objectives and study subjects, other common considerations include which platform best serves the study goals at an affordable cost, how samples are handled or processed so that the data generated are less likely affected by technical artifacts, and how many samples have a sufficient power to detect methylation changes.
Platform selection
The first question for single base resolution methods is the selection of 450K microarray or various bisulfite sequencing methods. The 450K array is well-established, less expensive and easier for data analysis with an array of publicly available packages. It requires low amount DNA material and investigators get uniform interrogation of fixed CpGs covering approximately 99% of RefSeq genes across samples, which makes data management and analysis more convenient for a large scale study with hundreds or even a thousand of samples. On the other hand, the microarray platform is PCR-based extension reaction with florescent signals, which are less sensitive and more prone to technical variation from experimental conditions such as dye bias, batch effects and probe design bias. Although vast majority of the known genes are interrogated, the CpGs are sparse and more concentrated in the known regulatory regions. SNPs in a probe target CpG may affect PCR extension for accurate methylation estimate and targeted region with sequence similarity with other regions may cause unspecific binding. As reported, DNA methylation in the region with known SNPs is more variable and up to 8.6% of probes of the 450K array can map to multiple locations that may lead to cross-reaction and potentially measure the combined methylation from multiple genomic sites [Citation80]. WGBS is the most comprehensive and nonbiased methylome profiling method. However, it is too expensive and is only appropriate for a small scale study interested in methylation profiles of not only genic regions but broader intergenic regions. Multiple studies have shown that RRBS is the most cost-effective method for gene centric investigation. It requires very low amount of DNA (250–500 ng) and captures important CpGs in CpG islands, promoters, upstream and body of genes. The drawbacks with RRBS are nonuniform coverage of CpGs across samples, lack of coverage for some genes and complexity of analysis. Illumina SureSelect Methyl-Seq and NimbleGen SeqCap Epi CpGiant are two alternatives to RRBS. Both use baits to amplify and pull down the selected regions of the genome for sequencing, which gives more controls where and which genes are covered. The targeted gene set is similar to 450K but with six- to eightfold more CpGs. The data processing is simpler than RRBS (less likely adapter contaminated and no artificial cytosine incorporation). The limitations of these approaches are more complex library preparation step, higher input DNA amount and more expensive.
While there is no much control for cross-binding of probes in 450K microarray probes, the sequencing-based methods can simply discard the reads mapped to multiple locations in the genome. As alignment tolerates certain mismatches in a read, SNPs unlikely affect alignment and methylation estimate (only C/Ts or GAs are counted for methylation). Additionally, more information can be obtained from the sequencing approaches such as SNVs [Citation73,Citation74] and DNA copy number aberrations [Citation76,Citation77].
One of the common questions in study design for sequence-based approaches is the sequence depth, in other words, how many sequence reads are to be generated for a sample. For RRBS at selected fragment lengths, the number of CpGs that can be captured in the genome has an upper limit of around 2 million (4 million if forward and reverse cytosines are counted separately). Increasing sequence depth increases the number of CpGs with a higher coverage. Reports in the literature are mostly in the low end of sequence depths (10–40 million) and reasonable numbers of CpGs are covered [Citation6,Citation10,Citation15]. In the modern high-throughput sequencer like HiSeq2000, one can easily multiplex four or more samples per lane to get sufficient data. A caveat is that the total number of reads does not truly reflect the efficiency of an RRBS sequencing experiment as what really matters is the effective number of reads, which is determined by alignment rate, sequence length and single versus pair end reads. To accommodate shorter fragments, 50 base reads are generally used and researchers should look for alignment rate at least 70%. Pair end reads help alignment accuracy but may generate reads with redundant information for shorter fragments. For Agilent’s SureSelect Human Methyl-Seq and SeqCap Epi CpGiant, 3.7 million and 5.5 million CpG sites (from both strands) are expected at their recommended protocols (100–150 million 100 bp reads and 70–80 million 100 bp end reads), respectively. However, the number of CpGs with sufficient coverage from each is much lower and the SeqCap Epi CpGiant appears more efficient for CpG capture and the reads of 40–50 million are generally sufficient [Citation18].
A critical but difficult question is the sample size and sequence depth estimate for detection of DMCs or DMRs as there are so many factors to be considered. CpG sites are not evenly covered. The sites with a higher depth have more power to detect methylation difference [Citation57]; however some sites may not get good coverage no matter how deep the sequence would be due to sequence characteristics. Sample size requirement depends upon methylation difference between comparison groups and variability (or effect size), which can vary greatly among CpGs or different genomic regions. Knowledge in this topic is lacking and further research is needed.
Of note, all the platforms discussed here do not distinguish 5-methylcytosine (5-MC) from 5-hydroxymethylcytosine (5-HMC), an oxidized form of 5-MC discovered in recent years with important functions in gene regulation and diseases [Citation81]. To separate the two, one needs to conduct 5-hmc-specific sequencing combined with routine bisulfite sequencing such as TET-assisted bisulfite sequencing (TAB-SEQ) [Citation82] and oxidative bisulfite sequencing (OXBS-SEQ) [Citation83]. In the TAB-SEQ, β-glucosyltransferase is used to protect 5-HMC yet after application of TET1 enzyme 5-MC is oxidated to 5-carboxylcytosine (5-CAC). The following bisulfite treatment and PCR amplification convert cytosine and 5-CAC to thymine so only 5-HMC is read as cytosine. For the OXBS-SEQ 5HMC is first oxidated into 5-formylcytosine. After bisulfite treatment the latter is deformylated and deaminated to form uracil. Only 5-MC is read as cytosine. Combined with routine bisulfite sequencing the 5-HMC is inferred by taking the difference at each CPG site between the routine and the OXBS method. Control of potential batch effects regardless of microarray or sequencing, the common issue that needs careful attention is potential batch effects in the DNA methylation data. This is almost inevitable for a large study with many samples tested over a long period of time. The effect can sometimes be so dominant that it can overwhelm biological signals as described before [Citation29,Citation84–85]. For bisulfite sequence data, the batch effect can occur when samples are handled differently, bisulfite treatment has different duration and completeness, library preparation is carried out by different persons or different sequencer machines or settings are used. Although a large-scale study from bisulfite sequencing is still rare yet, care is needed as well. The best way is to avoid or minimize the issue during the experimental design and execution stage. It is highly recommended to process all samples in the same batch when possible or in the closer timeframe. Blocked assignment in which the samples to be compared are put into the same batch or a SENTRIX array for 450K is also helpful. For a large study, randomly assigning samples to different batches allows statistical correction in the analysis stage [Citation85] or batch-specific correction [Citation29]. Inclusion of technical replicates across major batches is necessary to assess and correct the potential issue.
Conclusion
Single base resolution bisulfite microarray or sequencing platforms are most common in high-throughput DNA methylation profiling. These technologies all go through bisulfite treatment step to convert unmethyated cytosine to thymine. While Illumina Infinium Methylation Microarray distinguishes C/T by signal intensity, the sequence-based technologies directly count the number of C/T coverage at the CpG site. The 450K microarray data are cheaper and easier to generate; however, it does have several technical issues investigators need to be aware of and to be properly handled. Although many available methods are available for 450K array normalization, caution is needed to use which one as some may do more harm than good in across-sample normalization. Probe I/II bias correction by peak adjustment or BMIQ is more beneficial. The sequence-based approaches capture four- to tenfold more CpGs than the 450K array and the base information can be used for genotyping and allele-specific methylation estimate. Many statistical methods can be used for DMC or DMR detection; however, they can perform very differently. The statistical methods that pool coverage information for biological replicates should be avoided. A good study design is always needed to make sure a platform can better serve investigators’ needs and they are better prepared to avoid and deal with potential technical issues.
Future perspective
As one of the cornerstones in epigenetics, the role of DNA methylation is still largely unknown. A new technology to measure DNA methylation more accurately and reliably in genome scale will continue emerging. Improvements to current technologies are being made such as use of lower amount or degraded DNA [Citation86–88], and double enzyme digestion to increase the breadth and diversity of CpG coverage for RRBS [Citation89]. DNA methylation by next-generation sequencing is going to dominate. The capture-based approaches may gain more popularity. More tests may be developed and deployed for clinical use.
Table 1. Common base resolution methylation sequencing platforms.
Table 2. Comparison of 450K data preprocessing methods/algorithms.
Table 3. Differentially methylated region detection method comparisons.
Overview of the platforms
Genome-wide single base resolution DNA methylation can be interrogated by Illumina Infinium Methylation Microarray (450K) or next-generation sequencing (whole-genome methylation sequencing, reduced representation bisulfite sequencing…).
All the platforms go through bisulfite conversion step to modify unmethylated cytosine to thymine.
The sequence approaches have much higher throughput and is direct typing of nucleotides.
Data preprocessing, normalization & batch effect
Illumina 450K has type I/II probe bias that needs to be corrected with peak adjustment or Beta MIxture Quantile.
No reliable across sample normalization has been available and the benefit is still questionable.
Batch effects can be hard to correct. The empirical Bayes method (combat) is proven to be effective.
Many tools are available for DNA methylation sequencing data.
Reduced representation bisulfite sequencing needs to be specially handled for adapter contamination and artificial bases incorporated into sequence reads.
Quality control matrix & procedures
Methylation sequencing quality control includes sequence reads, alignment, methylation call and overall profile of samples.
Statistical analysis for phenotype association
For Illumina microarray, differentially methylated CpGs can be identified by using average beta value or transforming to M-value; however, M-value is only beneficial at a small sample size.
Methylation ratio from methylation sequencing is normalized for sequence depth. The analytical options are same as the microarray data.
Sequence data are preferably analyzed using C/T count data; however, the statistics that simply pool C/T count in a group ignore biological variability and generate more false positives and should be avoided. Beta-binomial model works more favorably.
Several DMR methods are available but comprehensive comparison of their performances is lacking.
Genomic information gleaned beyond CpG methylation
The denser 450K array can be used for copy number change detection, with the comparable detection accuracy as an SNP array.
The sequencing data can also be used to detect copy number changes, particularly for caner genome.
Single nucleotide variants or allele-specific methylation can be detected or inferred from DNA methylation sequencing data.
Study design considerations
A good study design is the most important step for any research project, which include platform selection and experiment execution.
All platforms discussed here measure combined 5-methylcytosine and 5-hydroxymethylcytosine. To separate the two, TAB-Seq or oxBS-seq is needed.
Financial & competing interests disclosure
This work is partially supported by Division of Biomedical Statistics and Informatics Meritorious Award (to Z Sun), Mayo Clinic Center for Individualized Medicine and National Cancer Institute (NCI R01CA118444 to S Slager). The authors have no other relevant affiliations or financial involvement with any organization or entity with a financial interest in or financial conflict with the subject matter or materials discussed in the manuscript apart from those disclosed.
No writing assistance was utilized in the production of this manuscript.
Additional information
Funding
References
- Azuara D , Rodriguez-MorantaF , de OcaJet al. Novel methylation panel for the early detection of colorectal tumors in stool DNA . Clin. Colorectal Cancer9 ( 3 ), 168 – 176 ( 2010 ).
- Hong L , AhujaN . DNA methylation biomarkers of stool and blood for early detection of colon cancer . Genet. Test. Mol. Biomarkers17 ( 5 ), 401 – 406 ( 2013 ).
- Imperiale TF , RansohoffDF , ItzkowitzSHet al. Multitarget stool DNA testing for colorectal-cancer screening . N. Engl. J. Med.370 ( 14 ), 1287 – 1297 ( 2014 ).
- Shiovitz S , BertagnolliMM , RenfroLAet al. CpG island methylator phenotype is associated with response to adjuvant irinotecan-based therapy for stage iii colon cancer . Gastroenterology147 ( 3 ), 637 – 645 ( 2014 ).
- Fleischhacker M , DietrichD , LiebenbergV , FieldJK , SchmidtB . The role of DNA methylation as biomarkers in the clinical management of lung cancer . Expert Rev. Respir. Med.7 ( 4 ), 363 – 383 ( 2013 ).
- Bock C , TomazouEM , BrinkmanABet al. Quantitative comparison of genome-wide DNA methylation mapping technologies . Nat. Biotechnol.28 ( 10 ), 1106 – 1114 ( 2010 ).
- Ruike Y , ImanakaY , SatoF , ShimizuK , TsujimotoG . Genome-wide analysis of aberrant methylation in human breast cancer cells using methyl-DNA immunoprecipitation combined with high-throughput sequencing . BMC Genomics11 , 137 ( 2010 ).
- Aberg KA , McclayJL , NerellaSet al. Mbd-seq as a cost-effective approach for methylome-wide association studies: demonstration in 1500 case–control samples . Epigenomics4 ( 6 ), 605 – 621 ( 2012 ).
- Serre D , LeeBH , TingAH . Mbd-isolated genome sequencing provides a high-throughput and comprehensive survey of DNA methylation in the human genome . Nucleic Acids Res.38 ( 2 ), 391 – 399 ( 2010 ).
- Harris RA , WangT , CoarfaCet al. Comparison of sequencing-based methods to profile DNA methylation and identification of monoallelic epigenetic modifications . Nat. Biotechnol.28 ( 10 ), 1097 – 1105 ( 2010 ).
- Wang L , SunJ , WuHet al. Systematic assessment of reduced representation bisulfite sequencing to human blood samples: a promising method for large-sample-scale epigenomic studies . J. Biotechnol.157 ( 1 ), 1 – 6 ( 2012 ).
- Dedeurwaerder S , DefranceM , CalonneE , DenisH , SotiriouC , FuksF . Evaluation of the infinium methylation 450k technology . Epigenomics3 ( 6 ), 771 – 784 ( 2011 ).
- Sandoval J , HeynH , MoranSet al. Validation of a DNA methylation microarray for 450,000 CpG sites in the human genome . Epigenetics6 ( 6 ), 692 – 702 ( 2011 ).
- Sun Z , WuY , OrdogTet al. Aberrant signature methylome by DNMT1 hot spot mutation in hereditary sensory and autonomic neuropathy 1E . Epigenetics9 ( 8 ), 1184 – 1193 ( 2014 ).
- Gu H , SmithZD , BockC , BoyleP , GnirkeA , MeissnerA . Preparation of reduced representation bisulfite sequencing libraries for genome-scale DNA methylation profiling . Nat. Protoc.6 ( 4 ), 468 – 481 ( 2011 ).
- Agilent Technologies: SureSelect Methyl-Seq . www.genomics.agilent.com/article.jsp?pageId=3038&_requestid=542909 .
- NimbleGen . www.nimblegen.com/products/seqcap/epi-system/cpgiant/ .
- Walker DL , BhagwateAV , BahetiSet al. DNA methylation profiling: comparison of genome-wide sequencing methods and the Infinium Human Methylation 450 Bead Chip . Epigenomics doi:10.2217/EPI.15.64 ( 2015 ) ( Epub ahead of print ).
- Bibikova M , BarnesB , TsanCet al. High density DNA methylation array with single CpG site resolution . Genomics98 ( 4 ), 288 – 295 ( 2011 ).
- Wang D , YanL , HuQet al. Ima: an R package for high-throughput analysis of illumina’s 450k infinium methylation data . Bioinformatics28 ( 5 ), 729 – 730 ( 2012 ).
- Touleimat N , TostJ . Complete pipeline for infinium® human methylation 450k beadchip data processing using subset quantile normalization for accurate DNA methylation estimation . Epigenomics4 ( 3 ), 325 – 341 ( 2012 ).
- Maksimovic J , GordonL , OshlackA . Swan: subset-quantile within array normalization for Illumina Infinium HumanMethylation450 Beadchips . Genome Biol.13 ( 6 ), R44 ( 2012 ).
- Aryee MJ , JaffeAE , Corrada-BravoHet al. Minfi: a flexible and comprehensive bioconductor package for the analysis of Infinium DNA methylation microarrays . Bioinformatics30 ( 10 ), 1363 – 1369 ( 2014 ).
- Teschendorff AE , MarabitaF , LechnerMet al. A beta-mixture quantile normalization method for correcting probe design bias in Illumina Infinium 450 k DNA methylation data . Bioinformatics29 ( 2 ), 189 – 196 ( 2013 ).
- Davis S DP , BilkeS , TricheTJr , BootwallaM . Methylumi: handle Illumina methylation data . R package version 2.12.0 ( 2014 ).
- Du P , KibbeWA , LinSM . Lumi: a pipeline for processing Illumina microarray . Bioinformatics24 ( 13 ), 1547 – 1548 ( 2008 ).
- Pidsley R , CcYW , VoltaM , LunnonK , MillJ , SchalkwykLC . A data-driven approach to preprocessing Illumina 450k Methylation array data . BMC Genomics14 , 293 ( 2013 ).
- Marabita F , AlmgrenM , LindholmMEet al. An evaluation of analysis pipelines for DNA methylation profiling using the Illumina HumanMethylation450 beadchip platform . Epigenetics8 ( 3 ), 333 – 346 ( 2013 ).
- Sun Z , ChaiHS , WuYet al. Batch effect correction for genome-wide methylation data with Illumina Infinium platform . BMC Med. Genomics4 , 84 ( 2011 ).
- Wu MC , JoubertBR , KuanPFet al. A systematic assessment of normalization approaches for the Infinium 450k Methylation platform . Epigenetics9 ( 2 ), 318 – 329 ( 2014 ).
- Dedeurwaerder S , DefranceM , BizetM , CalonneE , BontempiG , FuksF . A comprehensive overview of Infinium HumanMethylation450 data processing . Brief. Bioinform.15 ( 6 ), 929 – 941 ( 2014 ).
- Johnson WE , LiC , RabinovicA . Adjusting batch effects in microarray expression data using empirical bayes methods . Biostatistics8 ( 1 ), 118 – 127 ( 2007 ).
- Huss M . Introduction into the analysis of high-throughput-sequencing based epigenome data . Brief. Bioinform.11 ( 5 ), 512 – 523 ( 2010 ).
- Reinders J , PaszkowskiJ . Bisulfite methylation profiling of large genomes . Epigenomics2 ( 2 ), 209 – 220 ( 2010 ).
- Krueger F , KreckB , FrankeA , AndrewsSR . DNA methylome analysis using short bisulfite sequencing data . Nat. Methods9 ( 2 ), 145 – 151 ( 2012 ).
- Krueger F , AndrewsSR . Bismark: a flexible aligner and methylation caller for bisulfite-seq applications . Bioinformatics27 ( 11 ), 1571 – 1572 ( 2011 ).
- Guo W , FizievP , YanWet al. BS-Seeker2: a versatile aligning pipeline for bisulfite sequencing data . BMC Genomics14 , 774 ( 2013 ).
- Harris EY , PontsN , Le RochKG , LonardiS . Brat-bw: efficient and accurate mapping of bisulfite-treated reads . Bioinformatics28 ( 13 ), 1795 – 1796 ( 2012 ).
- Kielbasa SM , WanR , SatoK , HortonP , FrithMC . Adaptive seeds tame genomic sequence comparison . Genome Res.21 ( 3 ), 487 – 493 ( 2011 ).
- Pedersen B , HsiehTF , IbarraC , FischerRL . Methylcoder: software pipeline for bisulfite-treated sequences . Bioinformatics27 ( 17 ), 2435 – 2436 ( 2011 ).
- Xi Y , LiW . BSMAP: whole-genome bisulfite sequence mapping program . BMC Bioinformatics10 , 232 ( 2009 ).
- Xi Y , BockC , MullerF , SunD , MeissnerA , LiW . RRBSMAP: a fast, accurate and user-friendly alignment tool for reduced representation bisulfite sequencing . Bioinformatics28 ( 3 ), 430 – 432 ( 2012 ).
- Babraham Bioinformatics: Trim Galore! www.bioinformatics.babraham.ac.uk/projects/trim_galore/ .
- Mayo Clinic: SAAP-RRBS . http://bioinformaticstools.mayo.edu/research/saap-rrbs/ .
- Lin X , SunD , RodriguezBet al. BSeQC: quality control of bisulfite sequencing experiments . Bioinformatics29 ( 24 ), 3227 – 3229 ( 2013 ).
- Wilhelm-Benartzi CS , KoestlerDC , KaragasMRet al. Review of processing and analysis methods for DNA methylation array data . Br. J. Cancer109 ( 6 ), 1394 – 1402 ( 2013 ).
- Babraham Bioinformatics: FastQC . www.bioinformatics.babraham.ac.uk/projects/fastqc/ .
- Sun Z , BahetiS , MiddhaSet al. SAAP-RRBS: streamlined analysis and annotation pipeline for reduced representation bisulfite sequencing . Bioinformatics28 ( 16 ), 2180 – 2181 ( 2012 ).
- Sun S , NoviskiA , YuX . MethyQA: a pipeline for bisulfite-treated methylation sequencing quality assessment . BMC Bioinformatics14 , 259 ( 2013 ).
- Wang X , LairdPW , HinoueT , GroshenS , SiegmundKD . Non-specific filtering of beta-distributed data . BMC Bioinformatics15 ( 1 ), 199 ( 2014 ).
- Du P , ZhangX , HuangCCet al. Comparison of beta-value and m-value methods for quantifying methylation levels by microarray analysis . BMC Bioinformatics11 , 587 ( 2010 ).
- Zhuang J , WidschwendterM , TeschendorffAE . A comparison of feature selection and classification methods in DNA methylation studies using the illumina infinium platform . BMC Bioinformatics13 , 59 ( 2012 ).
- Smyth GK . Linear models and empirical bayes methods for assessing differential expression in microarray experiments . Stat. Appl. Genet. Mol. Biol.3 , Article 3 ( 2004 ).
- Barfield RT , KilaruV , SmithAK , ConneelyKN . CpGassoc: an R function for analysis of DNA methylation microarray data . Bioinformatics28 ( 9 ), 1280 – 1281 ( 2012 ).
- Warden CD , LeeH , TompkinsJDet al. COHCAP: an integrative genomic pipeline for single-nucleotide resolution DNA methylation analysis . Nucleic Acids Res.41 ( 11 ), e117 ( 2013 ).
- Saadati M , BennerA . Statistical challenges of high-dimensional methylation data . Stat. Med.33 ( 30 ), 5347 – 5357 ( 2014 ).
- Dolzhenko E , SmithAD . Using beta-binomial regression for high-precision differential methylation analysis in multifactor whole-genome bisulfite sequencing experiments . BMC Bioinformatics15 ( 1 ), 215 ( 2014 ).
- Lister R , PelizzolaM , DowenRHet al. Human DNA methylomes at base resolution show widespread epigenomic differences . Nature462 ( 7271 ), 315 – 322 ( 2009 ).
- Li Y , ZhuJ , TianGet al. The DNA methylome of human peripheral blood mononuclear cells . PLoS Biol.8 ( 11 ), e1000533 ( 2010 ).
- Challen GA , SunD , JeongMet al. Dnmt3a is essential for hematopoietic stem cell differentiation . Nat. Genet.44 ( 1 ), 23 – 31 ( 2012 ).
- Akalin A , KormakssonM , LiSet al. Methylkit: a comprehensive R package for the analysis of genome-wide DNA methylation profiles . Genome Biol.13 ( 10 ), R87 ( 2012 ).
- Li S , Garrett-BakelmanFE , AkalinAet al. An optimized algorithm for detecting and annotating regional differential methylation . BMC Bioinformatics14 ( Suppl. 5 ), S10 ( 2013 ).
- Xu H , PodolskyRH , RyuDet al. A method to detect differentially methylated loci with next-generation sequencing . Genet. Epidemiol.37 ( 4 ), 377 – 382 ( 2013 ).
- Park Y , FigueroaME , RozekLS , SartorMA . MethylSig: a whole-genome DNA methylation analysis pipeline . Bioinformatics30 ( 17 ), 2414 – 2422 ( 2014 ).
- Sun D , XiY , RodriguezBet al. MOABS: model based analysis of bisulfite sequencing data . Genome Biol.15 ( 2 ), R38 ( 2014 ).
- Hansen KD , LangmeadB , IrizarryRA . BSmooth: from whole-genome bisulfite sequencing reads to differentially methylated regions . Genome Biol.13 ( 10 ), R83 ( 2012 ).
- Hebestreit K , DugasM , KleinHU . Detection of significantly differentially methylated regions in targeted bisulfite sequencing data . Bioinformatics29 ( 13 ), 1647 – 1653 ( 2013 ).
- Jaffe AE , MurakamiP , LeeHet al. Bump hunting to identify differentially methylated regions in epigenetic epidemiology studies . Int. J. Epidemiol.41 ( 1 ), 200 – 209 ( 2012 ).
- Saito Y , TsujiJ , MituyamaT . Bisulfighter: accurate detection of methylated cytosines and differentially methylated regions . Nucleic Acids Res.42 ( 6 ), e45 ( 2014 ).
- Song Q , DecatoB , HongEEet al. A reference methylome database and analysis pipeline to facilitate integrative and comparative epigenomics . PLoS ONE8 ( 12 ), e81148 ( 2013 ).
- Pedersen BS , SchwartzDA , YangIV , KechrisKJ . Comb-p: software for combining, analyzing, grouping and correcting spatially correlated p-values . Bioinformatics28 ( 22 ), 2986 – 2988 ( 2012 ).
- Feber A , GuilhamonP , LechnerMet al. Using high-density DNA methylation arrays to profile copy number alterations . Genome Biol.15 ( 2 ), R30 ( 2014 ).
- Barturen G , RuedaA , OliverJL , HackenbergM . MethylExtract: high-quality methylation maps and SNV calling from whole-genome bisulfite sequencing data . F1000Res2 , 217 ( 2013 ).
- Liu Y , SiegmundKD , LairdPW , BermanBP . Bis-snp: combined DNA methylation and SNP calling for bisulfite-seq data . Genome Biol.13 ( 7 ), R61 ( 2012 ).
- Fang F , HodgesE , MolaroA , DeanM , HannonGJ , SmithAD . Genomic landscape of human allele-specific DNA methylation . Proc. Natl Acad. Sci. USA109 ( 19 ), 7332 – 7337 ( 2012 ).
- Mosen-Ansorena D , TelleriaN , VeganzonesS , De La OrdenV , MaestroML , AransayAM . SeqCNA: an R package for DNA copy number analysis in cancer using high-throughput sequencing . BMC Genomics15 , 178 ( 2014 ).
- Chan KC , JiangP , ChanCWet al. Noninvasive detection of cancer-associated genome-wide hypomethylation and copy number aberrations by plasma DNA bisulfite sequencing . Proc. Natl Acad. Sci. USA110 ( 47 ), 18761 – 18768 ( 2013 ).
- Guo JU , SuY , ShinJHet al. Distribution, recognition and regulation of non-CpG methylation in the adult mammalian brain . Nat. Neurosci.17 ( 2 ), 215 – 222 ( 2014 ).
- Pinney SE . Mammalian non-CpG methylation: stem cells and beyond . Biology (Basel)3 ( 4 ), 739 – 751 ( 2014 ).
- Price ME , CottonAM , LamLLet al. Additional annotation enhances potential for biologically-relevant analysis of the Illumina Infinium HumanMethylation450 beadchip array . Epigenetics Chromatin6 ( 1 ), 4 ( 2013 ).
- Wang J , TangJ , LaiM , ZhangH . 5-hydroxymethylcytosine and disease . Mutat. Res. Rev. Mutat. Res.762 , 167 – 175 ( 2014 ).
- Yu M , HonGC , SzulwachKEet al. Tet-assisted bisulfite sequencing of 5-hydroxymethylcytosine . Nat. Protoc.7 ( 12 ), 2159 – 2170 ( 2012 ).
- Booth MJ , OstTW , BeraldiDet al. Oxidative bisulfite sequencing of 5-methylcytosine and 5-hydroxymethylcytosine . Nat. Protoc.8 ( 10 ), 1841 – 1851 ( 2013 ).
- Harper KN , PetersBA , GambleMV . Batch effects and pathway analysis: two potential perils in cancer studies involving DNA methylation array analysis . Cancer Epidemiol. Biomarkers Prev.22 ( 6 ), 1052 – 1060 ( 2013 ).
- Buhule OD , MinsterRL , HawleyNLet al. Stratified randomization controls better for batch effects in 450k methylation analysis: a cautionary tale . Front. Genet.5 , 354 ( 2014 ).
- Hovestadt V , RemkeM , KoolMet al. Robust molecular subgrouping and copy-number profiling of medulloblastoma from small amounts of archival tumour material using high-density DNA methylation arrays . Acta Neuropathol.125 ( 6 ), 913 – 916 ( 2013 ).
- Moran S , VizosoM , Martinez-CardusAet al. Validation of DNA methylation profiling in formalin-fixed paraffin-embedded samples using the Infinium HumanMethylation450 microarray . Epigenetics9 ( 6 ), 829 – 833 ( 2014 ).
- Dumenil TD , WocknerLF , BettingtonMet al. Genome-wide DNA methylation analysis of formalin-fixed paraffin embedded colorectal cancer tissue . Genes Chromosomes Cancer53 ( 7 ), 537 – 548 ( 2014 ).
- Wang J , XiaY , LiLet al. Double restriction-enzyme digestion improves the coverage and accuracy of genome-wide CpG methylation profiling by reduced representation bisulfite sequencing . BMC Genomics14 , 11 ( 2013 ).